. 2024 May 3;10(18):eadj0604.
doi: 10.1126/sciadv.adj0604. Epub 2024 May 1.

A reconfigurable integrated smart device for real-time monitoring and synergistic treatment of rheumatoid arthritis

Affiliations

A reconfigurable integrated smart device for real-time monitoring and synergistic treatment of rheumatoid arthritis

Yu Liu et al. Sci Adv. .

Abstract

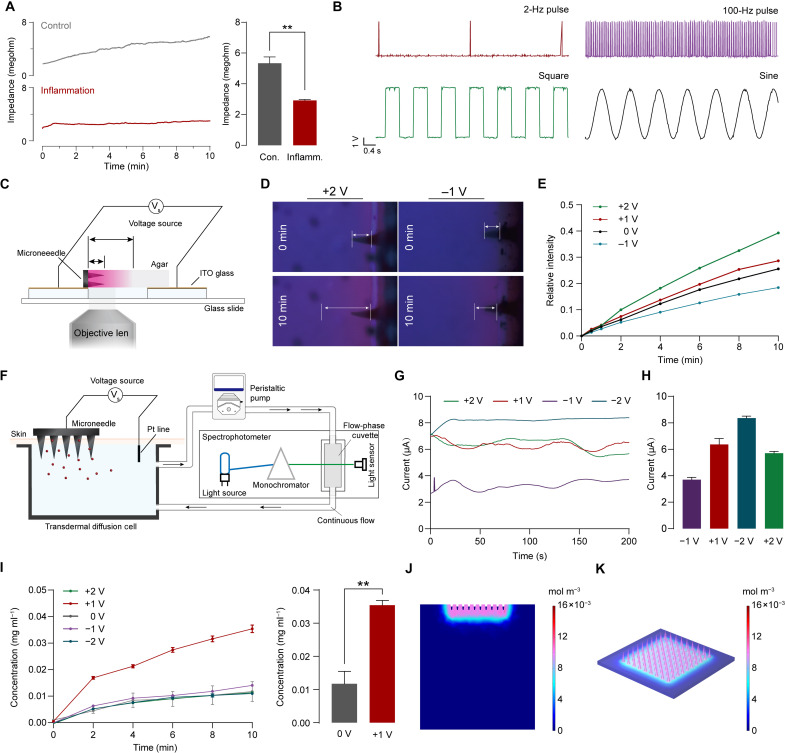
Rheumatoid arthritis (RA) is a global autoimmune disease that requires long-term management. Ambulatory monitoring and treatment of RA favors remission and rehabilitation. Here, we developed a wearable reconfigurable integrated smart device (ISD) for real-time inflammatory monitoring and synergistic therapy of RA. The device establishes an electrical-coupling and substance delivery interfaces with the skin through template-free conductive polymer microneedles that exhibit high capacitance, low impedance, and appropriate mechanical properties. The reconfigurable electronics drive the microneedle-skin interfaces to monitor tissue impedance and on-demand drug delivery. Studies in vitro demonstrated the anti-inflammatory effect of electrical stimulation on macrophages and revealed the molecular mechanism. In a rodent model, impedance sensing was validated to hint inflammation condition and facilitate diagnosis through machine learning model. The outcome of subsequent synergistic therapy showed notable relief of symptoms, elimination of synovial inflammation, and avoidance of bone destruction.


Figures

Fig. 1.
Fig. 1.. The wearable system with reconfigurable electronics and conducting polymer-based microneedles for real-time monitoring and synergistic treatment of RA.
(A) Treatment protocols sent to the system are processed by the digital module and converted into hardware configuration and drive signal of the AFE. (B) Mechanism of drug and electrical stimulation synergistic therapy using ISD. (C) Rodent models are used to collect clinical parameters to train and validate machine learning models and to evaluate the outcomes of synergistic treatments. GPIO, general-purpose input/output; CPU, central processing unit.
Fig. 2.
Fig. 2.. Overview of the ISD and the structure of the reconfigurable electronics.
(A) Schematic diagram of the ISD. (B) Exploded layer view of the designed system including AFE, digital module, LCD screen, microneedle, mechanical supports, solar cell, etc. (C) Photographs of the bottom and top view of the ISD. (D) ISD was worn on the wrist, ankle and finger comfortably and accessed through a mobile application. (E) Block diagram of the reconfigurable integral electronics. The left panel shows the function blocks of the AFE module, including two symmetrical programmable signal channels. The right panel shows the architecture of the digital module, involving power management, system-on-chip, and wireless transmission on the digital module. (F) Photographs of the top and bottom of the assembled printed circuit board of the digital module and AFE module. Scale bar, 5 mm. Calibration curve for ADC values at defined (G) potentials and (H) currents. (I) Calibration curve of DAC. RE, reference electrode; MNs, microneedles; TIA, transimpedance amplifier; LPF, low-pass filter; a.u., arbitrary units; RAM, random access memory; FPC, flexible printed cable; I/O, input/output.
Fig. 3.
Fig. 3.. Conducting polymer-based microneedle as a transdermal coupling interface.
(A) Schematic diagram of the synthesis of PPy-mesh and the fabrication process of the microneedle. (B) Close-up image of the microneedles. Scale bar, 800 μm. Insert: Macrophotography of PPy-mesh microneedles. Scale bar, 3 mm. (C) SEM image of a single needle. Scale bar, 100 μm. (D) A magnified SEM image showed the microstructure of PPy-mesh. Scale bar, 1 μm. (E) Representative image of porcine skin after treatment of the rhodamine B–loaded PPy-mesh. Scale bar, 2 mm. (F) Reconstructed 3D fluorescent images. Scale bar, 200 μm. (G) Stress-strain curve of the PPy-mesh microneedle. (H) Cyclic voltammetry of the conductive microneedle and Pt electrode. (I) Bode plot of the PPy-mesh microneedle and Pt electrode. Line denotes complex impedance plots, and dashed line denotes phase plots. (J) Nyquist plot and equivalent circuit, where Re represents the electronic resistance, Ri represents the ionic resistance, Rc represents the total ohmic resistance of the electrochemical cell assembly, Gdl represents the constant phase element of electric double-layer capacitance, and Gg is the constant phase element of the geometric capacitance. (K) Representative AFM topography image of PPy-mesh and line-cut profile of the surface. (L) Peakforce QNM images of the same region of the surface. DMT (Derjaguin-Muller-Toporov) modulus, adhesion, and deformation map of PPy-mesh obtained in air. (M) Current image obtained by tunneling AFM. Scale bars, 500 nm [(K) to (M)]. PEGDA, poly(ethylene glycol) diacrylate; TPO-L, photoinitiator ethyl (2,4,6-trimethylbenzoyl)phenylphosphinate; MAA, methacrylic anhydride; DAC, digital-to-analog mode; GND, grounding mode; REF, reference signal mode; CUR, current signal mode.
Fig. 4.
Fig. 4.. Multimodal reconfigurable features of ISD for impedance sensing, electrical stimulation, and transdermal drug delivery.
(A) Representative transdermal impedance curve and the comparison of the normal and inflammatory tissue. (B) Characterization of the pulse, square and sine waveform generated. (C) Illustration of the device for observing the transport process. (D) Fluorescence images of the dye transport under +2- and −1-V bias voltage. (E) Quantification of fluorescence intensity with different times and voltages. (F) Illustration of a circulation device for real-time transdermal simulation. (G) Current-time curves (in absolute value) of the transdermal delivery in different potential biases. (H) Comparison of current at different bias voltages. (I) Concentration profiles versus time for different potential biases and comparison of concentrations after 10 min of transdermal delivery at 0-V and +1-V bias. (J) Distribution of the substance concentration in the tissue at +1-V bias. (K) Distribution of substance concentration in the microneedle at +1-V bias. ITO, indium tin oxide. Data are means ± SD (n = 3). **P < 0.01
Fig. 5.
Fig. 5.. Electrical stimulation regulates macrophage polarization.
(A) Schematic diagram of electrical stimulation of the cell. (B) Cytotoxicity of electrical stimulation. (C) Schematic diagram of macrophage polarization. (D) Pro-inflammatory factors under different electrical stimulation times. (E) Anti-inflammatory factors under different electrical stimulation time. (F) Western blot of the expression of key macrophage proteins (CD86, the label of M1 macrophage; CD206, the label of M2 macrophage) and band quantitative analysis. (G) Representative immunofluorescence images of labeled macrophages under different stimulation times. Scale bars, 200 μm. (H) Flow cytometry to detect the polarization of macrophages under different stimulation times. Data are means ± SD (n = 3). **P < 0.01, and ***P < 0.001, ****P < 0.0001. ns, not significant.
Fig. 6.
Fig. 6.. The anti-inflammatory mechanism of electrical stimulation.
(A) Transcriptome sequencing analysis of differential genes in volcano plot. Gray is nonsignificantly differential genes, and yellow and blue are significantly different genes. (B) Clustering analysis of differential gene expression levels, where yellow indicates highly expressed protein-coding genes, and blue indicates relatively underexpressed protein-coding genes. (C) KEGG functional enrichment analysis. Larger bubbles contain more differentially encoded genes. The yellow-blue change in bubble color indicates that the smaller the P value for enrichment, the greater the significance. (D) Expression analysis of key genes in JAK/STAT signaling pathway. (E) Schematic diagram of the current stimulation regulation of macrophage polarization through the JAK/STAT signaling pathway. Normalized gene expression: (F) inflammatory effector genes and (G) inflammatory effector regulatory genes. Data are means ± SEM. (n = 3).
Fig. 7.
Fig. 7.. Impedance sensing and synergistic treatment of RA on ISD.
(A) Schematic of the study design for inflammation model and the datasets. (B) Schematic diagram of the measurement of paw temperature of rats. (C) Paw temperature during the study. (D) Schematic diagram of the measurement of paw thickness of rats. (E) Paw thickness and (F) clinical score during the experiment. (G) Heatmap of the impedance of both groups. (H) Spearman correlation matrix of all variables included in the analyses. Blue shows significant positive correlations, white shows insignificant correlations, and red shows positive correlations. Values show the Spearman rank results. (I) Forest plot summarizing multivariable logistic regression evaluating odds ratio value for inflammation condition. (J) Predicted probability of the output of the regression model. (K) Receiver operating characteristic (ROC) plot with the area under the curve (AUC) values representing the prediction performance of inflammation using our model. (L) Schematic of the study design for the synergistic treatment of RA. (M) Photograph of the treatment procedure. (N) Body weight during treatment. (O) Paw thickness curve during animal treatment and comparison between synergistic treatment and control group. (P) Clinical score. (Q) Paw temperature. Data are means ± SD (n = 4). *P < 0.05, **P < 0.01, ns, not significant. ES, electrical stimulation; CI, confidence interval; H&E, hematoxylin and eosin; IHC, immunohistochemistry.
Fig. 8.
Fig. 8.. Histopathology analysis.
(A) Schematic diagram of the analysis of inflammatory factors in blood samples by ELISA. (B) Pro-inflammatory and (C) anti-inflammatory factors in blood. (D) Schematic diagram of the analysis of inflammatory factors in synovium. (E) Pro-inflammatory and (F) anti-inflammatory factors in synovium tissue. (G) hematoxylin and eosin staining of the bone-synovial tissue. Scale bars, 100 μm. Synovial IHC analyses of the expression of (H) CD86 and (I) CD206. Scale bars, 100 μm. (J) 3D reconstructions of bone tissue via micro–computed tomography of right hind paws. Scale bar, 5 mm. (K) Bone analysis (trabecular bone ratio, bone volume fraction, bone density, and trabecular separation/spacing). ES, electrical stimulation. Data are means ± SD (n = 4). *P < 0.05, **P < 0.01, ***P < 0.001, and ****P < 0.0001.

Similar articles

Cited by

References

    1. Safiri S., Kolahi A. A., Hoy D., Smith E., Bettampadi D., Mansournia M. A., Almasi-Hashiani A., Ashrafi-Asgarabad A., Moradi-Lakeh M., Qorbani M., Collins G., Woolf A. D., March L., Cross M., Global, regional and national burden of rheumatoid arthritis 1990–2017: A systematic analysis of the Global Burden of Disease study 2017. Ann. Rheum. Dis. 78, 1463–1471 (2019). - PubMed
    1. Matteo A. D., Bathon J. M., Emery P., Rheumatoid arthritis. The Lancet 402, 2019–2033 (2023). - PubMed
    1. Smolen J. S., Aletaha D., Barton A., Burmester G. R., Emery P., Firestein G. S., Kavanaugh A., McInnes I. B., Solomon D. H., Strand V., Yamamoto K., Rheumatoid arthritis. Nat. Rev. Dis. Primers 4, 18001 (2018). - PubMed
    1. Nikiphorou E., Santos E. J. F., Marques A., Böhm P., Bijlsma J. W., Daien C. I., Esbensen B. A., Ferreira R. J. O., Fragoulis G. E., Holmes P., McBain H., Metsios G. S., Moe R. H., Stamm T. A., de Thurah A., Zabalan C., Carmona L., Bosworth A., 2021 EULAR recommendations for the implementation of self-management strategies in patients with inflammatory arthritis. Ann. Rheum. Dis. 80, 1278–1285 (2021). - PMC - PubMed
    1. Bodenheimer T., Patient Self-management of Chronic Disease in Primary Care. JAMA 288, 2469 (2002). - PubMed

Publication types