. 2024 May;16(745):eadj4685.
doi: 10.1126/scitranslmed.adj4685. Epub 2024 May 1.

Vaccination with antigenically complex hemagglutinin mixtures confers broad protection from influenza disease

Affiliations

Vaccination with antigenically complex hemagglutinin mixtures confers broad protection from influenza disease

Zhaochen Luo et al. Sci Transl Med. 2024 May.

Abstract

Current seasonal influenza virus vaccines induce responses primarily against immunodominant but highly plastic epitopes in the globular head of the hemagglutinin (HA) glycoprotein. Because of viral antigenic drift at these sites, vaccines need to be updated and readministered annually. To increase the breadth of influenza vaccine-mediated protection, we developed an antigenically complex mixture of recombinant HAs designed to redirect immune responses to more conserved domains of the protein. Vaccine-induced antibodies were disproportionally redistributed to the more conserved stalk of the HA without hindering, and in some cases improving, antibody responses against the head domain. These improved responses led to increased protection against homologous and heterologous viral challenges in both mice and ferrets compared with conventional vaccine approaches. Thus, antigenically complex protein mixtures can at least partially overcome HA head domain antigenic immunodominance and may represent a step toward a more universal influenza vaccine.


Conflict of interest statement

Competing interests: Z.L. and N.H. are coinventors of patent, No. WO/2023/023523, entitled “Next Generation Vaccines Comprising Antigenic Libraries and Methods of Making and Using Same” and co-inventors on an unpublished patent entitled “Compositions and methods for quantifying antigenically complex vaccines”. All other authors declare that they have no competing interests.

Figures

Fig. 1.
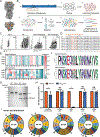
Fig. 1.. Design, generation, and characterization of and antigenically complex HA vaccine.
(A) Shown is a Pymol model of the H1 HA trimer based on the published crystal structure of the HA of A/Puerto Rico/8/1934, PDB number 5VLI (60). Residues that were mutated are indicated in orange. (B) Shown is a diagram of the approach to generate the HA mutant library. Ab, antibody. (C) Shown is the percentage of 6F12 positive cells (out of the lentivirus transduced population) of Sbmut HA library by flow cytometry after MACS. SSC-A, side scatter area. (D) Sequencing results are shown for 8 clones from sorted library. Alignment was generated by Clustal Omega Multiple Sequence Alignment tool. * in (D) indicates a conserved sequence. (E) The heatmap shows the amino acid frequency of each substituted position in the DNA library. (F) Sequence logo plot showing amino acid frequency of each substituted position of DNA library. (G) The glycosylation of Sbmut HA was evaluated by SDS-PAGE after PNGase F treatment. (H) Antigenicity of Sbmut HA was determined by ELISA with monoclonal antibodies targeting different antigenic sites (n=6 biological replicates). Antigenic sites are indicated at the bottom. OD, optical density. Statistical differences for (H) were determined using Mann-Whitney U test (*p<0.05; ns, not significant), and bars indicate mean values. (I) Pie charts show the amino acid distribution of each mutagenized position of the protein library.
Fig. 2.
Fig. 2.. Vaccination with antigenically complex HAs induces increased head and stalk directed antibodies.
(A) Mice received two doses of vaccine, three weeks apart and serum samples were collected 21 days post-prime or 21 days post-boost for analysis. (B to E) Antibody response to PR8 full-length HA (B), PR8 virus (C), PR8 HA head domain (D), and PR8 HA stalk domain (E) are depicted as a titration curve (left) or the calculated area under the curve (AUC, right) based on ELISAs. Arb., arbitrary. (F) Shown are relative ELISA AUC values normalized to the WT HA group against PR8 full-length (FL) HA, PR8 HA head, or PR8 HA stalk. Fold-changes are shown above each pair of bars. (G to I) Antibody avidity to PR8 full-length HA (G), PR8 HA head domain (H) and PR8 HA stalk domain (I) are represented as antibody avidity indices. Conc, concentration. n=10 mice per group. Prime and boost samples were analyzed independently; absorbance curves and AUC values cannot be directly compared across experiments. Bars indicate mean values in the right plots of (B to E) and in (F to I). Dots indicate mean values in the left plots of (B to E), where error bars represent the standard error of the means (SEM). Statistical differences in (B to E) were determined using Kruskal-Wallis test followed by a Wilcoxon rank-sum test with Bonferroni correction; statistical differences in panel G-I were determined using Mann-Whitney U test.
Fig. 3.
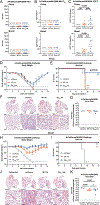
Fig. 3.. Antigenically complex HA vaccination provides improved, and at least partially antibody-mediated, protection from homologous challenge.
(A to C) Mice received two doses of vaccine three weeks apart, and serum samples were collected 21 days post-prime or 21 days post-boost for HAI (n=10 per group) (A), microneutralization (n=10 per group) (B) and ADCC (n=8 for prime, n=6 for boost) (C) assays as measured against PR8 virus. ND, not detected. LOD, limit of detection. (D and E) Mice were intranasally infected with 12,500 PFU of PR8 virus three weeks after prime vaccination; body weight (D) and survival (E) were monitored and recorded for 14 days post infection (n=9 per group). (F and G) Mice were primed and then infected with 12,500 PFU of PR8 virus as in (D and E); lungs were collected at 5 days post infection for H&E staining (representative lung lobes from each group are shown, n=3 per group; scale bar in upper row, 5 mm; scale bar in lower row, 500 μm) (F) or at 4 days post infection for virus detection (n=5) (G). (H and I) Mice were intranasally infected with 160,000 PFU of PR8 virus three weeks after boost vaccination, and body weight (H) and survival (I) were monitored and recorded for 14 days post infection (n=10 per group). (J and K) Mice received 200 μL of neat serum transfer from vaccine-primed mice, then were challenged with 500 PFU of PR8 virus 24 hours later; body weight (J) and survival (K) were monitored and recorded until 14 days post infection. Data in (J) and (K) are aggregated from two independent experiments (n=9 in Sbmut HA group, n=10 in both mCherry and WT HA group). Dotted lines in (D), (H), and (J) indicate 75% of starting weight. Fractions in (E), (I), and (K) represent the number of surviving animals of total animals per group. Horizontal bars indicate mean values in (A), (B), (C), and (G). Dots represent mean values in (D), (H), and (J), where error bars represent the SEM. Statistical differences in (A to C) and (G) were determined using Kruskal-Wallis test followed by a Wilcoxon rank-sum test with Bonferroni correction, statistical differences in (E), (I), and (K) were analyzed by log rank (Mantel-Cox) test.
Fig. 4.
Fig. 4.. Antigenically complex vaccine induced responses against heterologous group 1 HA IAV strains.
Mice received two doses of vaccine, three weeks apart. Serum samples were collected three weeks after prime and three weeks after boost for analysis. (A) Luminex H1 HA binding assay results are shown as MFI values for HAs derived from the indicated strains (n=5 mice per group). (B) Luminex H3 HA binding assay results are shown as MFI values for HAs derived from the indicated strains (n=5 mice per group). (C to G) ELISA results are shown for serum collected after prime (top) or boost (bottom) vaccination with the indicated HA vaccine. AUC values are shown on the right. Shown are responses to A/WSN/1993 HA (C), A/USSR/92/1977 HA (D), A/Bayern/07/1995 HA (E), A/Solomon Island/03/2006 HA (F), and A/California/04/2009 (Cal/09) HA (G) (n=10 mice per group). Prime and boost samples were analyzed independently; absorbance curves and AUC values cannot be directly compared across experiments. Bars indicate mean values in the right plots of (C to G). Dots indicate mean values in the left plots of (C to G), where error bars represent the SEM. Statistical differences were determined using Kruskal-Wallis test followed by a Wilcoxon rank-sum test with Bonferroni correction. (H) ELISA AUC values are shown for prime and boost serum against H2 A/Japan/305/1957, H5 A/Vietnam/1203/2004, H6 A/Taiwan/2/2013, or H9 A/Hong Kong/33982/2009 HA; mean AUC values are shown (n=10 mice per group).
Fig. 5.
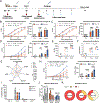
Fig. 5.. Antigenically complex hemagglutinin vaccination provides better protection against Cal/09 challenge.
(A to C) Mice received two doses of vaccine, three weeks apart and serum samples were collected 21 days post-prime or 21 days post-boost for HAI (n=10 per group) (A), microneutralization (n=10 per group for prime, n=6 in mCherry group and 7 in WT HA and Sbmut HA group for boost) (B) and ADCC (n=10 per group) (C) assays as measured against Cal/09 virus. ND, not detected. LOD, limit of detection. (D and E) Mice were intranasally infected with 24,000 PFU of Cal/09 virus three weeks after prime vaccination, and body weight (D) and survival (E) were monitored and recorded for 14 days post infection (n=5 per group). (F and G) Mice were primed as in (D and E) and then infected with 24,000 PFU of Cal/09 virus; lungs were collected at 7 days post infection for lung H&E staining (representative lung lobes from each group are shown, n=3 per group; scale bar in upper row, 5 mm; scale bar in lower row, 500 μm) (F) or at 5 days post infection for virus detection (n=5 per group) (G). (H and I) Mice were intranasally infected with 24,000 PFU of Cal/09 virus three weeks after boost vaccination, and body weight (H) and survival (I) were monitored and recorded for 14 days post infection (n=7 per group). (J and K) Mice were intranasally infected with 24,000 PFU of Cal/09 virus three weeks after boost vaccination as in (H and I); lungs were collected at day 7 for H&E staining (representative lung lobes from each group are shown, n=3 per group; scale bar in upper row, 5 mm; scale bar in lower row, 200 μm) (J) or for virus detection (n=5 per group) (K). Horizontal bars indicate mean values in (A), (B), (C), (G), and (K). Dots represent mean values in (D) and (H), where error bars represent the SEM. Dotted lines in (D) and (H) indicate 75% of starting weight. Fractions in (E) and (I) represent the number of surviving animals of total animals per group. Statistical differences in (A to C), (G), and (K) were determined using Kruskal-Wallis test followed by a Wilcoxon rank-sum test with Bonferroni correction, statistical differences in (E) and (I) were analyzed by log rank (Mantel-Cox) test.
Fig. 6.
Fig. 6.. Antigenically complex hemagglutinin vaccination reduces illness during Cal/09 challenge in ferrets.
(A) Ferrets received two doses of the indicated vaccine, then animals were challenged with Cal/09 virus. Serum samples and nasal wash were collected at indicated time points for analysis. (B to D) Shown are ELISA results serum antibody response against PR8 full-length HA (B), PR8 HA head domain (C) and PR8 HA stalk domain (D). (E and F) Shown are analyses of serum HAI (E) and neutralization (F) activities against PR8 virus. (G) Results of a luminex binding assay show serum responses to the indicated H1 HAs reported as MFI values. USSR/77 indicates A/USSR/90/1977, TX/91 indicates A/Texas/36/1991, Bayern/95 indicates A/Bayern/07/1995, Bris/07 indicates A/Brisbane/59/2007, and MI/15 indicates A/Michigan/45/2015. (H) Serum antibody responses against Cal/09 full-length HA were analyzed by ELISA. (I) Viral load was measured in nasal wash collected at the indicated time points before and after challenge. Values were normalized to 18s rRNA values. (J) Maximum body temperature of individual ferrets are shown. Bars represent individual animals. Averages are shown above each group. (K) Respiratory scores are shown at day 2 post infection; 0 means no symptoms, 1 means nasal rattling or sneezing, and 2 means nasal discharge on external nares. n=4 ferrets per group. Bars indicate mean values in the right plots of (B), (C), (D), and (H) and in (I). Horizontal bars indicate mean values in (E) and (F). Dots represent mean values in the left plots of (B), (C), (D), and (H), where error bars represent the SEM. Statistical differences were determined using Mann-Whitney U test.

References

    1. World Health Organization, Influenza (Seasonal) (World Health Organization 2023); https://www.who.int/news-room/fact-sheets/detail/influenza-(seasonal).
    1. Hobson D, Curry RL, Beare AS, Ward-Gardner A, The role of serum haemagglutination-inhibiting antibody in protection against challenge infection with influenza A2 and B viruses. J Hyg (Lond) 70, 767–777 (1972); published online EpubDec ( 10.1017/s0022172400022610). - DOI - PMC - PubMed
    1. Black S, Nicolay U, Vesikari T, Knuf M, Del Giudice G, Della Cioppa G, Tsai T, Clemens R, Rappuoli R, Hemagglutination inhibition antibody titers as a correlate of protection for inactivated influenza vaccines in children. Pediatr Infect Dis J 30, 1081–1085 (2011); published online EpubDec ( 10.1097/INF.0b013e3182367662). - DOI - PubMed
    1. Estrada LD, Schultz-Cherry S, Development of a Universal Influenza Vaccine. J Immunol 202, 392–398 (2019); published online EpubJan 15 ( 10.4049/jimmunol.1801054). - DOI - PMC - PubMed
    1. Nachbagauer R, Palese P, Is a Universal Influenza Virus Vaccine Possible? Annu Rev Med 71, 315–327 (2020); published online EpubJan 27 ( 10.1146/annurev-med-120617-041310). - DOI - PubMed

Publication types