. 2025 Feb;14(5):e2400237.
doi: 10.1002/adhm.202400237. Epub 2024 May 9.

Allergen-Encapsulating Nanoparticles Reprogram Pathogenic Allergen-Specific Th2 Cells to Suppress Food Allergy

Affiliations

Allergen-Encapsulating Nanoparticles Reprogram Pathogenic Allergen-Specific Th2 Cells to Suppress Food Allergy

Michael N Saunders et al. Adv Healthc Mater. 2025 Feb.

Abstract

Food allergy is a prevalent, potentially deadly disease caused by inadvertent sensitization to benign food antigens. Pathogenic Th2 cells are a major driver for disease, and allergen-specific immunotherapies (AIT) aim to increase the allergen threshold required to elicit severe allergic symptoms. However, the majority of AIT approaches require lengthy treatments and convey transient disease suppression, likely due to insufficient targeting of pathogenic Th2 responses. Here, the ability of allergen-encapsulating nanoparticles to directly suppress pathogenic Th2 responses and reactivity is investigated in a mouse model of food allergy. NPs associate with pro-tolerogenic antigen presenting cells, provoking accumulation of antigen-specific, functionally suppressive regulatory T cells in the small intestine lamina propria. Two intravenous doses of allergen encapsulated in poly(lactide-co-glycolide) nanoparticles (NPs) significantly reduces oral food challenge (OFC)-induced anaphylaxis. Importantly, NP treatment alters the fates of pathogenic allergen-specific Th2 cells, reprogramming these cells toward CD25+FoxP3+ regulatory and CD73+FR4+ anergic phenotypes. NP-mediated reductions in the frequency of effector cells in the gut and mast cell degranulation following OFC are also demonstrated. These studies reveal mechanisms by which an allergen-encapsulating NP therapy and, more broadly, allergen-specific immunotherapies, can rapidly attenuate allergic responses by targeting pathogenic Th2 cells.

Keywords: allergen‐specific Th2 cells; allergen‐specific immunotherapy mechanisms; biomaterials; polymeric nanoparticles; regulatory T cells.


Conflict of interest statement

L.D.S. and S.D.M. are consultants for Cour Pharmaceutical Development Company, Inc., and have financial interests in the nanoparticle technology described in this manuscript. J.J.P. is employed by Cour Pharmaceutical Development Company, Inc. All other authors declare they have no conflict of interest. The nanoparticle technology used here is reflective of that described in patent US‐20150190485.

Figures

Figure 1
Figure 1
A) Intravenous delivery of nanoparticles containing encapsulated allergen to food allergic mice reduces severity of subsequent oral food challenge‐induced anaphylaxis. Ovalbumin (OVA)‐allergic mice were generated by sensitizing BALB/cJ mice with two i.p. injections of OVA and aluminum hydroxide (alum) and challenging them seven times over 2 weeks with intragastric OVA. Mice were treated with two i.v. injections of OVA‐encapsulating poly(lactide‐co‐glycolide) nanoparticles (OVA NPs), an equivalent dose of i.v. OVA (100 µg) dissolved in phosphate‐buffered saline (PBS), or i.v. PBS. B) Mortality rates due to treatment were 0% among sensitized i.v. PBS (0/37 mice) and i.v. OVA NP (0/52 mice) recipients versus 13.3% (2/15 mice) for sensitized i.v. OVA recipients. C) Upon tissue harvest at day 60, PBS‐treated mice had reddened, edematous small intestines consistent with enteritis compared to healthy‐looking tissues observed in OVA NP‐treated mice. Mice receiving i.v. OVA NPs, as well as mice surviving i.v. OVA treatment, displayed D) reduced oral food challenge (OFC)‐induced clinical anaphylaxis scores, E) temperature drops, and F) diarrhea incidence compared to i.v. PBS‐treated controls (n = 13 for i.v. PBS group, n = 18 for i.v. OVA NP group, and n = 5 for i.v. OVA group). Error bars indicate mean ± SEM; statistical significance was determined using the Kruskal–Wallis Test with Dunn's multiple comparisons. **p <0.01 and ***p <0.001.
Figure 2
Figure 2
A) Intravenously‐delivered OVA NPs associate with and increase the frequency of pro‐tolerogenic dendritic cells. BALB/cJ mice were sensitized with i.p. OVA and alum or given an equivalent dose of i.p. PBS at days 0 and 7. B) All mice received treatment with i.v. Cy5.5‐conjugated OVA NPs, and splenocytes were isolated and analyzed via flow cytometry on days 15 and 22 to identify NP‐associated cells. A sensitization‐specific increase in expression of the marker CD103 was found among splenic CD11c+F4/80 dendritic cells (DCs) associating with Cy5.5‐tagged OVA NPs compared to total DCs (n = 5). After receiving one or two doses of Cy5.5‐tagged OVA NPs, OVA‐sensitized mice had C,D) greater frequencies and counts of NP+ CD103+ DCs (n = 4–6) and E,F) total CD103+ DCs (n = 4–6) compared to naïve mice. However, no differences were observed in NP+ DC frequency between these two sensitization conditions (data not shown). G,H) In mice sensitized and treated using the timeline in Figure 1A, OVA NP treatment ultimately resulted in an increased splenic CD103+ DC frequency and count compared to PBS‐treated controls when cells were evaluated at days 31 and 44, or 3 and 2 days after i.v. therapy, respectively (n = 5). Error bars indicate mean ± SEM; statistically significant differences at each timepoint were identified using the Mann–Whitney Test; ns = no significance, *p <0.05 and **p <0.01.
Figure 3
Figure 3
A,B) OVA NP treatment increased suppressive OVA‐specific Tregs in the small intestine lamina propria. I.V. OVA NP treatment resulted in an increase in the frequency and count of CD4+CD25+FoxP3+ regulatory T cells (Tregs) in the small intestine lamina propria (SILP) relative to i.v. PBS‐treated mice following the final OFC at day 60 (n = 5–8). C) CD4+CD25+ T cells derived from SILP of i.v. OVA NP‐treated mice and stimulated with OVA323‐339 peptide‐presenting splenocytes produced high levels of the regulatory cytokine IL‐10 (n = 3–5), D) but not of TGF‐β (n = 4,5), as measured by ELISA. E,F) CD4+ Tregs from i.v. OVA NP treated mice more frequently expressed the gut‐homing markers α4β7 (n = 5–8) and G,H) CCR9, relative to PBS‐treated controls (n = 5–8). I,J) Flow cytometry also demonstrated a trend toward higher CD8+CD25+FoxP3+ suppressor T cell frequencies and a significantly higher count of these cells in the SILP of i.v. OVA NP‐treated mice compared to i.v. PBS‐treated mice at day 60 (n = 4). Error bars indicate mean ± SEM; statistical significance was determined using the Kruskal–Wallis Test with Dunn's Multiple Comparisons or the Mann‐Whitney Test; *p <0.05.
Figure 4
Figure 4
A) Allergen‐encapsulated nanoparticles reprogram pathogenic Th2‐primed cells toward regulatory and anergic fates. DO11.10 mice were sensitized with OVA and alum at days 0 and 14, followed by isolation of CD4+ T cells at day 21 via magnetic activated cell sorting. These OVA‐specific, Th2‐primed T cells were adoptively transferred into naïve BALB/cJ mice, after which the mice were treated with i.v. PBS, i.v. OVA NPs, or i.v. OVA at days 28 and 42. Spleens were harvested 1 week after each treatment (days 35 and 49) and DO11.10 cells were analyzed via flow cytometry. B) Following a single treatment, splenic DO11.10 cells from OVA NP recipients were enriched with CD25 and FoxP3 expression, with or without IL‐10 expression, compared to PBS‐treated controls, with the former displaying increased co‐expression with the activation marker CD44 (n = 5). Expression of the anergy markers CD73 and FR4 was also upregulated, alongside expression of tolerogenic markers PD‐1 and CTLA‐4. However, the T cell exhaustion marker Lag3 was not expressed to a greater degree in OVA NP‐treated mice compared to controls. C) Following a second i.v. treatment, activated FoxP3+CD44hi Tregs, CD73+FR4+ anergic T cells, and PD‐1 and CTLA‐4 expression were upregulated among the splenic DO11.10 T cells of OVA NP recipients (n = 5). Data from Figure 4B,C are shown in Table S2, Supporting Information. Similar trends were observed based on cell count at both timepoints (Figure S6C,D, Supporting Information). Statistically significant differences were calculated for each cell type using the Kruskal–Wallis Test with Dunn's Multiple Comparisons, and differences between i.v. PBS and i.v. OVA NP treatment conditions were noted with asterisks; while, differences involving i.v. OVA‐treated mice were not denoted. *p <0.05 and **p <0.01.
Figure 5
Figure 5
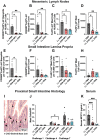
OVA NP treatment reduces mast cell and basophil frequency, count, and activity in the gut. Mice treated with i.v. PBS, i.v. OVA NPs, or i.v. OVA were sacrificed at day 60, at which point the mesenteric lymph nodes and SILP were harvested and processed for flow cytometry. A,B) CD200R+FcεRI+c‐kit basophils (n = 5–9) and C,D) FcεRI+c‐kit+ mast cells were both reduced in frequency and count among i.v. OVA NP‐ and i.v. OVA‐treated recipients (n = 5–9). Mast cell frequency and count similarly trended downward. (n = 4–9) (D). E,F) In the SILP, i.v. OVA NPs significantly reduced basophils frequency (n = 4–9); while, G,H) inducing a non‐significant downward shift in basophil count. I) Chloroacetate esterase (CAE) staining of mast cells (scale bar is 20 µm; arrowheads indicate mast cells) was performed on proximal intestinal tissues harvested at challenges 1, 4, and 7, revealing a trend toward reduced mast cell frequencies per high powered field (HPF) in i.v. OVA NP‐treated mice compared to J) i.v. PBS‐treated controls (n = 4). Representative images for each condition are shown in Figure S7, Supporting Information. K) Serum levels of mucosal mast cell protease 1 (MCPT‐1), indicative of mast cell degranulation levels, were reduced in i.v. OVA NP and i.v. OVA recipients compared to PBS‐treated mice at day 59 following challenge (n = 13 for i.v. PBS group, n = 17 for i.v. OVA NP group, and n = 5 for i.v. OVA group). Error bars indicate mean ± SEM; statistical significance was determined using the Kruskal–Wallis Test with Dunn's Multiple Comparisons; *p <0.05, **p <0.01, and ***p <0.001.

References

    1. Gupta R. S., Warren C. M., Smith B. M., Jiang J., Blumenstock J. A., Davis M. M., Schleimer R. P., Nadeau K. C., JAMA Netw. Open 2019, 2, e185630. - PMC - PubMed
    1. Gupta R. S., Springston E. E., Warrier M. R., Smith B., Kumar R., Pongracic J., Holl J. L., Pediatrics. 2011, 128, e9. - PubMed
    1. Schoos A.‐M. M., Bullens D., Chawes B. L., Costa J., De Vlieger L., DunnGalvin A., Epstein M. M., Garssen J., Hilger C., Knipping K., Kuehn A., Mijakoski D., Nekliudov D. MunbN., Ozdemir C., Patient K., Peroni D., Stoleski S., Stylianou E., Tukalj M., Verhoeckx K., Zidarn M., van de Veen W., Front. Immunol. 2020, 11, 568598. - PMC - PubMed
    1. PALISADE , N. Engl. J. Med. 2018, 379, 1991. - PubMed
    1. Akdis C. A., Akdis M., World Allergy Organ J. 2015, 8, 17. - PMC - PubMed

Substances