. 2024 May 21;5(5):101519.
doi: 10.1016/j.xcrm.2024.101519. Epub 2024 Apr 30.

Tumor mitochondrial oxidative phosphorylation stimulated by the nuclear receptor RORγ represents an effective therapeutic opportunity in osteosarcoma

Affiliations

Tumor mitochondrial oxidative phosphorylation stimulated by the nuclear receptor RORγ represents an effective therapeutic opportunity in osteosarcoma

Jianwei Zheng et al. Cell Rep Med. .

Abstract

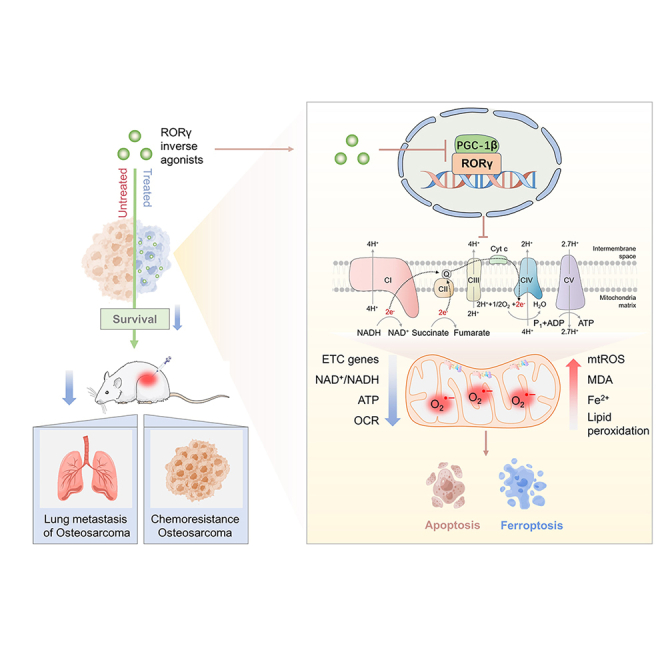
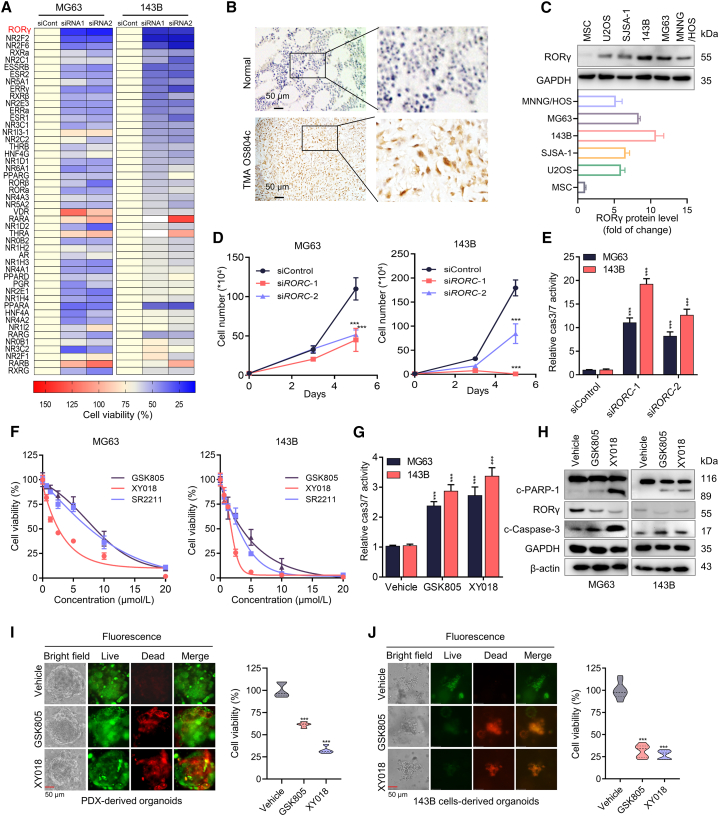
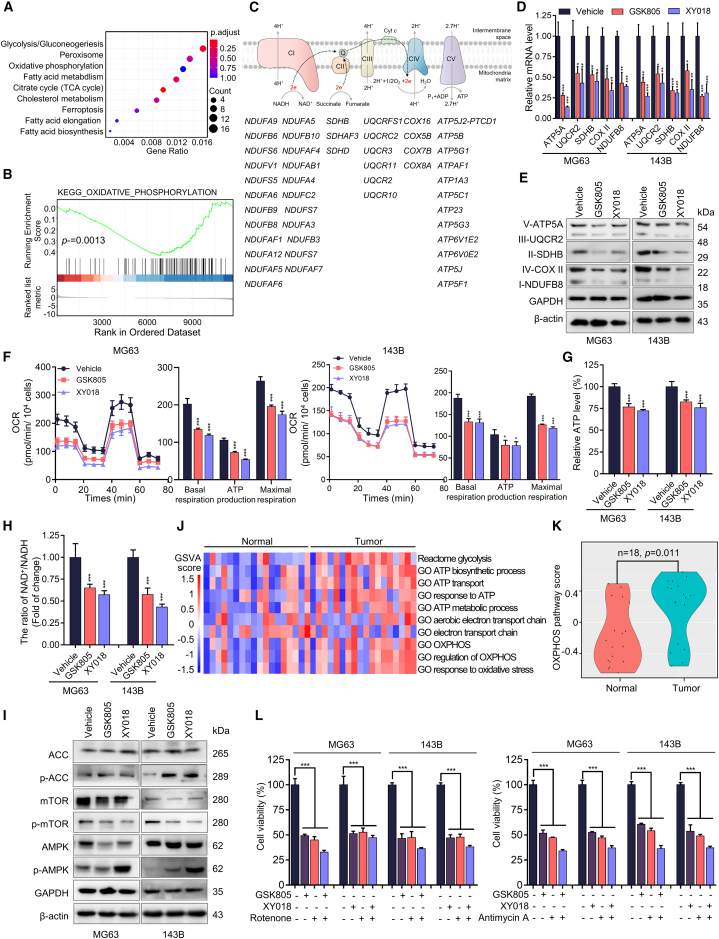
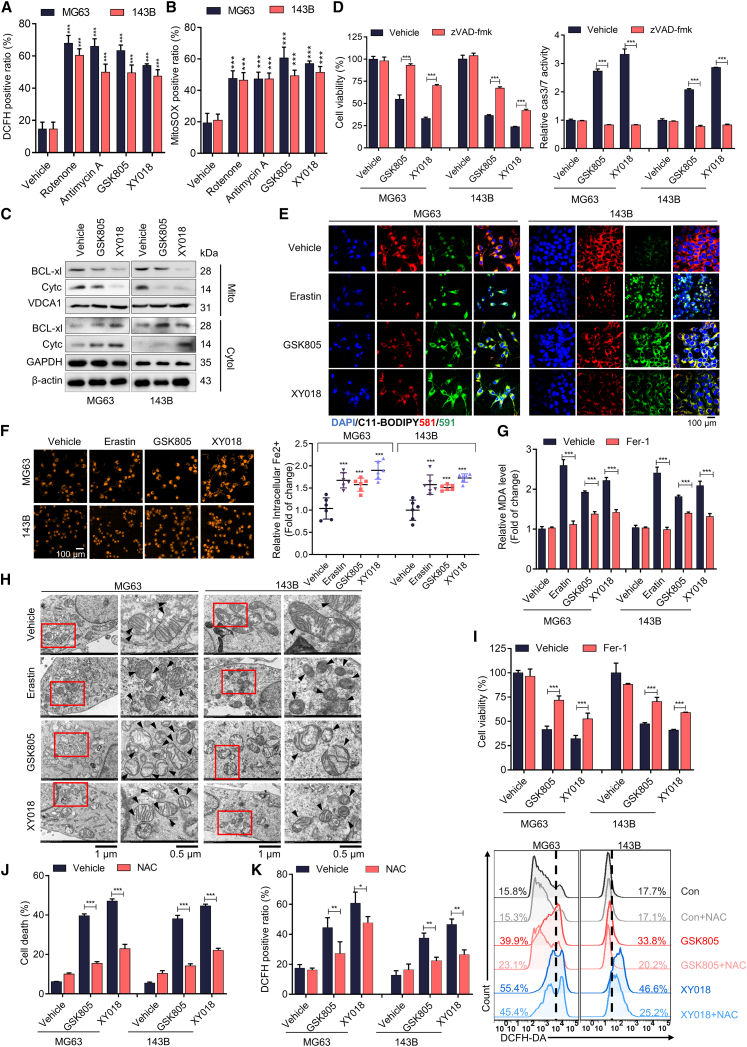
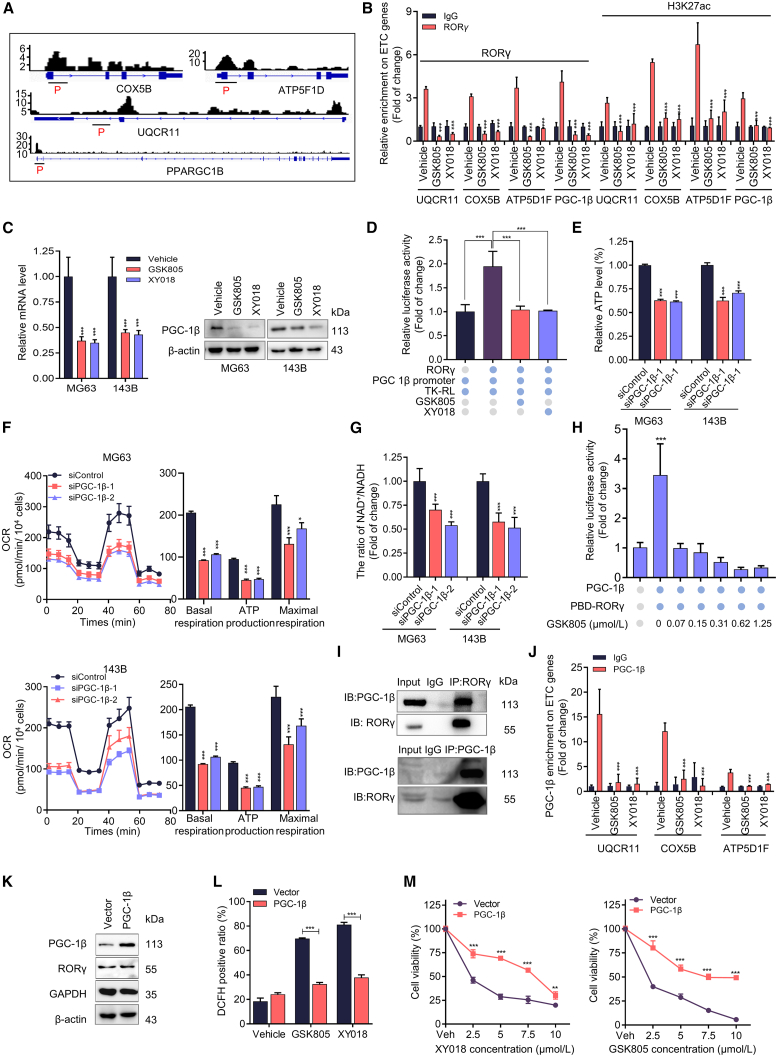
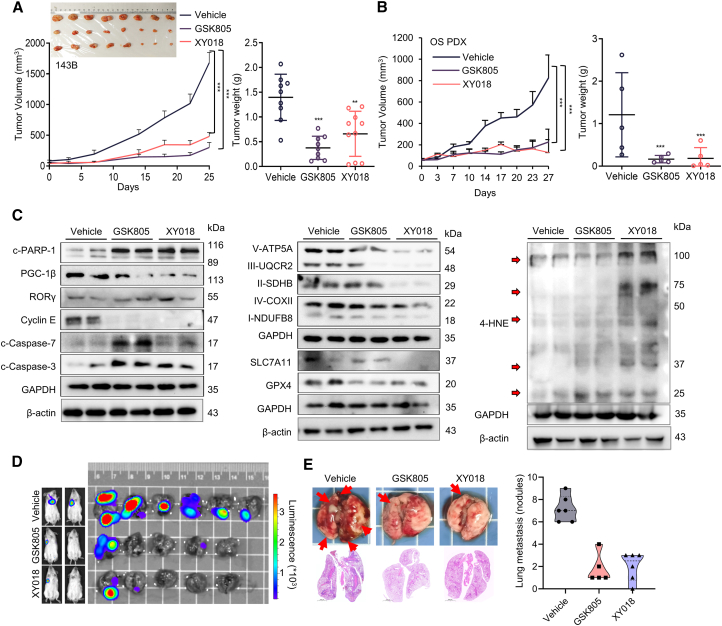
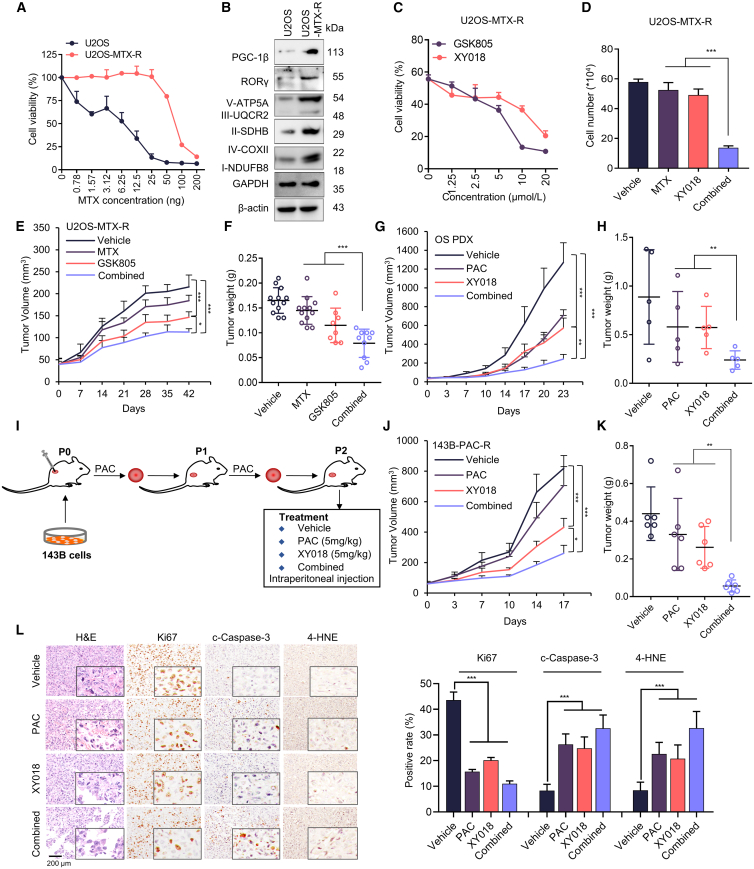
Osteosarcoma (OS) is the most common malignant bone tumor with a poor prognosis. Here, we show that the nuclear receptor RORγ may serve as a potential therapeutic target in OS. OS exhibits a hyperactivated oxidative phosphorylation (OXPHOS) program, which fuels the carbon source to promote tumor progression. We found that RORγ is overexpressed in OS tumors and is linked to hyperactivated OXPHOS. RORγ induces the expression of PGC-1β and physically interacts with it to activate the OXPHOS program by upregulating the expression of respiratory chain component genes. Inhibition of RORγ strongly inhibits OXPHOS activation, downregulates mitochondrial functions, and increases ROS production, which results in OS cell apoptosis and ferroptosis. RORγ inverse agonists strongly suppressed OS tumor growth and progression and sensitized OS tumors to chemotherapy. Taken together, our results indicate that RORγ is a critical regulator of the OXPHOS program in OS and provides an effective therapeutic strategy for this deadly disease.


Conflict of interest statement

Declaration of interests The authors declare no competing interests.

Figures

None
Graphical abstract
Figure 1
Figure 1
RORγ is overexpressed in OS and is required for the OS tumor growth (A) Heatmap displaying the fold change in viability in cells transfected with specific NR siRNA compared with those transfected with control siRNA. Cells were transfected with siRNA against specific NR or control siRNA and, after 5 days, viable cells were counted. The data have been changed from 175% (red) to 0% (blue). n = 3 biological replicates. (B) Representative immunohistochemical staining images of RORγ for a cohort of OS specimens in TMA OS802c and OS804c, n = 117 (Biomax). TMA LN020Bn01, n = 10 (ZhongKe GuangHua, China). Scale bars, 50 μm. (C) Western blotting analysis of the RORγ protein in human mesenchymal stem cells (hMSCs) and OS cell lines. Representative blots are shown. n = 3 biological replicates. (D) MG63 and 143B cells were transfected with siRNA against RORC (siRORC-1 and siRORC-2) or control siRNA (siCont). Cell numbers were counted 3 and 5 days after transfection. n = 3 biological replicates. (E) Caspase-3/7 (cas3/7) activities in MG63 and 143B cells were transfected with siRNA against RORC for 3 days n = 3 biological replicates. (F) MG63 and 143B cell viability was measured with Cell-Titer GLO (Promega) with cells treated with the indicated concentrations of RORγ inverse agonists GSK805, XY018, and SR2211 for 4 days n = 3 biological replicates. (G) MG63 and 143B cells were treated with vehicle or the indicated RORγ inverse agonist for 2 days before being collected for apoptosis analysis by measuring caspase-3/7 (cas3/7) activity. n = 3 biological replicates. (H) Western blotting analysis of the indicated proteins in MG63 and 143B cells treated with vehicle or the indicated RORγ inverse agonists for 2 days. Representative blots are shown. n = 3 biological replicates. (I and J) Organoids derived from PDX (I) and 143B cell xenografts (J) were treated with vehicle, GSK805 (5 μM) or XY018 (5 μM) for 4 days. Representative bright-field (left row) and fluorescence microscopy (right three rows) images are shown, and cell viability in organoids was measured using the CellTiter-Glo Luminescent Cell Viability Assay. Scale bars, 50 μm. n = 5 biological replicates. All data shown above are the mean ± SD. ∗p < 0.05, ∗∗p < 0.01, ∗∗∗p < 0.001.
Figure 2
Figure 2
RORγ inhibition inhibits OS cells survival by suppressing OXPHOS (A) KEGG pathway analysis of related genes with downregulated expression, which was detected by RNA-seq of 143B cells treated with XY018 (5 μM) for 2 days, compared with vehicle (DMSO). (B) Gene set enrichment analysis of the OXPHOS activity signature gene expression changes, as detected by RNA-seq in 143B cells treated with XY018 (5 μM) for 2 days, compared with vehicle (DMSO). (C) Downregulated genes detected by RNA-seq in 143B cells treated with XY018 (5 μM) for 2 days compared with vehicle (DMSO). (D) qRT-PCR analysis of the indicated genes in MG63 and 143B cells treated with vehicle or with RORγ inverse agonists (5 μM) for 2 days. n = 3 biological replicates. (E) Western blotting analysis of the indicated proteins in MG63 and 143B cells treated with vehicle or the indicated RORγ inverse agonists (5 μM) for 2 days. Representative blots are shown. n = 3 biological replicates. (F) OCR measured by a Seahorse analyzer with MG63 and 143B cells treated with RORγ inverse agonists (5 μM) for 2 days. n = 3 biological replicates. (G) ATP production assessed by Cell-Titer GLO (Promega) in MG63 and 143B cells treated with RORγ inverse agonists (5 μM) for 2 days. The ATP level was normalized to the cell number. n = 3 biological replicates. (H) The ratio of NAD+/NADH in MG63 and 143B cells treated with RORγ inverse agonists (5 μM) for 2 days was assessed by an NAD+/NADH Assay Kit. n = 3 biological replicates. (I) Immunoblotting analysis of the indicated proteins in MG63 and 143B cells treated with vehicle or the indicated RORγ inverse agonists (5 μM) for 2 days. Representative blots are shown. n = 3 biological replicates. (J) Heatmap of activity scores of gene expression of indicated pathways with data normalized from 1.5 (red) to −1.5 (blue) in 18 tumoral bone samples and 18 nontumoral paired samples. The datasets for gene expression were obtained from the GEO database (GEO: GSE99671). (K) Violin plots showing the relative OXPHOS pathway activity in 18 tumoral bone samples and 18 nontumoral paired samples from the GEO database (GEO: GSE99671). (L) MG63 and 143B cells treated with vehicle, RORγ inverse agonists (5 μM) and OXPHOS inhibitors (50 nM) for 2 days. Total viable cells were counted with a Coulter cell counter. n = 3 biological replicates. All data shown above are the mean ± SD. ∗p < 0.05, ∗∗p < 0.01, ∗∗∗p < 0.001.
Figure 3
Figure 3
RORγ inhibition induces apoptosis and ferroptosis by promoting oxidative stress in OS cells (A) ROS generation in MG63 and 143B cells treated with RORγ inverse agonists (5 μM) and OXPHOS inhibitors (50 nM) for 2 days was evaluated by flow cytometry using DCFH-DA. n = 3 biological replicates. (B) Mitochondrial ROS generation in MG63 and 143B cells treated with RORγ inverse agonists (5 μM) and OXPHOS inhibitors (50 nM) for 2 days was evaluated by flow cytometry using MitoSOX. n = 3 biological replicates. (C) Immunoblotting analysis of the indicated proteins in MG63 and 143B cells treated with vehicle or the indicated RORγ inverse agonists (5 μM) for 2 days. Representative blots are shown. n = 3 biological replicates. (D) Cell viability and caspase-3/7 (cas3/7) activities of MG63 and 143B cells treated with RORγ inverse agonists (5 μM) and Pan caspase inhibitor (10 μM zVAD-fmk) for 2 days. Pan caspase inhibitor was pretreated for 3 h. n = 3 biological replicates. (E) Lipid ROS generation in MG63 and 143B cells treated with RORγ inverse agonists (5 μM) and the ferroptosis inducer erastin (5 μM) for 2 days was assessed by immunofluorescence using C11-BODIPY. Scale bar, 100 μm. n = 3 biological replicates. (F) The accumulation of Fe2+ in MG63 and 143B cells treated with RORγ inverse agonists (5 μM) and the ferroptosis inducer erastin (5 μM) for 2 days was assessed by immunofluorescence using FerroOrange. Scale bar, 100 μm. n = 3 biological replicates. (G) Cellular malondialdehyde (MDA) production in MG63 and 143B cells treated with RORγ inverse agonists (5 μM) and the ferroptosis inducer erastin (5 μM) for 2 days was assessed by using a Lipid Peroxidation MDA Assay Kit. Cells were pretreated with the ferroptosis inhibitor Fer-1 (10 μM) for 3 h. n = 3 biological replicates. (H) Morphological analysis by transmission electron microscopy in MG63 and 143B cells treated with vehicle or the indicated RORγ inverse agonist (5 μM) and ferroptosis inducer erastin (5 μM) for 2 days. The morphological features of ferroptosis are indicated (black arrows). Scale bars, 1 μm (left column) and 0.5 μm (right column). n = 5 technical replicates. (I) MG63 and 143B cells were treated with RORγ inverse agonists (5 μM) and the ferroptosis inhibitor Fer-1 (10 μM) for 2 days, and total viable cells were counted with a Coulter cell counter. Fer-1 cells were pretreated for 3 h. n = 3 biological replicates. (J) MG63 and 143B cells were treated with vehicle or the indicated RORγ inverse agonists (5 μM) for 2 days, and Hoechst staining was used to observe chromatin condensation. n = 3 biological replicates. (K) ROS generation in MG63 and 143B cells treated with RORγ inverse agonists (5 μM) and the ROS inhibitor N-acetylcysteine (NAC) (6 mM) for 2 days was assessed by flow cytometry using DCFH-DA. The cells were pretreated with NAC for 3 h. n = 3 biological replicates. All data shown above were the mean ± SD. ∗p < 0.05, ∗∗p < 0.01, ∗∗∗p < 0.001.
Figure 4
Figure 4
PGC-1β coordinates with RORγ to control OXPHOS, OS survival, and mitochondrial function (A) Genome browser display of RORγ-binding events at the promoter and gene body of PGC-1β and ETC genes (UQCR11, COX5B, and ATP5F1D). ChIP primer-pair locations are indicated by horizontal short lines. The red P represents the binding peak. Data from our previous ChIP-seq data (GEO: GSE126380). (B) ChIP-qPCR analysis of the relative enrichment of RORγ and H3K27 acetylation at ETC gene promoters (UQCR11, COX5B, and ATP5F1D) in 143B cells treated with vehicle or RORγ inverse agonists (5 μM) for 2 days. Fold changes were calculated with IgG enrichment in cells treated with vehicle control set as 1. n = 3 biological replicates. (C) qRT-PCR (left) and immunoblotting (right) analysis of PGC-1β gene and protein in MG63 and 143B cells treated with vehicle or with RORγ inverse agonists (5 μM) for 2 days n = 3 biological replicates. (D) PGC-1β promoter-driven reporter assay in 293T cells transfected with the indicated plasmid constructs. n = 3 biological replicates. (E) ATP production assessed by Cell-Titer GLO (Promega) in MG63 and 143B cells treated with RORγ inverse agonists (5 μM) for 2 days n = 3 biological replicates. (F) OCR measured by a Seahorse analyzer in MG63 and 143B cells transfected with siRNA against PGC-1β for 2 days n = 3 biological replicates. (G) The ratio of NAD+/NADH in MG63 and 143B cells transfected with siRNA against PGC-1β for 2 days was assessed using an NAD+/NADH Assay Kit. n = 3 biological replicates. (H) PGC-1β stimulated RORγ activation, and the effects of RORγ inverse agonists were measured by reporter gene assay. n = 3 biological replicates. (I) The interactions of RORγ with PGC-1β were detected in HEK293T cells overexpressing RORγ and PGC-1β by coIP assay. n = 3 biological replicates. (J) ChIP-qPCR analysis of the relative enrichment of PGC-1β at the promoters of ETC genes (UQCR11, COX5B, and ATP5F1D) in 143B cells treated with vehicle or RORγ inverse agonists (5 μM) for 2 days. n = 3 biological replicates. (K) Immunoblotting analysis of the indicated proteins in MG63 cells overexpressing PGC-1β. n = 3 biological replicates. (L) ROS generation in MG63 cells with or without overexpression of PGC-1β and treated with RORγ inverse agonists (5 μM) for 2 days was evaluated by flow cytometry using DCFH-DA. n = 3 biological replicates. (M) MG63 cells with or without overexpression of PGC-1β were treated with vehicle or the indicated concentrations of RORγ inverse agonists for 2 days. Cells were harvested to determine cell growth by counting viable cells. n = 3 biological replicates. All data shown above are the mean ± SD. ∗p < 0.05, ∗∗p < 0.01, ∗∗∗p < 0.001.
Figure 5
Figure 5
RORγ inverse agonists potently inhibit OS tumor growth (A) Nude mice bearing 143B xenografts received RORγ inverse agonists (intraperitoneally [i.p.], 5 mg/kg, n = 6) or vehicle (n = 6) five times per week. Mean tumor volume ± SEM, mean tumor weight ± SEM, and representative tumor image are shown. (B) NOD/SCID mice bearing OS patient-derived xenografts (PDXs) received RORγ inverse agonists (i.p., 5 mg/kg, n = 6) or vehicle (n = 6) five times per week. Mean tumor volume ± SEM and mean tumor weight ± SEM. (C) Immunoblotting analysis of the indicated proteins in 143B xenograft tumors after 27 days of treatment with vehicle or RORγ inverse agonists as in (A). (D and E) Effects of RORγ inverse agonists on OS metastasis. 143B-Luci cells were intravenously injected into the tail vein of 5-week-old male NOD/SCID mice. Mice (n = 6) were then treated as in (A). (D) Tumor growth was monitored by bioluminescent imaging, and representative images of tumor sites in the lung are shown. (E) Lung sections were stained with H&E, and the tumor nodules were counted and analyzed. Scale bars, 2000 μm. Data shown are the mean ± SEM. ∗p < 0.05, ∗∗p < 0.01, ∗∗∗p < 0.001.
Figure 6
Figure 6
RORγ inverse agonists overcome resistance to chemotherapy in OS (A) The viability of parental U2OS and methotrexate-resistant U2OS cells treated with the indicated concentrations of methotrexate (MTX) for 4 days was measured by Cell-Titer GLO. n = 3 biological replicates. (B) Immunoblotting analysis of the indicated proteins in U2OS and methotrexate-resistant U2OS cells. n = 3 biological replicates. (C) Methotrexate-resistant U2OS cells were treated with the indicated RORγ inverse agonists for 2 days. Cells were harvested to determine cell growth by counting viable cells. n = 3 biological replicates. (D) Methotrexate-resistant U2OS cells were treated with the indicated RORγ inverse agonists and methotrexate for 2 days. Cells were harvested to determine cell growth by counting viable cells. n = 3 biological replicates. (E and F) Nude mice bearing methotrexate-resistant U2OS cell xenografts received RORγ inverse agonists (i.p., 5 mg/kg, n = 6) or vehicle (n = 6) five times per week and methotrexate (i.p., 5 mg/kg, n = 6) twice a week. (E) Mean tumor volume ± SEM. (F) Mean tumor weight ± SEM. (G and H) NOD/SCID mice (n = 6) bearing OS PDXs received RORγ inverse agonists (i.p., 4 mg/kg, n = 6) or vehicle (n = 6) five times per week and paclitaxel (i.p., 5 mg/kg, n = 6) twice a week. (G) Mean tumor volume ± SEM. (H) Mean tumor weight ± SEM. (I) Schematics illustrating chemo-resistant xenograft tumor establishment and treatment. (J and K) NOD/SCID mice bearing paclitaxel-resistant xenografts (143B-PAC-R) received RORγ inverse agonists XY018 (i.p., 5 mg/kg, n = 6) or vehicle (n = 6) five times per week and paclitaxel (i.p., 5 mg/kg, n = 6) once a week. (J) Mean tumor volume ± SEM. (K) Mean tumor weight ± SEM. (L) Anti-Ki67, cleaved caspase-3, and 4-HNE immunohistochemistry images and H&E staining of tumor sections are shown. Scale bar, 200 μm. Statistical analysis of IHC data is shown in the right panel. n = 3 biological replicates. All data from in vitro experiments shown above are the mean ± SD. ∗p < 0.05, ∗∗p < 0.01, ∗∗∗p < 0.001.

References

    1. Jiang Z.Y., Liu J.B., Wang X.F., Ma Y.S., Fu D. Current Status and Prospects of Clinical Treatment of Osteosarcoma. Technol. Cancer Res. Treat. 2022;21 - PMC - PubMed
    1. Fan T.M., Roberts R.D., Lizardo M.M. Understanding and Modeling Metastasis Biology to Improve Therapeutic Strategies for Combating Osteosarcoma Progression. Front. Oncol. 2020;10:13. - PMC - PubMed
    1. Yang J., Zhang A., Luo H., Ma C. Construction and validation of a novel gene signature for predicting the prognosis of osteosarcoma. Sci. Rep. 2022;12:1279. - PMC - PubMed
    1. Liu Y., Huang N., Liao S., Rothzerg E., Yao F., Li Y., Wood D., Xu J. Current research progress in targeted anti-angiogenesis therapy for osteosarcoma. Cell Prolif. 2021;54 - PMC - PubMed
    1. Gu L., Larson Casey J.L., Andrabi S.A., Lee J.H., Meza-Perez S., Randall T.D., Carter A.B. Mitochondrial calcium uniporter regulates PGC-1 alpha expression to mediate metabolic reprogramming in pulmonary fibrosis. Redox Biol. 2019;26 - PMC - PubMed

MeSH terms

Substances