. 2024 Jun;630(8017):695-703.
doi: 10.1038/s41586-024-07469-y. Epub 2024 May 1.

A body-brain circuit that regulates body inflammatory responses

Affiliations

A body-brain circuit that regulates body inflammatory responses

Hao Jin et al. Nature. 2024 Jun.

Abstract

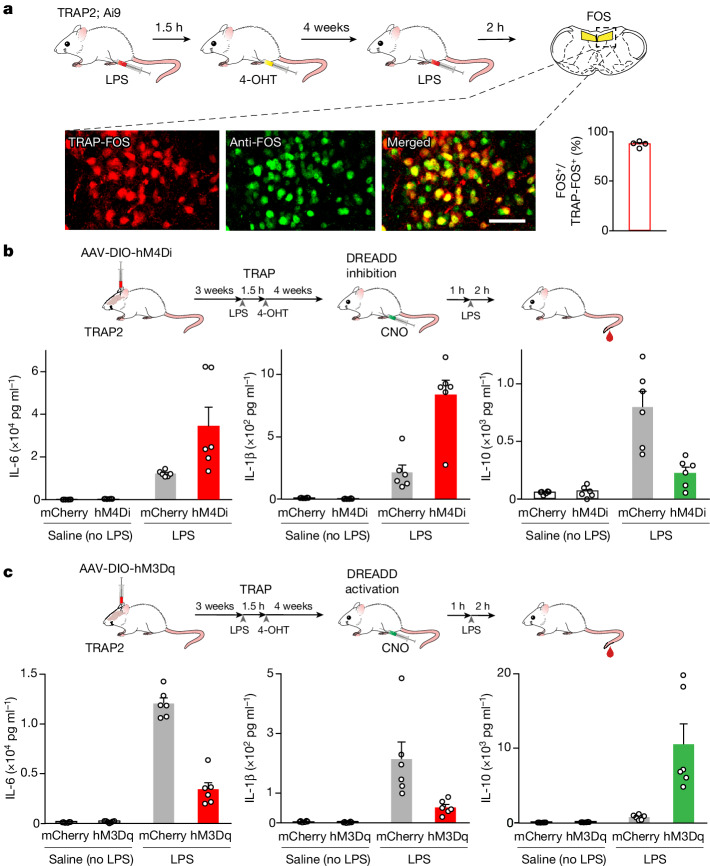
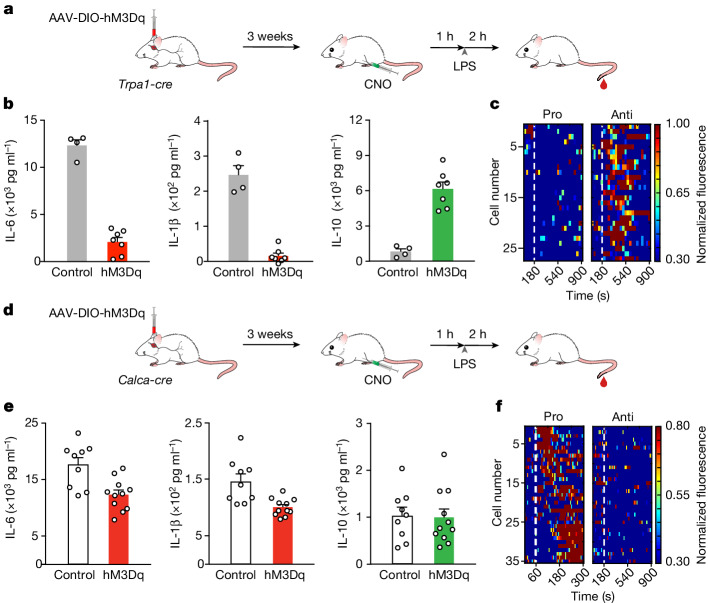
The body-brain axis is emerging as a principal conductor of organismal physiology. It senses and controls organ function1,2, metabolism3 and nutritional state4-6. Here we show that a peripheral immune insult strongly activates the body-brain axis to regulate immune responses. We demonstrate that pro-inflammatory and anti-inflammatory cytokines communicate with distinct populations of vagal neurons to inform the brain of an emerging inflammatory response. In turn, the brain tightly modulates the course of the peripheral immune response. Genetic silencing of this body-brain circuit produced unregulated and out-of-control inflammatory responses. By contrast, activating, rather than silencing, this circuit affords neural control of immune responses. We used single-cell RNA sequencing, combined with functional imaging, to identify the circuit components of this neuroimmune axis, and showed that its selective manipulation can effectively suppress the pro-inflammatory response while enhancing an anti-inflammatory state. The brain-evoked transformation of the course of an immune response offers new possibilities in the modulation of a wide range of immune disorders, from autoimmune diseases to cytokine storm and shock.


Conflict of interest statement

H.J. and C.S.Z. are co-inventors in a patent application describing this work. C.S.Z. is a scientific co-founder of Kallyope, Cajal Neurosciences and Nilo. All other authors declare no competing interests.

Figures

Fig. 1
Fig. 1. Immune responses activate the brain via the vagal–brain axis.
a, Schematic illustrating LPS-induced cytokine measurements (left). Wild-type mice were injected with saline or LPS, and peripheral blood was sampled every 2 h. Also shown are levels of IL-6, IL-1β, TNF and IL-10 by ELISA. LPS is in red or green; saline is in black; n = 5 mice. Values are means ± s.e.m. b, Schematic of FOS induction by LPS stimulation (top). Mice received an intraperitoneal injection of saline or LPS. Two hours later, brains were immunostained for FOS expression. Strong bilateral FOS labelling is detected in neurons of the cNST (highlighted in yellow) in LPS-stimulated mice (bottom); n = 5 mice. Quantification of FOS-positive neurons; the equivalent area of the cNST (200 × 200 μm, Bregma −7.5 mm) was processed for each sample (right). Values are mean ± s.e.m; Mann–Whitney U-tests, P = 0.008. Scale bars, 200 μm. AP, area postrema; DMV, dorsal motor vagal complex. c, Fibre photometry of LPS-evoked activity in the cNST (left). A GCaMP6s AAV was targeted to the cNST of Vglut2-cre mice (see Extended Data Fig. 5e). Neural responses following LPS (dark blue traces, 0.5 mg kg−1, n = 6; light blue traces, 0.1 mg kg−1, n = 4) and control saline (black traces, n = 6) (middle). Traces display mean (solid) and s.e.m. (shaded). The orange traces depict responses after bilateral vagotomy (n = 6). The saline and LPS injections were done as successive stimulations in the same animals. Scale bar, ΔF/F. The red arrow indicates time of injections. Quantification of responses (right). AUC, area under the curve. Values are mean ± s.e.m.; Wilcoxon test (saline versus LPS), P = 0.03; Mann–Whitney U-test (LPS versus vagotomy), P = 0.004; Mann–Whitney U-test (saline versus vagotomy), P = 0.18. Note the severe loss of LPS-evoked responses (approximately 80%) following removal of the vagal communication pathway. Schematics were created using BioRender (https://biorender.com).
Fig. 2
Fig. 2. Removing brain regulation transforms the inflammatory response.
a, Neurons marked by LPS-TRAPing (red, tdTomato) are the same as the FOS neurons labelled after a second cycle of LPS (green; see Methods). By comparing the number of neurons expressing tdTomato to the number of neurons labelled by FOS antibodies, we determined that more than 80% of LPS-TRAPed neurons were also positive for LPS–FOS (n = 4). Scale bar, 50 μm. 4-OHT, 4-hydroxytamoxifen. b, Inhibition of LPS-activated neurons in the cNST greatly increases the inflammatory response. AAVs carrying an mCherry construct, or the hM4Di inhibitory DREADD, were targeted to the cNST of LPS-TRAP2 mice for chemogenetic silencing. Control mCherry animals injected with LPS (grey bars) exhibit the expected induction of cytokines. By contrast, animals with silenced cNST neurons displayed increases in the levels of pro-inflammatory cytokines and a large reduction in the levels of an anti-inflammatory cytokine (IL-10; compare red or green and grey bars). Mice in all groups were given CNO 1 h before either the saline or the LPS injection; n = 6 for each group. Values are mean ± s.e.m.; Mann–Whitney U-tests: P = 0.24 (saline, IL-6), P = 0.97 (saline, IL-1β), P = 0.78 (saline, IL-10), P = 0.004 (LPS, IL-6), P = 0.004 (LPS, IL-1β) and P = 0.002 (LPS, IL-10). c, Chemogenetic activation of the cNST neurons during an immune response suppresses inflammation. The levels of anti-inflammatory (IL-10) and pro-inflammatory (IL-6 and IL-1β) cytokines in mice expressing excitatory DREADD (hM3Dq), or mCherry, in response to LPS are shown. All animals were given CNO 1 h before either the saline or the LPS injection (n = 6 for each group). Values are mean ± s.e.m.; Mann–Whitney U-tests: P = 0.17 (saline, IL-6), P = 0.93 (saline, IL-1β), P = 0.37 (saline, IL-10), P = 0.002 (LPS, IL-6), P = 0.002 (LPS, IL-1β) and P = 0.002 (LPS, IL-10). Schematics were created using BioRender (https://biorender.com).
Fig. 3
Fig. 3. A genetically defined population of cNST neurons modulates body immunity.
a, scRNA-seq cataloguing neuronal clusters in the cNST. A uniform manifold approximation and projection (UMAP) plot of transcriptomic data reveals 14 glutamatergic neuronal clusters (1–14, in colour) and 6 GABAergic clusters (15–20, in grey). b, scRNA-seq of individual LPS-TRAPed neurons from the cNST. The tdTomato-labelled LPS-TRAPed cells were isolated by fluorescence-activated cell sorting and individually sequenced. The UMAP of LPS-TRAPed neurons was then superimposed to the cNST map, showing the LPS-TRAPed neurons (highlighted in red). c, UMAP plot showing the normalized expression of the Dbh gene (left) and the strategy for hM3Dq DREADD activation of the DBH-expressing cNST neurons (right). d, Chemogenetic activation of DBH cNST neurons suppresses inflammation. The levels of anti-inflammatory (IL-10) and pro-inflammatory (IL-6, IL-1β and TNF) cytokines in mice expressing either excitatory hM3Dq or mCherry 2 h after LPS stimulation are shown. All mice were given CNO 1 h before the injection of saline or LPS. n = 4 animals for each group. Note the major decrease in the levels of pro-inflammatory cytokines and the large increase in the levels of anti-inflammatory IL-10. Values are mean ± s.e.m.; Mann–Whitney U-tests: P = 0.08 (saline, IL-6), P = 0.20 (saline, IL-1β), P = 0.23 (saline, TNF), P = 0.77 (saline, IL-10), P = 0.03 (LPS, IL-6), P = 0.03 (LPS, IL-1β), P = 0.03 (LPS, TNF) and P = 0.03 (LPS, IL-10). Schematics in panels b,c were created using BioRender (https://biorender.com).
Fig. 4
Fig. 4. Vagal neurons responding to anti-inflammatory and pro-inflammatory cytokines.
a, Recording of calcium responses in vagal neurons expressing GCaMP6s while stimulating mice with cytokines intraperitoneally. The heatmaps depict z-score-normalized fluorescence traces from two non-overlapping populations of neurons: responders to pro-inflammatory (Pro) cytokines (top panels) and responders to anti-inflammatory (Anti) cytokines (middle panels). Each row represents the activity of a single cell over 5 min. Stimulus was given at 60 s (dashed line). n = 5 mice, TNF (3 mice), IL-1β (2 mice) and IL-10 (5 mice); 21 of 423 imaged neurons responded to pro-inflammatory stimuli (13 to TNF and 8 to IL-1β), and 11 of 423 responded to IL-10. As positive controls, we used intestinal stimulation with glucose (Glu; 10 s); this activates the gut–brain axis,, but stimulates different vagal neurons (lower panels). These imaging experiments used cytokine concentrations that were lower or comparable with that measured during LPS-induced inflammation (see Extended Data Fig. 10b). The overall percent of responding neurons is similar to what is observed for vagal neurons dedicated to other body–brain signalling pathways,. i.p., intraperitoneal. b, Vagal neurons are not directly activated by LPS, even when using high concentrations of LPS (0.5 mg kg−1; n = 5 mice; pro: TNF; anti: IL-10). c, We carried out a similar experiment by using a perfusion chamber rather than intraperitoneal injections of LPS (see Methods). Each row in the heatmaps represents the averaged activity of a single cell to two trials. The dashed lines denote stimulus time window (180 s). n = 7 for IL-1β, n = 12 for IL-6 and n = 19 for IL-10. See also Extended Data Fig. 8. Schematics in panels a,c were created using BioRender (https://biorender.com).
Fig. 5
Fig. 5. Vagal control of inflammation.
a, Chemogenetic activation of TRPA1 vagal neurons. hM3Dq was targeted bilaterally to the nodose ganglion of Trpa1-cre mice. Control animals received AAV-DIO-mCherry. b, Chemogenetic activation of TRPA1 vagal neurons suppresses inflammation. The levels of IL-6, IL-1β and IL-10 cytokines in mice expressing hM3Dq (n = 7 mice) and mCherry (n = 4 mice) are shown. Blood was collected 2 h after LPS, and all animals were given CNO 1 h before LPS injection. Values are mean ± s.e.m.; Mann–Whitney U-tests: P < 0.01 (IL-6), P < 0.01 (IL-1β) and P < 0.01 (IL-10). c, Heatmaps depict z-score-normalized fluorescence traces from IL-10-responding TRPA1 vagal neurons. Each row represents the activity of a single cell over 15 min. The experiment was carried out using intraperitoneal injection or perfusion with similar results. n = 6 mice. Pro: IL-6, anti: IL-10. A total of 27 of 189 imaged TRPA1 neurons responded to IL-10. d, Chemogenetic activation of CALCA vagal neurons. AAV-DIO-hM3Dq was targeted bilaterally to the nodose ganglion of Calca-cre mice. Controls received AAV-DIO-mCherry. e, Chemogenetic activation of CALCA vagal neurons reduces the levels of pro-inflammatory cytokines. The levels of anti-inflammatory (IL-10) and pro-inflammatory cytokines (IL-6 and IL-1β) in mice expressing hM3Dq (n = 11 mice) and mCherry (n = 9 mice) are shown. Blood samples were collected 2 h after LPS stimulation, and all animals were given CNO 1 h before injection of LPS. Values are mean ± s.e.m.; Mann–Whitney U-tests: P < 0.01 (IL-6), P = 0.001 (IL-1β) and P = 0.88 (IL-10). f, Heatmaps depict z-score-normalized fluorescence traces from CALCA vagal neurons in response to pro-inflammatory cytokines (IL-6 and IL-1β). The experiment was carried out using intraperitoneal injections; n = 6 mice. A total of 35 of 211 imaged CALCA neurons responded to the pro-inflammatory stimuli. Schematics in panels a,d were created using BioRender (https://biorender.com).
Fig. 6
Fig. 6. Vagal–brain restoration of immune balance.
a, Activation of TRPA1 vagal neurons and DBH cNST neurons. AAV-DIO-hM3Dq was targeted bilaterally to the nodose ganglion of Trpa1-cre mice or the cNST of Dbh-cre mice. Control Cre-driver mice received AAV-DIO-mCherry. Mice were challenged with a lethal dose of LPS (see Methods), and the TRPA1 vagal or the DBH cNST neurons were activated by injection of CNO at 6-h intervals beginning 1 h before injection of LPS (four injections over 19 h). b, Activation of TRPA1 vagal (left) or DBH cNST (right) neurons rescues animals from LPS-induced sepsis. The graphs show survival curves. All groups received the same regime of CNO injections. mCherry (black lines; n = 9) and hM3Dq (green lines; n = 8 (vagal) and n = 9 (cNST)) are shown. Log-rank (Mantel–Cox) tests: P < 0.001 (vagal) and P < 0.001 (cNST). The red arrow denotes LPS injection. All mCherry control mice, in both groups, died within the first 4 days. c, DSS-induced ulcerative colitis. d, Activation of TRPA1 vagal neurons protects animals from DSS-induced colon damage. AAV-DIO-hM3Dq or mCherry was targeted bilaterally to the nodose ganglion of Trpa1-cre mice. All animals were provided with CNO in the drinking water (see Methods). Note the effect of DSS-induced inflammation on colon integrity (middle); the red arrows illustrate the loss of the distal colon in DSS-treated animals, but not in DSS-treated animals if this circuit was activated (right; n = 4; similar protection was observed in all animals). e, Bar graphs show levels of CXCL1 pro-inflammatory cytokine in control, DSS-treated and DSS-treated in combination with activation of TRPA1 vagal neurons. Values are mean ± s.e.m.; Mann–Whitney U-test: P = 0.03 (DSS, DSS + hM3Dq). f, Significant levels of occult stool blood is detected in the DSS-treated but not in the TRPA1 neuron-activated animals. Values are mean ± s.e.m.; Mann–Whitney U-test: P = 0.03. Schematics in panels a,c were created using BioRender (https://biorender.com).
Extended Data Fig. 1
Extended Data Fig. 1. cNST neurons activated in response to immune insults.
a, Schematic of Fos induction by LPS stimulation. Mice received an intraperitoneal injection with LPS, and two hours later, brains were extracted, sliced and immune-stained for Fos expression. b, Shown is Fos expression in six 100 μm coronal sections, each 300 μm apart from bregma −8.1mm to bregma −6.8mm. Note the selective induction of Fos in the cNST but not in the rostral nucleus of the solitary tract (rNST). Scale bars, 200 μm. Similar results were observed in multiple animals (n = 4). c, Fos is induced by a variety of immune insults. Schematic of Fos induction by immune stimulation. Mice received an intraperitoneal injection with a variety of different immune challenges, and two hours later, brains were extracted, and immuno-stained for Fos expression. d, Shown are examples for LPS (50 μg kg−1), Lipoteichoic acid (LTA, 1 mg kg−1), Flagellin (20 μg kg−1), Profilin (20 μg kg−1) and Zymosan (2.5 mg kg−1). All robustly activated Fos in the cNST (outlined in yellow). Scale bar, 200 μm. e, Schematic illustrating experimental procedures to TRAP cNST neurons activated by LPS. We genetically labelled the LPS-induced TRAPed neurons with a Cre-dependent fluorescent reporter (tdTomato, Ai9). TRAP2;Ai9 mice were stimulated intraperitoneally with LPS (50 μg kg−1) or control (saline) stimulus, followed by injection of 4-OHT 90 mins later. After 7 days, the brains were sectioned and examined for the induction of the tdTomato reporter. f, Shown are coronal sections of cNST after TRAP2;Ai9 animals were TRAPed with LPS or Saline. Each panel is a confocal maximal projection image from Bregma −7.5 mm. Shown are data representing 3 different animals, in independent experiments. Note that LPS but not saline led to consistent and robust bilateral TRAP labelling of neurons in the cNST(outlined in yellow) across animals. Scale bars, 200 μm. Schematics in panels a,c,e were created using BioRender (https://biorender.com).
Extended Data Fig. 2
Extended Data Fig. 2. Normal Fos induction to LPS is lacking in the cNST of Myd88 knockouts.
a, Blocking LPS signaling abrogates Fos induction in response to LPS. WT and Myd88−/− mice were injected with LPS intraperitoneally, and two hours later, brains were extracted, sliced and stained for Fos expression (see Fig. 1b). As a control, WT mice were injected with saline. Bilateral Fos expression is strongly induced by LPS in the cNST of WT mice but largely absent from Myd88−/− mice; n = 4 mice each. The right panel shows the quantification of Fos-positive neurons. The equivalent area of the cNST (200 μm X 200 μm, bregma −7.5 mm) was processed, and positive neurons were counted. Values are means ± SEM; ANOVA with Tukey’s honestly significant difference (HSD) post hoc test, p < 0.0001 (Saline vs LPS); p < 0.0001 (LPS vs Myd88−/− + LPS). Scale bar, 200 μm. b, Myd88 knockouts have impaired cytokine responses to LPS. WT and Myd88−/− mice received an intraperitoneal injection of LPS, and peripheral blood was taken 2 h later to measure circulating levels of pro- inflammatory (IL-6, IL-1β, TNF-α) and anti-inflammatory (IL-10) cytokines by ELISA. As a control, WT mice were injected with saline. Note that cytokine induction is dramatically reduced in Myd88−/− mice. n = 4 mice each group. Values are means ± SEM; ANOVA with Tukey’s HSD post hoc test, LPS vs Myd88−/− + LPS: p < 0.0001 (IL-6); p < 0.01 (IL-1β); p < 0.01 (TNF-α); p < 0.01 (IL-10). No significant difference was observed between Saline and Myd88−/− + LPS: p = 0.19 (IL-6), p = 0.88 (IL-1β), p = 0.52 (TNF-α); p = 0.96 (IL-10). Schematics were created using BioRender (https://biorender.com).
Extended Data Fig. 3
Extended Data Fig. 3. Activation of LPS-TRAPed neurons in the cNST does not elicit immune responses in the absence of immune challenge.
a, Schematic of chemogenetic activation strategy. AAV viruses carrying a control mCherry construct, or the hM3Dq excitatory DREADD, were targeted to the cNST of TRAP2 mice for chemogenetic activation. Mice were TRAPed with LPS (50 μg kg−1). After 4 weeks, cytokine responses to saline (i.e., without LPS) was quantified in the presence of DREADD agonist, CNO. b, Shown are levels of anti-inflammatory (IL-10) and pro-inflammatory (IL-6, IL-1β, TNF-α) cytokines in the peripheral blood of mice expressing excitatory DREADD (hM3Dq), or control (mCherry), in the LPS-TRAPed cNST neurons. All mice were injected with CNO 1 h prior to saline stimulation. Part of the data presented comes from Fig. 2c and replotted with an expanded y axis. Note that in the absence of the immune stimuli (LPS), activation of this circuit produces no meaningful effect on circulating cytokine levels. Grey bars (control), TRAP2 animals injected with DIO-mCherry (n = 6); black bars (hM3Dq), TRAP2 animals injected with DIO-hM3Dq (n = 6). Values are means ± SEM; Mann–Whitney U-tests, p = 0.17 (IL-6), p = 0.93 (IL-1β), p = 0.93 (TNF-α), p = 0.37 (IL-10). c, Single-cell RNA sequencing (scRNA-seq) cataloging neuronal clusters in the cNST. A uniform manifold approximation and projection (UMAP) plot of transcriptomic data revealed 14 Glutamatergic neuronal clusters (1-14, colored) and 6 GABAergic clusters (15-20, grey). d, ScRNA-seq of individual LPS-TRAPed neurons from the cNST. The tdTomato-labeled LPS-TRAPed cells were isolated by FACS and individually sequenced. The UMAP of LPS-TRAPed neurons was then superimposed onto the UMAP of the entire cNST map, showing that in addition to excitatory clusters (7, 10, 12, red; see Fig. 3b), an inhibitory cluster (15, black) also contains LPS-TRAPed neurons. Activation of this inhibitory cluster has no effect on cytokine levels after LPS injection (see Extended Data Fig. 4 below). Schematics in panels a,c,d were created using BioRender (https://biorender.com).
Extended Data Fig. 4
Extended Data Fig. 4. Activation of excitatory but not inhibitory neurons suppresses LPS-induced inflammation.
a, Activation of cNST glutamatergic neurons suppresses LPS-induced inflammation. Upper panels, UMAP plot of the normalized expression of Slc17a6 (also known as Vglut2) highlighting glutamatergic (excitatory) neuronal clusters in the cNST; also illustrated is the strategy for chemogenetic activation of the excitatory cNST neurons. An AAV virus carrying the Cre-dependent excitatory DREADD (hM3Dq) was targeted bilaterally to the cNST of Vglut2-cre mice. lower panels, shown are circulating levels of anti-inflammatory (IL-10) and pro-inflammatory (IL-6, TNF-α) cytokines in the peripheral blood of LPS-stimulated mice expressing excitatory DREADD (hM3Dq), or control (mCherry), in glutamatergic neurons. All animals were given CNO 1 h prior to the LPS injection. n = 7 animals for each group. Values are means ± SEM; Mann–Whitney U-tests, p = 0.002 (IL-6), p = 0.004 (TNF-α), p = 0.02 (IL-10). Note the increase in the levels of anti-inflammatory (compare grey and green bars), and decrease in the levels of pro-inflammatory cytokines (compare grey and red bars). b, Upper panels, UMAP plot of the normalized expression of Slc32a1 (also known as Vgat) highlighting the GABAergic (inhibitory) neuronal clusters in the cNST, and the chemogenetic strategy for activation of the inhibitory cNST neurons. Lower panels, shown are levels of anti-inflammatory (IL-10) and pro-inflammatory (IL-6, IL-1β) cytokines in the peripheral blood of mice after LPS-stimulation, both in mice expressing excitatory DREADD (hM3Dq), or control (mCherry) in GABAergic neurons. n = 4 mice for hM3Dq group and 5 mice for control (mCherry) group. Values are means ± SEM; Mann–Whitney U-tests, p = 0.73 (IL-6), p = 0.90 (IL-1β), p = 0.73 (IL-10). Note that activation of cNST GABAergic neurons does not meaningfully impact LPS-induced inflammation. Schematics were created using BioRender (https://biorender.com).
Extended Data Fig. 5
Extended Data Fig. 5. DBH is selectively expressed in the cNST.
A previous study reported that DBH was expressed almost exclusively in the AP. However, this conclusion was based solely on tissue extraction and sequencing, without anatomical validation. By contrast, we validated expression by directly examining DBH-expressing neurons in the cNST and in the AP. a, Diagram of a coronal section highlighting the cNST (in yellow) and the AP (in blue). b-d, First, we examined DBH expression by using Dbh-cre mice, crossed to the Ai9 tdT-reporter line. We detected most labeling in the cNST (n = 4 mice), with very minimal expression in the AP in the adult brain, and some of this may reflect limited expression during development (i.e., the Cre reporter acting as a lineage tracer). Next, we directly injected a Cre-dependent mCherry-reporter virus (AAV9-Syn-DIO-mCherry) into the cNST and AP of adult mice, and indeed nearly all of the labeling is detected in the cNST, with almost no expression in the AP (n = 5 mice). Finally, we performed in-situ hybridizations, and as shown with the reporter mice, expression is largely restricted to the cNST, with very low levels in the AP. Scale bars, 200 μm. Shown in the bar graphs are the quantitation of DBH expressing neurons in cNST vs AP. e, Sample brain demonstrating expression of GCaMP6s restricted to the cNST, with minimal expression in the AP; the image also demarks the location of the recording fiber (dashed rectangle). Scale bar, 100 μm. Similar results were observed in the analyzed animals, both control and vagotomized (n = 6 each). Schematics in panels a,e were created using BioRender (https://biorender.com).
Extended Data Fig. 6
Extended Data Fig. 6. Immune insult activate DBH neurons in the cNST.
a, Schematic illustrating Fos induction in DBH neurons in the cNST by LPS and cytokine stimulation. Dbh-cre mice were injected intraperitoneally with LPS, IL-10 or a cocktail of IL-6, IL-1β, and TNF-α, and brain slices were analyzed for Fos and Dbh labeling. DBH neurons were marked by tdTomato (tdT) expression (Ai9 reporter line), and Fos by immunohistochemistry. Schematics in panel a were created using BioRender (https://biorender.com). b-c, Coronal sections of the brain stem showing neurons expressing DBH (Dbh-tdT, red) and neurons activated by LPS (top row), IL-10 (anti-inflammatory, middle row), or by a cocktail of 3 pro-inflammatory cytokines (100 μg kg−1 TNF-α,100 μg kg−1 IL-6, 100 μg kg−1, IL-1β, bottom row). Note that all three stimuli activate DBH neurons. Scale bar, 200 μm. d, Quantification of the fraction of DBH neurons that express immune-induced Fos (n = 4 mice each group). Anti = IL-10, pro = a mixture of TNF-α, IL-6, and IL-1β. Values are means ± SEM; ANOVA with Tukey’s HSD post hoc test, LPS vs Saline: p < 0.0001; Anti vs Saline: p < 0.0001; Pro vs Saline: p < 0.0001. The fraction of Fos+ neurons that also expressed DBH are: LPS 21.4% ± 1.5%; Pro 20.0% ± 1.2%; Anti 33.3% ± 3.6%. As would be expected, there are significantly more Fos-positive neurons activated by the immune stimuli than the overlap with DBH; these likely respond and/or mediate other effects of LPS and cytokine stimulation (like malaise, etc).
Extended Data Fig. 7
Extended Data Fig. 7. Ablation of DBH cNST neurons increases inflammatory responses.
a, Anti-DBH Saporin (SAP), was injected bilaterally into the cNST to selectively ablate DBH neurons; control mice were injected with PBS. The bar graphs show circulating levels of pro-inflammatory (IL-6, TNF-α) and anti-inflammatory (IL-10) cytokines in the peripheral blood of control mice, and DBH-ablated animals (Dbh-SAP) after LPS stimulation. Note the significant increase in the levels of IL-6 and TNF-α after LPS stimulation in Anti-DBH Saporin mice versus control animals (n = 5 each group). As seen with the TRAPped cNST neurons (Fig. 2b), the level of IL-10 is greatly reduced in the ablated mice (n = 5 each group). Values are means ± SEM; Mann–Whitney U-tests, IL-6: p = 0.02; TNF-α: p = 0.04; IL-10: p = 0.02. b, Loss of DBH neurons in the cNST after Dbh-SAP induced cell-death. Upper panel, diagram of a coronal section highlighting the cNST (in yellow). Lower panels show in situ hybridization signals for Dbh RNA in the cNST of control and Dbh-SAP treated mice. Note the dramatic loss of DBH neurons in the cNST of the experimental animals (compare right panel with left control); similar results were observed in independently injected animals; the bar graph shows quantitation for 5 animals. PBS, control animals injected with PBS; Dbh-Ablation, animals injected with Dbh-SAP (see Methods for details). Scale bars: 200 μm. Values are means ± SEM; Mann–Whitney U-tests, p = 0.008. Schematics were created using BioRender (https://biorender.com).
Extended Data Fig. 8
Extended Data Fig. 8. Vagal responses to anti-inflammatory and pro-inflammatory cytokines.
a, Schematic of vagal calcium imaging while simultaneously delivering cytokines onto the intestines. (see Methods for details) b, The micrograph shows a representative view of a nodose ganglion from Vglut2-cre; Ai96 during an imaging session. All vagal sensory neurons express GCaMP6s. Right panels show representative traces from vagal neurons selectively responding to anti-inflammatory (IL-10, upper panel) and pro-inflammatory (IL-6, lower panel) cytokines. Each cytokine was perfused for 180 seconds (starting at the time indicated by the color arrows; green, IL-10; red, IL-6) in 2 repeat trials. Scale bar, 100 μm. Summary data is presented in Fig. 4c. c, Responses of TRPA1 vagal neurons to anti-inflammatory cytokines. The micrograph depicts a sample nodose ganglion from Trpa1-cre; Ai162 during an imaging session. Right panel is the sample trace. Scale bar, 100 μm. d, The heat maps depict z-score-normalized fluorescence traces from vagal neurons responding to individual pro-inflammatory cytokines. Each row represents the averaged activity of a single cell to 2 trials. Dashed lines denote stimulus time window (180 sec). n = 5 mice. e, IL-10 and fat activate distinct subsets of TRPA1 vagal neurons. Previously, we showed that a subset of TRPA1-vagal neurons transfer fat signals from the intestines to the brain, via the gut-brain axis, to drive the development of fat preference. The heat map shows that the TRPA1 neurons that selectively responded to extraintestinal application of IL-10 (top panel), are unique and separate from the pool of neurons that responded to fat (LA, middle panel). Shown are the responses of 63 TRPA1-labeled vagal neurons to anti-inflammatory stimuli and to intestinal delivery of fat. Heat maps depict z-score-normalized responses to stimuli of IL-10 (1 μg ml−1) and fat (LA, 10% linoleic acid). IL-10 was perfused onto the intestines for 180 s (dashed lines) and linoleic acid was infused into the gut for 10 s (dashed lines). Each row represents the average activity of a different neuron during two exposures to the stimulus. n = 4 mice. Shown also are 2 neurons that appeared to respond to both stimuli (bottom panel); given that these represent less than 1 neuron per animal they were not considered further. Schematics in panels a,d,e were created using BioRender (https://biorender.com).
Extended Data Fig. 9
Extended Data Fig. 9. Neuronal clusters in the Vagal ganglia.
a, Strategy for chemogenetic activation of vagal neuronal populations. An excitatory DREADD receptor (via AAV-DIO-hM3Dq) was targeted bilaterally to the nodose ganglia of Vip-cre, Gpr65-cre, Piezo2-cre and Oxtr-cre mice. The mice were then examined for changes in circulating cytokine levels in response to LPS in the presence of the DREADD receptor agonist CNO. Schematics in panel a were created using BioRender (https://biorender.com). b-e, The bar graphs show cytokine levels of IL-6, IL-1β and IL-10 in the peripheral blood of mice expressing either excitatory DREADD (hM3Dq) or control mCherry in VIP, GPR65, PIEZO2, OXTR vagal neurons, 2 h after LPS stimulation. All mice were injected with CNO 1 h prior to LPS. b, Vip: n = 4 each group; Mann–Whitney U-tests, p (IL-6) = 0.88, p (IL-1β) = 0.88, p (IL-10) = 0.2. c, Gpr65: n = 5 (control) and 4 (hM3Dq); Mann–Whitney U-tests, p (IL-6) = 0.03, p (IL-1β) = 0.06, p (IL-10) = 0.55. d, Piezo2: n = 5 each group; Mann–Whitney U-tests, p (IL-6) = 0.54, p (IL-1β) = 0.42, p (IL-10) = 0.42. e, Oxtr: n = 5 each group; Mann–Whitney U-tests, p (IL-6) = 0.84, p (IL-1β) = 0.65, p (IL-10) = 0.84. Values are means ± SEM; Activation of any of these vagal populations has no appreciable effect on LPS-induced cytokine responses.
Extended Data Fig. 10
Extended Data Fig. 10. Enhancement of the anti-inflammatory response does not rely on the reduction of pro-inflammatory cytokines.
a, AAV viruses carrying a control mCherry construct, or the hM3Dq excitatory DREADD, were targeted bilaterally to the nodose ganglion of Trpa1-cre mice for chemogenetic activation. All of the mice received an intraperitoneal injection of LPS to elicit an inflammatory response. Animals were then divided into 2 groups: control (no clamping), and the experimental (Pro-inflammatory clamping) where they were additionally injected with high levels of a pro-inflammatory cytokine cocktail (IL-6, IL-1β, TNF-α) to “clamp”, and thus maintain a high pro-inflammatory state (see Methods). Animals with activated TRPA1 vagal neurons in the control group (i.e., only injected with LPS) exhibited the expected enhancement in circulating IL-10 and a reduction in the levels of the pro-inflammatory cytokines. Notably, the levels of IL-10 remain similarly enhanced by TRPA1 vagal stimulation, even when the levels of pro-inflammatory cytokines are not suppressed. Blood samples were collected 2 h after LPS stimulation, and all animals were given CNO 1 hr prior to LPS injection. n = 5 mice (mCherry No “Clamping”); n = 4 for all other groups. Values are means ± SEM; Mann–Whitney U-tests, IL-10 levels in mCherry No “Clamping” vs mCherry Pro-inflammatory “Clamping”, p = 0.99; IL-10 levels in hM3Dq No “Clamping” vs hM3Dq Pro-inflammatory “Clamping”, p = 0.20. b, Levels of circulating IL-6, TNF-α, IL-10 in mice following an intraperitoneal injection of exogenous IL-6 (100 μg kg−1), TNF-α (100 μg kg−1), or IL-10 (100 μg kg−1), taken 10 mins or 2 hrs after the injection (n = 5 mice each group). Also shown are the levels of the same cytokines after LPS (2 hrs). Values are means ± SEM. Schematics were created using BioRender (https://biorender.com).
Extended Data Fig. 11
Extended Data Fig. 11. Ablation of TRPA1 vagal neurons prevents the emergence of a normal anti-inflammatory response.
a, Ablation of TRPA1 vagal neurons block the induction of Fos in response to IL-10 stimulation. Diphtheria toxin (DTX) was injected bilaterally into the nodose ganglion of Trpa1-cre;Rosa-DTR mice to selectively ablate TRPA1 vagal neurons. Control animals received injection of PBS. Mice were then examined for cNST Fos induction 2 h following intraperitoneal injection of IL-10 (see Extended Data Fig. 6). IL-10 stimulation induces significant Fos labelling in control but not in animals lacking vagal TRPA1 neurons (Trpa1-Ablated). The right panel shows the quantification of Fos-positive neurons (n = 4 mice each). The equivalent area of the cNST (200 μm X 200 μm, bregma −7.5 mm) was processed. Values are means ± SEM; Mann–Whitney U-test, p = 0.03. b, Ablation of TRPA1 vagal neurons prevents a normal anti-inflammatory response. Bar graphs show the levels of anti-inflammatory (IL-10) and pro-inflammatory (IL-6, IL-1β) cytokines in the peripheral blood of control mice, and TRPA1-ablated animals (Trpa1-ablated) after LPS stimulation. Note the significant change in the levels of IL-10 after LPS stimulation in mice missing TRPA1 vagal neurons (n = 4) versus control animals (n = 5). By contrast, the levels of IL-6 and IL-1β are largely unaffected in mice lacking TRPA1 vagal neurons. Values are means ± SEM; Mann–Whitney U-tests, IL-10: p = 0.03; IL-6: p = 0.90; IL-1β: p = 0.90. Schematics were created using BioRender (https://biorender.com).
Extended Data Fig. 12
Extended Data Fig. 12. A vagal to cNST circuit.
a, Strategy for targeting a green fluorescently labelled retrograde transsynaptic rabies reporter (RABV–GFP),, to the cNST. DBH neurons in the cNST (in Dbh-cre animals) were infected with AAV-Flex-G-mKate (red fluorescence) and AAV-Flex-TVA-mCherry (also red fluorescence) viruses,,. The targeted expression of the G-protein and the TVA receptor allows monosynaptic transfer and expression of the RABV-GFP retrograde virus. b, DBH Neurons in the cNST that were co-infected by the AAV-G and AAV-TVA viruses and by the RABV-GFP retrograde reporter are highlighted with asterisks. c, DBH neurons receive monosynaptic input from CALCA vagal neurons. RNA fluorescence in situ hybridization (in situs) marking CALCA neurons (left panel, red) and GFP from the retrograde virus (middle panel, green), demonstrating that CALCA neurons in the nodose ganglion directly project to DBH neurons in the cNST. The CALCA vagal neurons co-labeled with RABV-GFP are indicated by asterisks. The right panel shows the merged view. n = 3 mice, Scale bars, 50 μm. The fraction of Calca neurons that are labeled by the transsynaptic reporter is 12.2 ± 1.4%. d, DBH neurons receive monosynaptic input from TRPA1 vagal neurons. RABV-GFP from DBH neurons in the cNST retrogradely labels TRPA1 vagal neurons. The TRPA1 vagal neurons co-labeled with RABV-GFP are indicated by asterisks. The right panel shows an enlarged merged view. n = 3 mice, Scale bars, 50 μm. The fraction of Calca neurons that are labeled by the transsynaptic reporter is 13.1 ± 3.5%. Overall, only a small fraction of the TRPA1 (or Calca) neurons are labeled by the retrograde virus. This is expected due to: (i) the limited efficiency of the TVA retrograde labeling system, (ii) TRPA1 neurons represent multiple functional types, for example those that carry signals informing the brain of intestinal fat versus those that report inflammatory responses (see Extended Data Fig. 8e), and (iii) DBH neurons would be expected to receive inputs from other vagal neurons that will also be labeled by the retrograde reporter (for instance CALCA and others). e, Stimulation of TRPA1 vagal neurons activates DBH neurons in the cNST. An excitatory DREADD receptor (via AAV-DIO-hM3Dq) was targeted bilaterally to the nodose ganglion of Trpa1-cre mice. The mice were then examined for the induction of Fos in the cNST. Lower panels show in-situ hybridizations for Dbh (red) and Fos (green). Scale bars, 50 μm. Approximately 40% of DBH neurons are activated in response to TRPA1 neuron stimulation (bar graph). Schematics in panels a,e were created using BioRender (https://biorender.com).
Extended Data Fig. 13
Extended Data Fig. 13. Activation of TRPA1 vagal neurons impacts the course of Salmonella infection.
We reasoned that strong and sustained activation of the TRPA1 vagal neurons would drive a potent anti-inflammatory state, and this would be expressed as heightened susceptibility to bacterial infection. To test this prediction, we infected mice by gut gavage with Salmonella enterica Serovar Typhimurium (STm), and monitored the course of infection over 5 days. a, Strategy for chemogenetic activation of TRPA1 vagal neurons. An excitatory DREADD receptor (via AAV-DIO-hM3Dq) was targeted bilaterally to the nodose ganglion of Trpa1-cre mice. Control mice received injections of AAV-DIO-mCherry. Mice were infected with STm (1~2 x10^7 CFU) via oral gavage. We maximally activated the circuit by injecting CNO at 12 h intervals for a total of 8 injection beginning 12 h prior to STm infection. Body weight was monitored daily. b, Activation of TRPA1 vagal neurons impairs protection against STm infeciton. Left graph shows the load of STm in the spleens and mesenteric lymph nodes (LNs) of mice expressing the excitatory DREADD (hM3Dq; n = 4 mice) or control reporter (mCherry; n = 4 mice). Note the nearly 2-log increase in STm load in the spleen and LN of TRPA1-activated animals, reflecting the suppressed pro-inflammatory state. Values are means ± SEM; Mann–Whitney U-test, spleen, p = 0.03; LN, p = 0.03. c, As expected, these animals also experienced a severe loss of body weight during the course of STm infection (right panel). d, Activation of the vagal-brain axis does not alter the levels of circulating corticosterone induced by LPS. An AAV virus carrying the hM3Dq excitatory DREADD, was targeted to the cNST of Dbh-cre mice for chemogenetic activation. Control animals received an injection of AAV-DIO-mCherry. The bar graphs show levels of corticosterone in the peripheral blood of mice expressing the excitatory DREADD (hM3Dq; n = 4 mice) or control reporter (mCherry; n = 4 mice). Blood samples were collected 2 h after LPS stimulation, and all animals were given CNO 1 hr prior to LPS injection. Values are means ± SEM; Mann–Whitney U-test, p = 0.32. e, An AAV virus carrying the hM3Dq excitatory DREADD, was targeted to the TRPA1 vagal neurons for chemogenetic activation. The bar graphs show the levels of corticosterone in the peripheral blood of the mice expressing the excitatory DREADD (hM3Dq; n = 5 mice) or control reporter (mCherry; n = 5 mice). Values are means ± SEM; Mann–Whitney U-tests, p = 0.84. Schematics in panels a,d,e were created using BioRender (https://biorender.com).

References

    1. Guyenet PG, Bayliss DA. Neural control of breathing and CO2 homeostasis. Neuron. 2015;87:946–961. doi: 10.1016/j.neuron.2015.08.001. - DOI - PMC - PubMed
    1. Prescott SL, Liberles SD. Internal senses of the vagus nerve. Neuron. 2022;110:579–599. doi: 10.1016/j.neuron.2021.12.020. - DOI - PMC - PubMed
    1. Myers MG, Jr, Olson DP. Central nervous system control of metabolism. Nature. 2012;491:357–363. doi: 10.1038/nature11705. - DOI - PubMed
    1. Augustine V, Lee S, Oka Y. Neural control and modulation of thirst, sodium appetite, and hunger. Cell. 2020;180:25–32. doi: 10.1016/j.cell.2019.11.040. - DOI - PMC - PubMed
    1. Li M, et al. Gut–brain circuits for fat preference. Nature. 2022;610:722–730. doi: 10.1038/s41586-022-05266-z. - DOI - PMC - PubMed