. 2024 May 1;15(1):3698.
doi: 10.1038/s41467-024-48025-6.

Glis2 is an early effector of polycystin signaling and a target for therapy in polycystic kidney disease

Affiliations

Glis2 is an early effector of polycystin signaling and a target for therapy in polycystic kidney disease

Chao Zhang et al. Nat Commun. .

Abstract

Mouse models of autosomal dominant polycystic kidney disease (ADPKD) show that intact primary cilia are required for cyst growth following the inactivation of polycystin-1. The signaling pathways underlying this process, termed cilia-dependent cyst activation (CDCA), remain unknown. Using translating ribosome affinity purification RNASeq on mouse kidneys with polycystin-1 and cilia inactivation before cyst formation, we identify the differential 'CDCA pattern' translatome specifically dysregulated in kidney tubule cells destined to form cysts. From this, Glis2 emerges as a candidate functional effector of polycystin signaling and CDCA. In vitro changes in Glis2 expression mirror the polycystin- and cilia-dependent changes observed in kidney tissue, validating Glis2 as a cell culture-based indicator of polycystin function related to cyst formation. Inactivation of Glis2 suppresses polycystic kidney disease in mouse models of ADPKD, and pharmacological targeting of Glis2 with antisense oligonucleotides slows disease progression. Glis2 transcript and protein is a functional target of CDCA and a potential therapeutic target for treating ADPKD.


Conflict of interest statement

S.S. is a consultant for, and a scientific co-founder with equity interest in Sen Therapeutics. T.A.B.3rd was an employee of Ionis Pharmaceuticals at the time of this study. There are no more competing interests.

Figures
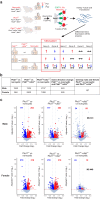
Fig. 1
Fig. 1. Translating ribosome affinity purification (TRAP) RNASeq in Pkd1 mouse models.
a Schematic outline of the TRAP RNASeq strategy. Male and female mice with the indicated genotypes were induced with doxycycline from P28–P42 to inactivate the respective conditional alleles and to activate the EGFP-L10a ribosomal fusion protein in a Cre recombinase dependent cell-specific manner. Labeled ribosomes were isolated from fresh kidney tissues, frozen and processed together in a single batch by RNASeq. Bioinformatic analysis of three pairwise comparisons for each sex identified differentially expressed genes (DEG). In the example shown, only Genes A and B show the same relative direction change in both the Pkd1KO vs. noncystic and the Pkd1KO vs. the Pkd1KO+ciliaKO comparisons. Genes A and B are said to have the “CDCA pattern” of expression whereas Genes C–F do not. b Table showing numbers of DEGs identified for each sex in the indicated pairwise analyses and in Pkd1KO compared to both other groups. Complete gene lists are provided Supplementary Data 2. c Volcano plots of DEGs in males (upper panels) and females (lower panels) for the indicated pairwise comparisons. Genes with significant differential expression (FDR ≤ 0.05) and same change direction in Pkd1KO compared to both noncystic and Pkd1KO+ciliaKO groups are indicated by red dots and numbers (upregulated) and blue dots and numbers (downregulated). The sum of the numbers of significant DEGs with the same direction change, 440 for males and 526 for females, correspond to the data in (b). Gray dots and NS represent genes with FDR > 0.05. Red dashed line, adjusted p value ≤ 0.05 threshold; blue dashed line, two-fold change threshold. Detection of DEGs was done with the DESeq2 R package (version 1.30.1) using a negative binomial generalized linear model. The Benjamini–Hochberg procedure was used for multiple test correction with FDR ≤ 0.05 used as the threshold for statistical significance. Additional data are provided in Supplementary Figs. 1–6.
Fig. 2
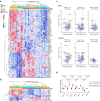
Fig. 2. Core group of 73 “CDCA pattern” identified by TRAP RNASeq.
a Heat map showing unsupervised hierarchical clustering of TRAP RNASeq expression data for 73 genes common to male and female mice that showed significant same relative direction change in expression in Pkd1KO compared to noncystic and Pkd1KO+ciliaKO and that have expression TPM > 1.0 reported in a majority of microdissected kidney tubule segments (see text for details; Supplementary Data 4). Color scale indicates relative gene expression value. Selected genes discussed in the text and shown in red in (a) are presented in a heat map with unsupervised hierarchal clustering (b), and labeled on volcano plots (c) with the indicated pairwise comparisons in male (top) and female (bottom) mice. Detection of DEGs was done with the DESeq2 R package (version 1.30.1) using a negative binomial generalized linear model. The Benjamini–Hochberg procedure was used for multiple test correction with FDR ≤ 0.05 used as the threshold for statistical significance. d Quantitative RT-PCR (qRT-PCR) for the indicated genes from primary cells cultured from kidneys of Pkd1fl/fl; Pax8rtTA; TetOCre mice. Cells were either treated with doxycycline (red) to knockout Pkd1 or left untreated (blue) without Pkd1 knockout. n = 3 biological replicates for each gene and condition. Statistical significance for each gene was determined by unpaired two-tailed Student’s t test and presented as mean ± s.e.m. Expression of each gene following Pkd1 knockout recapitulated the relative direction change compared to non-knockout controls as was observed by TRAP RNASeq in vivo (ac). Source data for (d) are provided as a Source Data file. Additional data are provided in Supplementary Fig. 7.
Fig. 3
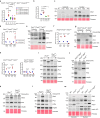
Fig. 3. Glis2 expression is an in vitro indicator of polycystin dependent cyst forming potential.
a qRT-PCR of Glis2 from kidney tissue lysates of noncystic (blue) and cystic Pkd2 knockout (red) 13 week old mice and from Pkd2 knockout kidneys following 2, 4 and 6 days of re-expression begun at 13 weeks. All mice received oral doxycycline from P28–42. Noncystic mice lack Pax8rtTA. Fold-change Glis2 expression relative to that in noncystic mice which is set to 1.0. b qRT-PCR and (c) immunoblot of kidney tissue lysates from wild type mice at postnatal days 1, 10, 20 and 40. b Fold-change Glis2 relative to its expression at P40 which is set to 1.0. c Glis2 expression in cytosolic and nuclear fractionated kidney tissue lysates. d, f qRT-PCR and (e, g) immunoblots from primary kidney cells with Pkd1 (d, e) and Pkd2 (f, g) knockout following. doxycycline treatment during in vitro cell culture. d, f Fold change following doxycycline mediated inactivation (red) relative to expression of the same gene in cells without doxycycline (blue) which is set to 1.0. h qRT-PCR and (ik) immunoblots from lysates of primary kidney cell cultures following in vitro doxycycline inducible inactivation of Pkd1 and Kif3a (h, i), Pkd2 and Ift88 (j), and Pkd1 and Tulp3 (k). All mice have Pax8rtTA;TetOCre in addition to the indicated alleles. h Fold change following doxycycline mediated inactivation (red) relative to expression of the same gene without doxycycline (blue) which is set to 1.0. i, k *, non-specific band. l, m Immunoblots from total kidney tissue lysates from mice with indicated allele combinations. All mice also have Pax8rtTA;TetOCre alleles and received oral doxycycline from P28–42; kidney tissue was obtained at 10 weeks (l) and 12 weeks (m). Experiments in (c, g, j, m) were done two times with primary cell cultures from different mice; i, k were done three times; e, l were done more than three times. a, b Multiple-group comparisons using one-way ANOVA followed by Tukey’s multiple-comparison test and presented as the mean ± s.e.m. d, f, h Statistical significance for each gene is determined by unpaired two-tailed Student’s t test and presented as mean ± s.e.m. c, g, m Lamin A/C and (e) Lamin B1, loading control and relative enrichment for nuclear fractions. il Hsp90 loading control. c, e, g, im Ponceau S serves as another loading control. Source data for exact values and images of uncropped blots are provided as a Source Data file. Additional data are provided in Supplementary Figs. 8–11.
Fig. 4
Fig. 4. Glis2 inactivation suppresses progression in mouse models of polycystic kidney disease.
a, e, i, m Representative images of kidneys with the specified genotypes and bd, fh, jl, np show corresponding kidney structural (b, f, j, n kidney weight to body weight ratio; c, g, k, o cystic index) and functional (d, h, l, p blood urea nitrogen) measures for male (closed symbols) and female (open symbols) mice. n, number of mice except in (o), where it is the number of kidneys. Multiple-group comparisons were performed by one-way ANOVA followed by Tukey’s multiple-comparison test, presented as mean ± s.e.m. a, e, i, m Scale bars, 1 mm. ad Pkd1 models based on the collecting duct selective Pkhd1-Cre at P24. Genotypes in (bd) correspond to symbol color and shape coding in (a). eh Pkd1 models based on Pax8rtTA induced with oral doxycycline from P1–14 and examined at P14. Genotypes in (fh) correspond to symbol color and shape coding in (e). il Pkd1 models based Pax8rtTA induced with oral doxycycline from P28–42 and examined at 18 weeks. Genotypes in (jl) correspond to symbol color and shape coding in (i). mp Pkd2 models based on the Pkd2WS25 allele examined at 14 weeks. Genotypes in (np) correspond to symbol color and shape coding in (m). Source data for exact values are provided as a Source Data file. Additional data are provided in Supplementary Figs. 12–18.
Fig. 5
Fig. 5. Glis2 antisense oligonucleotide (ASO) reduces kidney cyst growth in an adult onset ADPKD model.
a Representative kidney images, b kidney weight to body weight ratio, c cyst index and d blood urea nitrogen from mice with the indicated genotypes in (a) and matched symbol color and shape codes in (bd) at 18 weeks age. Pkd1 inactivation was induced with tamoxifen administration from P28–35 and control- or Glis2-ASO was administered twice in week 5 and then weekly through 18 weeks age. All mice received tamoxifen regardless of genotype. One group of noncystic controls also received Glis2-ASO; the other did not. el Representative images of two-color fluorescent in situ hybridization (FISH) for Glis2 mRNA (green) and the proximal tubule marker gene Lrp2 (red) encoding megalin. bd Male mice, closed symbols; female mice, open symbols. n number of mice. eh Single molecule FISH (smFISH); il RNAScope-FISH. Glis2 expression is detected by both methods in control mouse kidneys (e, i) and the specificity of both probes is demonstrated by the absence of signal for Glis2 in kidneys from Glis2−/− mice (f, j). Glis2 signal by both FISH methods is increased relative to control kidney in Lrp2 positive proximal tubule derived cysts in mice treated with control-ASO (g, k). Glis2 signal by both FISH approaches is decreased relative to control-ASO in proximal tubules of mice treated with Glis2-ASO (h, l). All mice, except (f, j), received tamoxifen IP daily from P28-35; all kidneys were examined at age 18 weeks. Treatment with Glis2-ASO significantly decreased Glis2 mRNA levels in proximal tubules of Pkd1fl/fl;UBCCre-ERT2 male mice compared to control-ASO treated counterparts when measured both smFISH (m) and RNAScope-FISH (n). n = 3 for all groups. Multiple-group comparisons (bd, m) were performed by one-way ANOVA followed by Tukey’s multiple-comparison test. Comparison between two groups (n) was performed by one-tailed unpaired Student’s t test. All data are presented as mean ± s.e.m. Scale bar, 1 mm (a); 50 μm (el). Source data for exact values are provided as a Source Data file. Additional data are provided in Supplementary Figs. 19–24.
Fig. 6
Fig. 6. Glis2-ASO treatment decreases cyst cell proliferation, inflammation, and fibrotic changes in a model of ADPKD.
an Analyses of kidney tissues from noncystic mice (red symbols) and polycystic Pkd1;UBCCre-ERT2 mice treated with control-ASO (blue) or Glis2-ASO (green). All mice are male; all received tamoxifen from P28–35; treatment groups received the respective ASO from weeks 5 to 18. Kidney tissue was examined at 18 weeks. a, c Aggregate quantitative data and (b, d) representative images showing the percentage of EdU-positive nuclei (a, b) and Ki67-positive nuclei (c, d) in the Lotus tetragonolobus agglutinin (LTA) positive proximal tubules. e qRT-PCR for Adgre1, encoding F4/80, from kidney lysates normalized to Gapdh, expressed as fold-change relative to the mean for control kidneys which is set to 1.0. f Representative images of F4/80 expression near proximal tubules. Changes in inflammatory responses indicated by changes in TNF-α (g, h) and cleaved caspase-1 (i, j). Immunoblots are shown with quantitation using densitometric ratios (g, i) that include two bands each for TNF-α (g) and cleaved caspase-1 (i) normalized to Hsp90. Fold-change is shown relative to the mean of the ratio in the non-cystic samples, which is set to 1.0. Representative images of TNF-α (h) and cleaved caspase-1 (j). kn Changes in fibrotic responses indicated by changes in α-SMA (k, i) and PDGFRβ (m, n) expression following control- or Glis2-ASO treatment. Immunoblots are shown with quantitation using densitometric ratios (k, m) for α-SMA (k) and PDGFRβ (m) normalized to Hsp90. Fold-change is shown relative to the mean of the ratio in the non-cystic samples, which is set to 1.0. Representative images of α-SMA (l) and PDGFRβ (n). b, d, f, h, j, l, n At least one section from 3 kidneys for each group was examined for all representative images. Scale bars: 150 µm (b, d); 50 μm (f, h, j, l, n). a, c, e, g, i, k, m Multiple-group comparisons were performed by one-way ANOVA followed by Tukey’s multiple-comparison test, presented as mean ± s.e.m. Full-length blots are provided as source data. Source data for exact values and images of uncropped blots are provided as a Source Data file.

Similar articles

Cited by

References

    1. Cornec-Le Gall E, Alam A, Perrone RD. Autosomal dominant polycystic kidney disease. Lancet. 2019;393:919–935. doi: 10.1016/S0140-6736(18)32782-X. - DOI - PubMed
    1. Bergmann C, et al. Polycystic kidney disease. Nat. Rev. Dis. Prim. 2018;4:50. doi: 10.1038/s41572-018-0047-y. - DOI - PMC - PubMed
    1. Masyuk TV, Masyuk AI, LaRusso NF. Polycystic liver disease: advances in understanding and treatment. Annu. Rev. Pathol. 2022;17:251–269. doi: 10.1146/annurev-pathol-042320-121247. - DOI - PMC - PubMed
    1. Perrone RD, Malek AM, Watnick T. Vascular complications in autosomal dominant polycystic kidney disease. Nat. Rev. Nephrol. 2015;11:589–598. doi: 10.1038/nrneph.2015.128. - DOI - PMC - PubMed
    1. Zhang Y, Reif G, Wallace DP. Extracellular matrix, integrins, and focal adhesion signaling in polycystic kidney disease. Cell. Signal. 2020;72:109646. doi: 10.1016/j.cellsig.2020.109646. - DOI - PMC - PubMed

Publication types

MeSH terms

Substances