. 2024 May 1;15(5):306.
doi: 10.1038/s41419-024-06690-x.

Impact of the thyroid hormone T3 and its nuclear receptor TRα1 on colon cancer stem cell phenotypes and response to chemotherapies

Affiliations

Impact of the thyroid hormone T3 and its nuclear receptor TRα1 on colon cancer stem cell phenotypes and response to chemotherapies

Maria Virginia Giolito et al. Cell Death Dis. .

Abstract

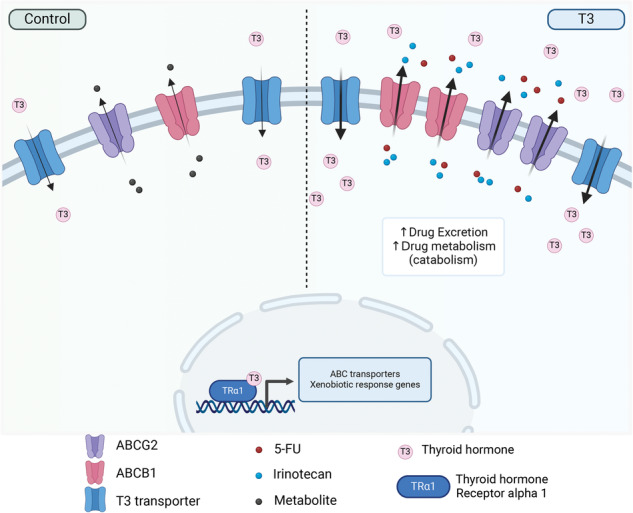
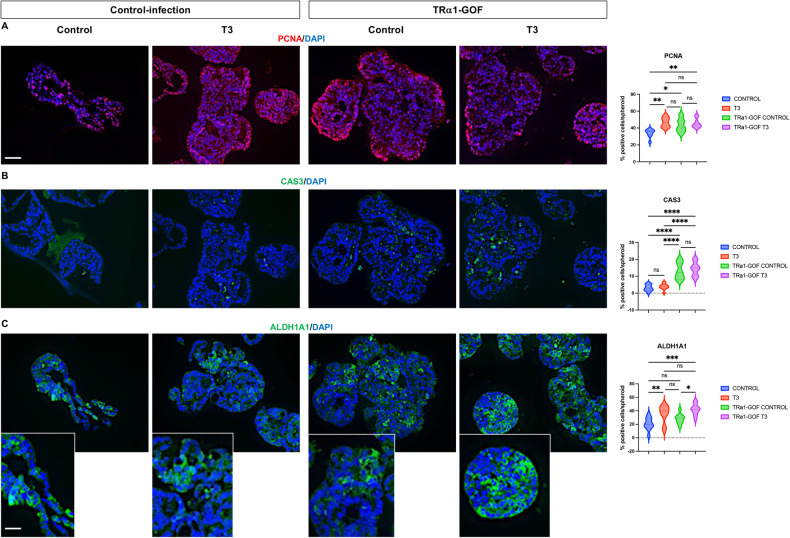
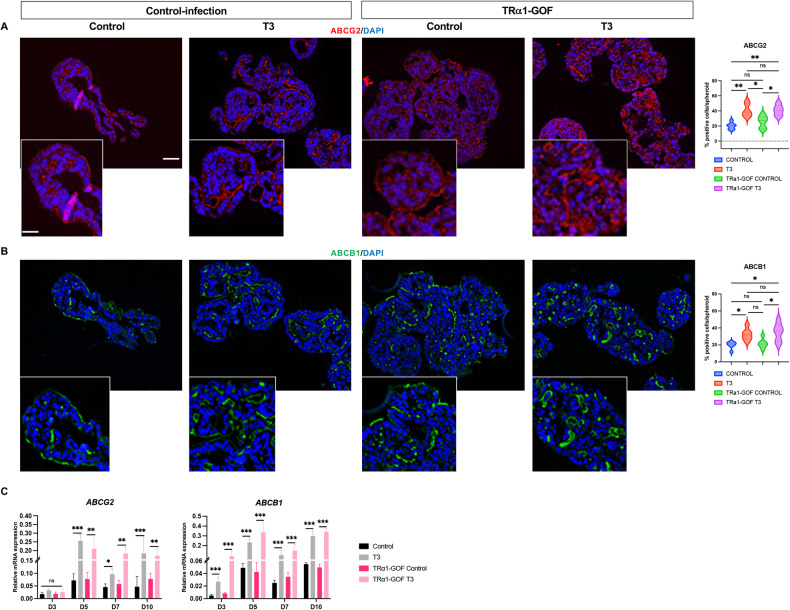
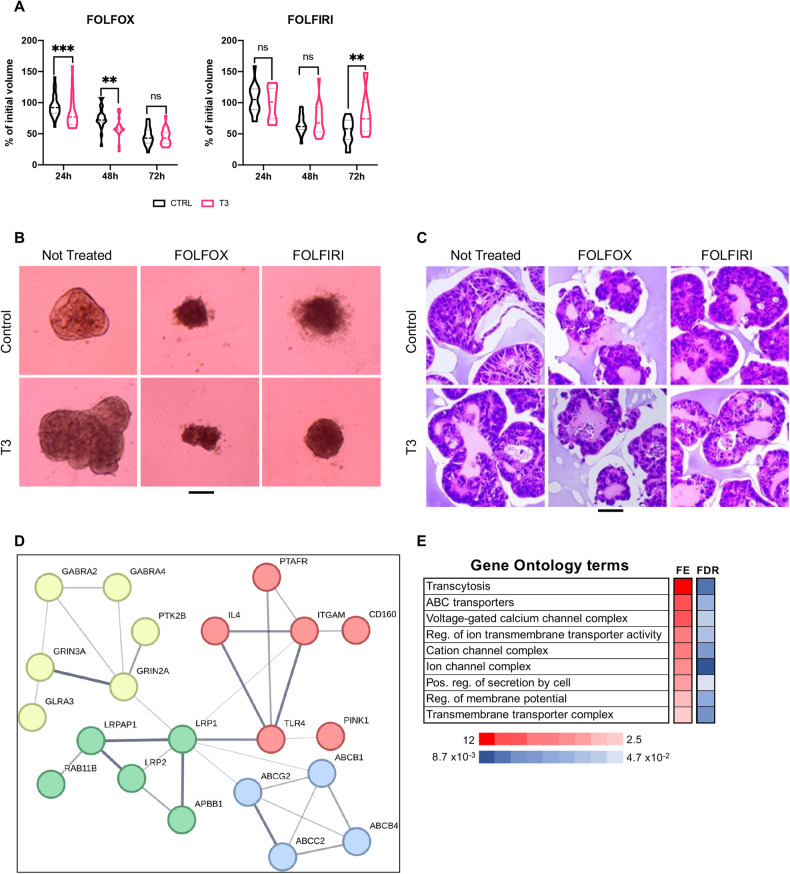
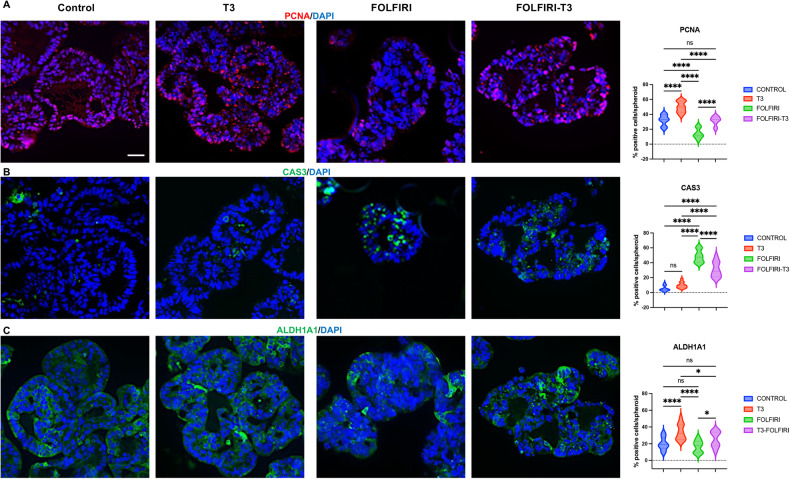
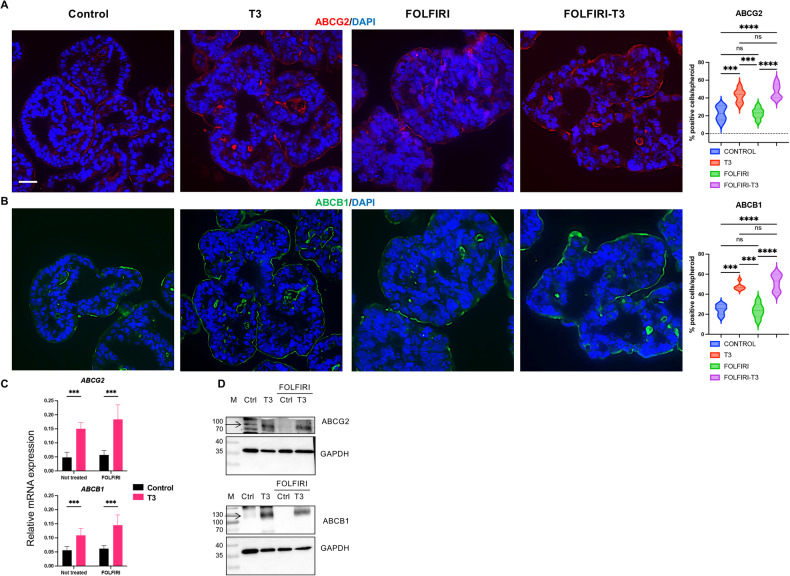
Colorectal cancers (CRCs) are highly heterogeneous and show a hierarchical organization, with cancer stem cells (CSCs) responsible for tumor development, maintenance, and drug resistance. Our previous studies showed the importance of thyroid hormone-dependent signaling on intestinal tumor development and progression through action on stem cells. These results have a translational value, given that the thyroid hormone nuclear receptor TRα1 is upregulated in human CRCs, including in the molecular subtypes associated with CSC features. We used an established spheroid model generated from the human colon adenocarcinoma cell line Caco2 to study the effects of T3 and TRα1 on spheroid formation, growth, and response to conventional chemotherapies. Our results show that T3 treatment and/or increased TRα1 expression in spheroids impaired the response to FOLFIRI and conferred a survival advantage. This was achieved by stimulating drug detoxification pathways and increasing ALDH1A1-expressing cells, including CSCs, within spheroids. These results suggest that clinical evaluation of the thyroid axis and assessing TRα1 levels in CRCs could help to select optimal therapeutic regimens for patients with CRC. Proposed mechanism of action of T3/TRα1 in colon cancer spheroids. In the control condition, TRα1 participates in maintaining homeostatic cell conditions. The presence of T3 in the culture medium activates TRα1 action on target genes, including the drug efflux pumps ABCG2 and ABCB1. In the case of chemotherapy FOLFIRI, the increased expression of ABC transcripts and proteins induced by T3 treatment is responsible for the augmented efflux of 5-FU and Irinotecan from the cancer cells. Taken together, these mechanisms contribute to the decreased efficacy of the chemotherapy and allow cells to escape the treatment. Created with BioRender.com .


Conflict of interest statement

The authors declare no competing interests.

Figures

None
Proposed mechanism of action of T3/TRα1 in colon cancer spheroids. In the control condition, TRα1 participates in maintaining homeostatic cell conditions. The presence of T3 in the culture medium activates TRα1 action on target genes, including the drug efflux pumps ABCG2 and ABCB1. In the case of chemotherapy FOLFIRI, the increased expression of ABC transcripts and proteins induced by T3 treatment is responsible for the augmented efflux of 5-FU and Irinotecan from the cancer cells. Taken together, these mechanisms contribute to the decreased efficacy of the chemotherapy and allow cells to escape the treatment. Created with BioRender.com.
Fig. 1
Fig. 1. Effects of T3 on spheroid formation and growth.
A Upper panel. Scheme of the experimental set-up and timeline. Lower panel. Representative pictures at each time point of spheroid cultures in different conditions as indicated. Images were taken under a Zeiss AxioVert microscope with a 4X objective. Scale bar: 200 μm. B Estimated volume of the spheroids in the different culture conditions at different time points, as indicated. Violin plots show the frequency distribution of the data; bold dotted lines indicate the median and light dotted lines indicate the quartiles, n = 16. Black spheres indicate the size of individual spheroids. **P < 0.01 and ***P < 0.001 compared to control (CTRL) condition, by multiple unpaired, two-tailed Student t-test. Results are representative of two independent experiments. C H&E staining of paraffin sections. Representative images of spheroids at the indicated time points after harvesting. Scale bar: low magnification: 100 μm; high magnifications: 50 μm. D, E Results of comparative RNA-seq transcription profile analyses of spheroids treated with T3 for 24 h during spheroid formation. Heat map (D) shows the 20 most upregulated or downregulated genes in T3 vs. control condition. E Selected genes differentially expressed between conditions.
Fig. 2
Fig. 2. Characterization of T3-treated spheroids by immunolabeling.
Immunostaining of spheroids at D7 for markers of proliferation: PCNA (A), cell death, Activated-caspase 3 (CAS3) (B), and CSC-like ALDH1A1 (C) in different conditions. Left panels: merging between each specific labeling and DAPI (nuclei, blue). Results shown are representative of at least 3 independent experiments. Images were taken with a 20× objective under a Zeiss AxioImager M2 Apotome 2 microscope. Scale bar: low magnification 50 μm, high magnification 25 μm. Right panels: percentage of positive cells per organoid for each marker in the different conditions. Violin plots show the frequency distribution of the data. Bold dotted lines indicate the median, and light dotted lines indicate the quartiles. n = 10 spheroids per marker and condition. ns not significant and **P < 0.01 compared to the control condition, by unpaired, two-tailed Student t-test. Number of cells scored: PCNA and CAS3, Control 726 and T3 1273; ALDH1A1, Control 432 and T3 1506.
Fig. 3
Fig. 3. Expression of ABCG2 and ABCB1 is upregulated in T3-treated spheroids.
Immunostaining of spheroids at D7 for the ABC transporters ABCG2 (A) or ABCB1 (B) in different conditions. Left panels: merging between each specific labeling and DAPI (nuclei, blue). Images are representative of at least 3 independent experiments and were taken with a 20× objective under a Zeiss Axio Imager M2 Apotome 2 microscope. Scale bar: low magnification 50 μm, high magnification 25 μm. Right panels: percentage of positive cells per spheroid for each marker in the different conditions. Violin plots show the frequency distribution of the data. Bold dotted lines indicate the median, and light dotted lines indicate the quartiles. n = 10 spheroids per marker and condition. **P < 0.01 compared to the control condition, by unpaired, two-tailed Student t-test. Number of cells scored: ABCG2, Control 343 and T3 1313; ABCB1, Control 414 and T3 1034. C Results of RT-qPCR to analyze the mRNA levels of ABCG2 and ABCB1 in spheroid cultures at different time points in the different conditions. Histograms represent mean ± SD, N = 6, after normalization with PPIB. *P < 0.05, **P < 0.01, and ***P < 0.001 compared to the control condition by multiple, two-tailed unpaired Student t-test. Results are representative of two independent experiments.
Fig. 4
Fig. 4. Impact of TRα1 overexpression in spheroids.
Immunostaining of spheroids at D7 for markers of: proliferation, PCNA (A), cell death, Activated-caspase 3 (CAS3) (B), and CSC-like, ALDH1A1 (C) in infection-control or TRα1-GOF conditions. Left panels: merging between each specific labeling and DAPI (nuclei, blue). Images are representative of at least 3 independent experiments and were taken with a 20× objective under a Zeiss AxioImager M2 Apotome 2 microscope. Scale bar: low magnification 50 μm, high magnification 25 μm. Right panels: percentages of positive cells per organoid for each marker in the different conditions. Violin plots show the frequency distribution of the data. Bold dotted lines indicate the median, and light dotted lines indicate the quartiles. n = 10 spheroids per marker and condition. ns: not significant, *P < 0.05, **P < 0.01, ***P < 0.001 and ****P < 0.0001 in the indicated comparisons by 2-way ANOVA. Number of cells scored: PCNA, Control 551, T3 1179, TRα1-GOF Control 802, TRα1-GOF T3 1089; CAS3, Control 773, T3 1194, TRα1-GOF Control 802, TRα1-GOF T3 1064; ALDH1A1, Control 450, T3 725, TRα1-GOF Control 803, TRα1-GOF T3 930.
Fig. 5
Fig. 5. Expression of ABCG2 and ABCB1 in TRα1-GOF spheroids.
Immunostaining of spheroids at D7 for the ABC transporters ABCG2 (A) or ABCB1 (B) in different conditions. Left panels: images show the merging between each specific labeling and DAPI (nuclei, blue) and are representative of at least 3 independent experiments. Images were taken with a 20× objective under a Zeiss AxioImager M2 Apotome 2 microscope. Scale bar: low magnification 50 μm, high magnification 25 μm. Right panels: percentage of positive cells per spheroid for each marker in the different conditions. Violin plots show the frequency distribution of the data. Bold dotted lines indicate the median, and light dotted lines indicate the quartiles. n = 10 spheroids per marker and condition. ns not significant, *P < 0.05 and ***P < 0.01 compared to the control condition, by 2-way ANOVA. Number of cells scored: ABCG2, Control 444, T3 448, TRα1-GOF Control 563, TRα1-GOF T3 556; ABCB1, Control 416, T3 388, TRα1-GOF Control 512, TRα1-GOF T3 453. C RT-qPCR results showing mRNA levels of ABCG2 and ABCB1 in spheroid cultures at different time points in the different conditions. Histograms represent mean ± SD, N = 6, after normalization with PPIB. ns: non-significant, *P < 0.05, **P < 0.01, and ***P < 0.001 in the indicated comparisons by 2-way ANOVA. Results are representative of two independent experiments.
Fig. 6
Fig. 6. Effects of anticancer regimens in control and T3 spheroids.
A Changes in volume of spheroids shown as the percentage of initial volumes at the indicated time points after drug treatments. Violin plots show the frequency distribution of the data. Bold dotted lines indicate the median and light dotted lines indicate the quartiles, n = 12. ns non-significant, **P < 0.01 and ***P < 0.001 compared to the respective control conditions by multiple unpaired, two-tailed Student t-test. Results are representative of two independent experiments. B Morphologic features of the spheroid cultures in the different conditions. Images were taken under a Zeiss AxioVert microscope with a 4X objective. Scale bar: 200 μm. C H&E staining of paraffin sections. Representative images of the control and T3 spheroids untreated or after 72 h of FOLFOX or FOLFIRI treatments. Images were taken using a Zeiss AxioImager with a 20X objective. Scale bar: 50 μm. Comparative transcription profiles by RNA-seq showing network analysis of unique upregulated genes in T3-FOLFIRI condition (D) and GO analysis (E). Note the presence of several ion channels and ABC drug transporters.
Fig. 7
Fig. 7. Effects of T3 plus FOLFIRI treatments in spheroids.
Immunostaining of spheroids in the control and T3 groups and then after 72 h with or without FOLFIRI. Markers of: proliferation, PCNA (A), cell death, Activated-caspase 3 (CAS3) (B), and CSC-like ALDH1A1 (C) were analyzed. Left panels: merging between each specific labeling and DAPI (nuclei, blue) representative of at least 3 independent experiments. Images were taken with a 20× objective under a Zeiss AxioImager M2 Apotome 2 microscope. Scale bar: 50 μm. Right panels: percentage of positive cells per organoid for each marker in the different conditions. Violin plots show the frequency distribution of the data. Bold dotted lines indicate the median and light dotted lines indicate the quartiles. n = 10 spheroids per marker and condition. ns: not significant, *P < 0.05 and ****P < 0.0001 in the indicated comparisons by 2-way ANOVA. Number of cells scored: PCNA, Control 741, T3 581, FOLFIRI 384, FOLFIRI T3 423; CAS3, Control 721, T3 576, FOLFIRI 379, FOLFIRI T3 423; ALDH1A1, Control 617, T3 532, FOLFIRI 467, FOLFIRI T3 390.
Fig. 8
Fig. 8. T3 stimulates the expression of ABCG2 and ABCB1 in FOLFIRI-treated condition.
A, B Immunostaining of spheroids in the control and T3 groups and then after 72 h with or without FOLFIRI. ABC transporters ABCG2 (A) or ABCB1 (B) were analyzed in different conditions. Left panels: images show the merging between each specific labeling and DAPI (nuclei, blue) and are representative of at least 3 independent experiments. Images were taken with a 20X objective under a Zeiss Axio Imager M2 Apotome 2 microscope. Scale bar: 50 μm. Right panels: percentage of positive cells per spheroid for each marker in the different conditions. Violin plots show the frequency distribution of the data. Bold dotted lines indicate the median, and light dotted lines indicate the quartiles. n = 10 spheroids per marker and condition. ns not significant, ***P < 0.001 and ****P < 0.0001 compared to the control condition, by 2-way ANOVA. Number of cells scored: ABCG2, Control 403, T3 336, FOLFIRI 286, FOLFIRI T3 251; ABCB1, Control 458, T3 340, FOLFIRI 301, FOLFIRI T3 273. C Results of RT-qPCR experiments showing expression levels of ABCG2 and ABCB1 mRNAs in different conditions. Histograms represent mean ± SD, N = 6, after normalization with PPIB. ***P < 0.001 in the indicated comparisons by 2-way ANOVA. Data are representative of two independent experiments. D Western blot analysis of ABCG2 and ABCB1 in spheroids maintained in the different conditions. GAPDH was used as the loading control. Data are representative of two independent experiments. Arrows in ABCG2 and ABCB1 blots indicate the specific bands.

References

    1. Sung H, Ferlay J, Siegel RL, Laversanne M, Soerjomataram I, Jemal A, et al. Global Cancer Statistics 2020: GLOBOCAN estimates of incidence and mortality worldwide for 36 cancers in 185 countries. CA A Cancer J Clin. 2021;71:209–49. doi: 10.3322/caac.21660. - DOI - PubMed
    1. Fearon ER, Vogelstein B. A genetic model for colorectal tumorigenesis. Cell. 1990;61:759–67. doi: 10.1016/0092-8674(90)90186-I. - DOI - PubMed
    1. Rao CV, Yamada HY. Genomic instability and colon carcinogenesis: from the perspective of genes. Front Oncol. 2013;3:130. doi: 10.3389/fonc.2013.00130. - DOI - PMC - PubMed
    1. Fearon ER. Molecular genetics of colorectal cancer. Annu Rev Pathol Mech Dis. 2011;6:479–507. doi: 10.1146/annurev-pathol-011110-130235. - DOI - PubMed
    1. Hanahan D. Hallmarks of cancer: new dimensions. Cancer Discov. 2022;12:31–46. doi: 10.1158/2159-8290.CD-21-1059. - DOI - PubMed

Publication types

MeSH terms

Substances

Supplementary concepts