. 2024 May 1;15(5):308.
doi: 10.1038/s41419-024-06703-9.

Modeling acute myocardial infarction and cardiac fibrosis using human induced pluripotent stem cell-derived multi-cellular heart organoids

Affiliations

Modeling acute myocardial infarction and cardiac fibrosis using human induced pluripotent stem cell-derived multi-cellular heart organoids

Myeongjin Song et al. Cell Death Dis. .

Abstract

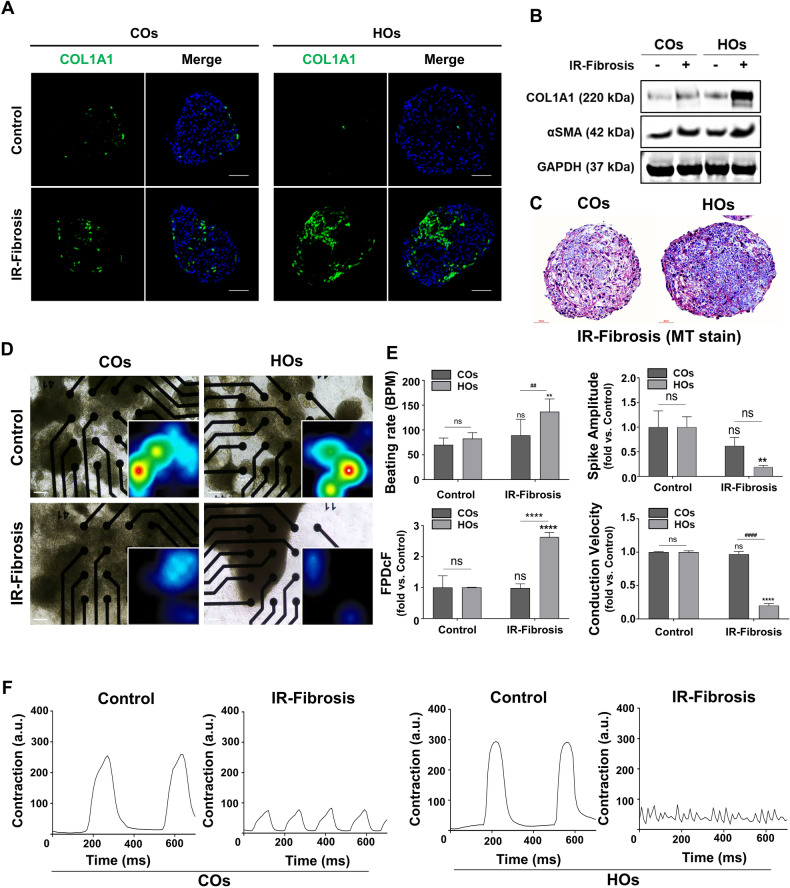
Heart disease involves irreversible myocardial injury that leads to high morbidity and mortality rates. Numerous cell-based cardiac in vitro models have been proposed as complementary approaches to non-clinical animal research. However, most of these approaches struggle to accurately replicate adult human heart conditions, such as myocardial infarction and ventricular remodeling pathology. The intricate interplay between various cell types within the adult heart, including cardiomyocytes, fibroblasts, and endothelial cells, contributes to the complexity of most heart diseases. Consequently, the mechanisms behind heart disease induction cannot be attributed to a single-cell type. Thus, the use of multi-cellular models becomes essential for creating clinically relevant in vitro cell models. This study focuses on generating self-organizing heart organoids (HOs) using human-induced pluripotent stem cells (hiPSCs). These organoids consist of cardiomyocytes, fibroblasts, and endothelial cells, mimicking the cellular composition of the human heart. The multi-cellular composition of HOs was confirmed through various techniques, including immunohistochemistry, flow cytometry, q-PCR, and single-cell RNA sequencing. Subsequently, HOs were subjected to hypoxia-induced ischemia and ischemia-reperfusion (IR) injuries within controlled culture conditions. The resulting phenotypes resembled those of acute myocardial infarction (AMI), characterized by cardiac cell death, biomarker secretion, functional deficits, alterations in calcium ion handling, and changes in beating properties. Additionally, the HOs subjected to IR efficiently exhibited cardiac fibrosis, displaying collagen deposition, disrupted calcium ion handling, and electrophysiological anomalies that emulate heart disease. These findings hold significant implications for the advancement of in vivo-like 3D heart and disease modeling. These disease models present a promising alternative to animal experimentation for studying cardiac diseases, and they also serve as a platform for drug screening to identify potential therapeutic targets.


Conflict of interest statement

The authors declare no competing interests.

Figures

Fig. 1
Fig. 1. Generation of hiPSC-derived cardiac organoids (COs) and heart organoids (HOs).
A Overall schematic diagram of differentiation from hiPSC into COs and HOs. B Comparison of beating efficiency of COs and HOs at day 8–30 of differentiation. C The morphology of COs and HOs for 30 days, including the differentiation period.
Fig. 2
Fig. 2. Phenotypical comparison of iPSC-derived COs and HOs.
A Representative pie chart showing the distribution of cTnT, a cardiomyocyte (CM)-specific marker, CD90, a cardiac fibroblast (CF)-specific marker, and VE-Cad, an endothelial cell (EC)-specific marker, in CO and HO. B The graph displays the mean cellular compositions of cardiomyocytes, fibroblasts, and endothelial cells across 11 different batches of COs and HOs. C Representative z-stack image of HOs and COs using confocal microscopy (left). Staining for cTnT (green) and VE-cad (red) in 2D monolayer culture of cells dissociated from HOs and COs (right). Scale bar: 100 μm. D Z-stack image of co-staining for Vimentin (fibroblast marker, green), α-actinin (cardiomyocyte marker, red), and DAPI (blue) in COs and HOs. Scale bar: 100 μm. E Comparison of the gene expression levels for various cell types in COs and HOs. Quantitative analysis of gene expression levels as performed with real-time PCR. The expression levels of cardiomyocyte markers (NKX2.5, TNNT2, MYL2, and MYL7), endothelial cell markers (CD34, PECAM1, SOX17, and FOXA2), fibroblast markers (CD90, PDGFRα, Vimentin, and TCF21) normalized to that of GAPDH. Data were shown as fold-change relative to COs, as mean ± SD, by 2-way ANOVA (n = 3). A significant difference is indicated by #p < 0.05, ##p < 0.01, ###p < 0.001, ####p < 0.0001 compared with COs and ns (non-significant).
Fig. 3
Fig. 3. Single-cell RNA-sequencing analysis of COs and HOs.
A Uniform manifold approximation and projection (UMAP) plots of HOs. Winseurat data sets labeled with Winseurat clusters. Detailed clustering within CMs (pink), CFs (green), and ECs (purple) clusters. BD Violin plots of representative genes for CMs (MYL2, MYL7, MYH7, TNNC1, MYBPC3, and CACNA1C), ECs (APOLD1, GIMAP4, PECAM1, PRSS23, STC1, and VEGFC), and CFs (AGT, CLU, and HMGA1). These genes were selected fold-change about 2-fold, average expression about 4 or more, and p-value 0.05 or less.
Fig. 4
Fig. 4. Induction of ischemic injury and ischemic-reperfusion injury in COs and HOs.
A Schematic of an experiment mimicking the heart disease in organoids by ischemia-reperfusion injury mechanism that occurs in the human adult heart and followed fibrogenesis. B Expression of the HIF-1α through western blots. Quantitative analysis of HIF-1α performed using Image J software. The expression of HIF-1α normalized to that of GAPDH. Data were shown as fold-change, and a significant difference is indicated by ****, ####p < 0.0001, and ns (non-significant). C Immunofluorescence images of the expression levels of apoptotic marker (cleaved caspase-3, green) and cardiomyocyte marker (cTnT, red) in COs and HOs after IR injury. The scale bar represents 100 μm. D Representative western blot image and quantitative analysis of cleaved caspase-3. Data normalized to that of caspase-3. Equal protein loading amounts were confirmed by GAPDH expression. The corresponding density ratio was calculated by the average intensity of the bands from Image J software. Data were shown as fold-change, and a significant difference is indicated by ****, ####p < 0.0001 and ns (non-significant). E Representative image and quantitative analysis of TUNEL assay (green). Data were shown as fold-change, as mean ± SD, by 2-way ANOVA (n = 3). Significant difference is indicated by #p < 0.05, ***p < 0.001, ****, ####p < 0.0001 (*compared to control group; #compared to COs), and ns (non-significant). The scale bar represents 100 μm.
Fig. 5
Fig. 5. IR-induced acute myocardial infarction (AMI) in COs and HOs.
A Immunofluorescence images of the expression levels of sarcomeric α-actinin and DAPI in the control and IR groups. White dotted line in IR-induced HOs indicates the disintegrated sarcomere structure in the organoids. The scale bar represents 100 μm and magnified image scale bar represents 20 μm. B Western blot analysis in cell lysates from COs and HOs in control and IR groups. The protein expression of cTnT and cTnI, which are essential for cardiac structure was calculated by the average intensity of the bands from Image J software. The comparison of the fold change between the COs and HOs was normalized by the control group. C Extracellular secretion levels of cTnI, myoglobin (MB), and creatine kinase M type (CKM), which AMI indicators in control and IR group during culture periods. Secretion of cTnI, MB, and CKM was measured by ELISA. All data were shown as mean ± SD by 2-way ANOVA (n = 3). Significant difference is indicated by ***, ###p < 0.001, ****, ####p < 0.0001(*compared to control group; #compared to COs), and ns (non-significant).
Fig. 6
Fig. 6. Calcium overload and defects in calcium handling after IR injury.
A Representative trace of calcium transient in COs and HOs before and after IR injury. control and IR groups. B Basal and peak Ca2+ concentrations were measured using calcium imaging. All data were shown as mean ± SD by 2-way ANOVA (n = 18–20). A significant difference in all graphs are indicated by *, #p < 0.05, **, ##p < 0.01, ***, ###p < 0.001, ****, ####p < 0.0001 (*compared to control group; #compared to COs), and ns (non-significant). C The SERCA rate constant, reflecting the activity of SERCA, was calculated by subtracting the reciprocal of the time constant measured after inhibiting SERCA from the reciprocal of the time constant measured in the transient. All data were shown as mean ± SD by 2-way ANOVA (n = 18–20). A significant difference in all graphs are indicated by *, #p < 0.05, **, ##p < 0.01, ***, ###p < 0.001, ****, ####p < 0.0001 (*compared to control group; #compared to COs), and ns (non-significant). D Western blot analysis of phospholamban and phosphorylated phospholamban in COs and HOs before and after IR injury. Quantitative analysis of all western blot data was calculated by the average intensity of the bands in Image J software. Equal protein loading amounts of western blot data were confirmed by GAPDH expression. A significant difference of all graphs is indicated by #,*p < 0.05, ##,**p < 0.01 ###,***p < 0.001, ####,****p < 0.0001(*Compared to control group; #compared to COs), and ns (non-significant). E Representative immunofluorescence images of MPTP opening (calcein, green) in control and IR groups. The scale bar represents 200 μm. F MPTP opening (calcein) ratio in each group was calculated by image J software. This data was normalized to the control of COs. G Beating characteristics of COs and HOs in IR and control groups. Beating analysis was performed by monitoring calcium fluorescence over a period of 20 s under control and IR conditions. A comparison of BPM (beat per minute), peak-to-peak duration, and time-to-peak was performed on COs and HOs in each group. All data were shown as mean ± SD by 2-way ANOVA (n = 3). A significant difference in all graphs is indicated by **, ##p < 0.01, ***, ###p < 0.001, ****, ####p < 0.0001 (*compared to the control group; #compared to COs), and ns (non-significant). H Schematic summary of findings in (AF).
Fig. 7
Fig. 7. Fibrosis induction and functional defects in AMI-organoids.
A Representative immunofluorescence images of COL1A1 (green) and DAPI (blue) in each group. The scale bar represents 100 μm. B The protein expression of COL1A1 and α-SMA, which are fibroblast activation and fibrosis indicators using western blot in cell lysates from COs and HOs in each group. Equal protein loading amounts were confirmed by GAPDH expression. C The morphologies of the IR-Fibrosis organoid by Masson’s Trichrome staining. The scale bar represents 40 μm. D Evaluation of the electrophysiological function of COs and HOs on the electrode of the MEA plate in each group. Magnified image to show a heatmap of a representative MEA recording. The spike activity of each active electrode is color-coded: white/red represents high spike activity; blue/black represents low spike activity. E Beating rate (BPM), Spike amplitude, FPDcF, and conduction velocity of COs and HOs in each group through MEA recording. All data were shown as fold-change, as mean ± SD, by 2-way ANOVA (n = 3). A significant difference of all graphs is indicated by #,*p < 0.05, ##,**p < 0.01, ###,***p < 0.001, ####,****p < 0.0001(*Compared to control group; #compared to COs) and ns (non-significant). F Comparison of contraction in control COs versus IR-fibrosis COs and control HOs versus IR-fibrosis HOs.
Fig. 8
Fig. 8. Comparison of up-regulated KEGG pathway of control HOs versus IR-injured HOs and control HOs versus IR-fibrosis HOs.
A Visualized graphs of up-regulated KEGG pathways in IR-injured HOs compared to control HOs. B Visualized graphs of up-regulated KEGG pathways in IR-fibrosis HOs compared to control HOs. The pathways were selected based on criteria including a fold change >2 and a p-value less than 0.05.

References

    1. Zhao Z, Chen X, Dowbaj AM, Sljukic A, Bratlie K, Lin L, et al. Organoids. Nat Rev Methods Primers. 2022;2:94.. doi: 10.1038/s43586-022-00174-y. - DOI - PMC - PubMed
    1. Fan C, He J, Xu S, Yan J, Jin L, Dai J, Hu B. Advances in biomaterial-based cardiac organoids. Biomater Adv. 2023;153:213502. doi: 10.1016/j.bioadv.2023.213502. - DOI - PubMed
    1. Correia CD, Ferreira A, Fernandes MT, Silva BM, Esteves F, Leitao HS, et al. Human stem cells for cardiac disease modeling and preclinical and clinical applications—are we on the road to success? Cells. 2023;12:1727. doi: 10.3390/cells12131727. - DOI - PMC - PubMed
    1. Vunjak-Novakovic G. Cardiac biology: a protein for healing infarcted hearts. Nature. 2015;525:461–2. doi: 10.1038/nature15217. - DOI - PubMed
    1. Arslan U, Brescia M, Meraviglia V, Nahon DM, van Helden RWJ, Stein JM, et al. Vascularized hiPSC-derived 3D cardiac microtissue on chip. Stem Cell Rep. 2023;18:1394–404. doi: 10.1016/j.stemcr.2023.06.001. - DOI - PMC - PubMed

Publication types