. 2024 Apr 30;15(1):3669.
doi: 10.1038/s41467-024-48032-7.

Fn-OMV potentiates ZBP1-mediated PANoptosis triggered by oncolytic HSV-1 to fuel antitumor immunity

Affiliations

Fn-OMV potentiates ZBP1-mediated PANoptosis triggered by oncolytic HSV-1 to fuel antitumor immunity

Shuo Wang et al. Nat Commun. .

Abstract

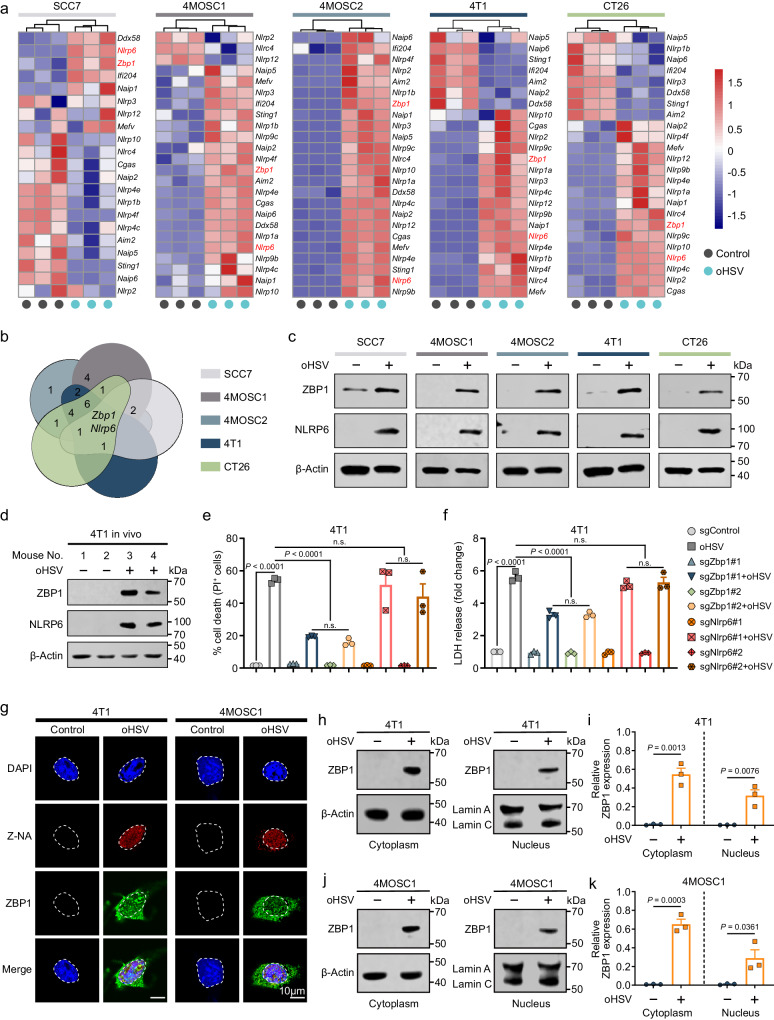
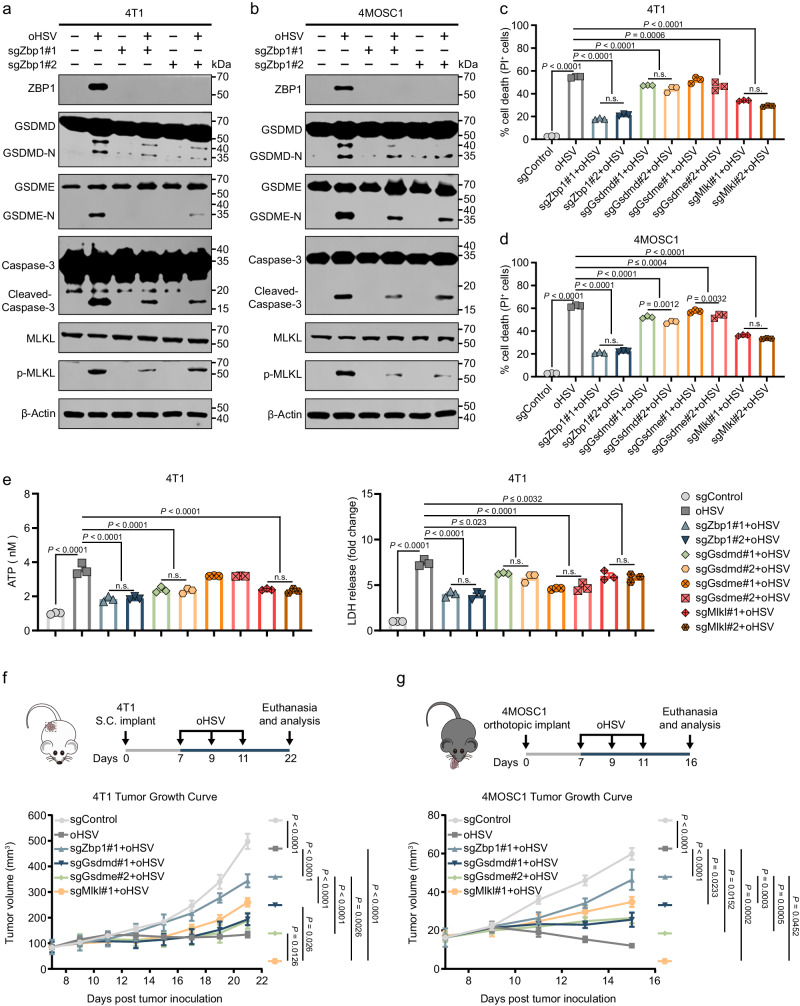
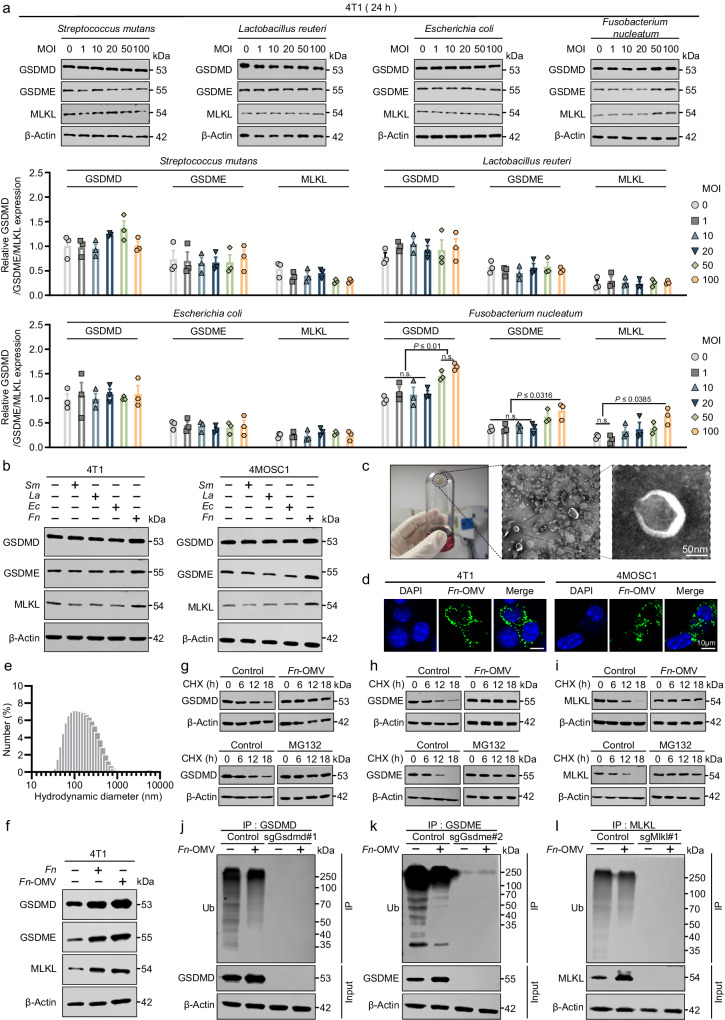
Oncolytic viruses (OVs) show promise as a cancer treatment by selectively replicating in tumor cells and promoting antitumor immunity. However, the current immunogenicity induced by OVs for tumor treatment is relatively weak, necessitating a thorough investigation of the mechanisms underlying its induction of antitumor immunity. Here, we show that HSV-1-based OVs (oHSVs) trigger ZBP1-mediated PANoptosis (a unique innate immune inflammatory cell death modality), resulting in augmented antitumor immune effects. Mechanistically, oHSV enhances the expression of interferon-stimulated genes, leading to the accumulation of endogenous Z-RNA and subsequent activation of ZBP1. To further enhance the antitumor potential of oHSV, we conduct a screening and identify Fusobacterium nucleatum outer membrane vesicle (Fn-OMV) that can increase the expression of PANoptosis execution proteins. The combination of Fn-OMV and oHSV demonstrates potent antitumor immunogenicity. Taken together, our study provides a deeper understanding of oHSV-induced antitumor immunity, and demonstrates a promising strategy that combines oHSV with Fn-OMV.


Conflict of interest statement

The authors declare no competing interests.

Figures

Fig. 1
Fig. 1. oHSV induces ZBP1-mediated tumor cell death.
Heatmap showing the expression of signature genes related to inflammasomes and certain key innate sensor-related genes in five types of tumor cells infected with oHSV (MOI = 1, 24 h) (a) and Venn diagram showed the increased gene intersections of five types of tumor cells infected with oHSV. Specifically, the two genes in the center indicate that two genes, Zbp1 and Nlrp6, are commonly upregulated in all five cell lines infected with oHSV (b). c Five types of tumor cells were infected with oHSV (MOI = 1, 24 h), and cellular protein was analyzed by western blotting to detect the expression level of ZBP1 and NLRP6. Western blotting was done thrice independently with similar results. d oHSV-treated or untreated 4T1 tumor tissue lysates were analyzed of the expression of ZBP1 and NLRP6 by western blotting. Western blotting was done thrice independently with similar results. e Effect of ZBP1 and NLRP6 expression on relative cell viability in the 4T1 cells treated with oHSV (MOI = 1, 24 h). n.s. not significant. f The effect of ZBP1 and NLRP6 expression on the injury of 4T1 cells after oHSV (MOI = 1, 24 h) treatment was detected by LDH release assay. n.s. not significant. g The expression of Z-NA and ZBP1 in tumor cells after oHSV (MOI = 1, 24 h) treatment was evaluated using a Confocal Laser Scanning Microscope. Scale bars = 10 μm. h, i Western blotting analysis assessing ZBP1 expression in the cytoplasm and nucleus of 4T1 cells with or without oHSV treatment (MOI = 1, 24 h). Western blotting was done thrice independently with similar results. j, k Western blotting analysis assessing ZBP1 expression in the cytoplasm and nucleus of 4MOSC1 cells with or without oHSV treatment (MOI = 1, 24 h). Western blotting was done thrice independently with similar results. n  =  3 independent experiments for a, e, f. Statistical significance was determined using two-tailed Student’s t test in e, f, i, k. Data represent the mean ± s.e.m. Scale bar, 10 μm. Source data are provided in the Source Data file.
Fig. 2
Fig. 2. oHSV upregulates ZBP1 by inducing the accumulation of Z-RNA.
a Heatmap showing the expression of signature genes related to ISG mRNA in oHSV-treated (MOI = 1, 24 h) 4T1 (left) and 4MOSC1 (right) cells. b Heatmap indicated the expression of signature genes related to ISG mRNA with high editing indices in oHSV-treated (MOI = 1, 24 h) 4T1 (left) and 4MOSC1 (right) cells. c Heatmap demonstrated the influence of the expression of ISG mRNA with high editing indices on oHSV-treated (MOI = 1, 24 h) 4T1 cells after IFNAR-1 blockade. d 4T1 cells were infected with oHSV (MOI = 1, 24 h) and IFNAR-1 blockade, the cellular protein was analyzed by western blotting to detect the expression level of ZBP1. Western blotting was done thrice independently with similar results. e The expression of Z-NA and ZBP1 in 4T1 tumor cells after oHSV (MOI = 1, 24 h) alone and oHSV combined with DNase I (25 UmL−1) treatment was evaluated using a Confocal Laser Scanning Microscope. Scale bars = 10 μm. Data were repeated thrice independently with similar results. f The expression of Z-RNA in tumor cells after oHSV (MOI = 1, 24 h) treatment and IFNAR-1 blockade was evaluated using a Confocal Laser Scanning Microscope. Scale bars = 10 μm. Data were repeated thrice independently with similar results. g Model diagram illustrating the upregulation of ZBP1 by oHSV through the induction of Z-RNA accumulation. The release of LDH (left) and ATP (right) from 4T1 (h) tumor cells after oHSV (MOI = 1, 24 h) treatment and IFNAR-1 blockade. n  =  3 independent experiments for (ac, h). Statistical significance was determined using two-tailed Student’s t test in (h). Data represent the mean ± s.e.m. Scale bar, 10 μm. Source data are provided in the Source Data file.
Fig. 3
Fig. 3. oHSV induces ZBP1-mediated PANoptosis in tumor cells.
4T1 (a) and 4MOSC1 (b) tumor cells were infected with oHSV (MOI = 1) for 24 h, cellular protein was analyzed by western blotting to detect the effect of ZBP1 expression on PANoptosis-related executive proteins. Effect of ZBP1, GSDMD, GSDME, and MLKL expression on relative cell viability in the 4T1 (c) and 4MOSC1 (d) cells treated with oHSV (MOI = 1) for 24 h. Western blotting was done thrice independently with similar results. n.s. not significant. e Effect of ZBP1, GSDMD, GSDME, and MLKL expression on ATP (left) and LDH (right) release in 4T1 tumor cells after oHSV (MOI = 1, 24 h) treatment. n = 3 independent experiments. f Schematic illustration of injection of 4T1 tumor cells and the effect of ZBP1, GSDMD, GSDME, and MLKL expression on 4T1 tumor size after oHSV treatment. n = 5 mice. S.C. = Subcutaneous. g Schematic illustration of injection of 4T1 tumor cells and the effect of ZBP1, GSDMD, GSDME and MLKL expression on 4MOSC1 tumor size after oHSV treatment. n = 5 mice. Statistical significance was determined using two-tailed Student’s t test in (ce) and two-way ANOVA with Tukey’s multiple comparisons test in (f, g). Data represent the mean ± s.e.m. Source data are provided in the Source Data file.
Fig. 4
Fig. 4. Fn-OMV enhances the expression levels of PANoptosis effector proteins.
a 4T1 cells were infected with different bacterial titers (MOI = 0, 1, 10, 20, 50, 100) for 24 h, cellular protein was analyzed by western blotting to detect the expression level of GSDMD, GSDME, and MLKL (upper) and corresponding quantitative analyses (below). Western blotting was done thrice independently with similar results. n.s. not significant. b The protein expression of GSDMD, GSDME, and MLKL was evaluated using western blotting in 4T1 (left) and 4MOSC1 (right) cells treated with different bacterial species. Western blotting was done thrice independently with similar results. n.s. not significant. c Schematic illustration of outer membrane vesicle (OMV) isolation and transmission electron microscopy image of Fn-OMV. Scale bars = 50 μm. Data were repeated thrice independently with similar results. d Confocal Laser Scanning Microscope shows the phagocytosis of Fn-OMV by 4T1 cells and 4MOSC1 cells. Scale bars = 10 μm. Data were repeated thrice independently with similar results. e Hydrodynamic diameter (Dh) of Fn-OMV in PBS at pH 7.4. Data were repeated thrice independently with similar results. f Effect of Fn and its secreted OMV on protein expression of GSDMD, GSDME, and MLKL was evaluated using western blotting in 4T1 cells. Western blotting was done thrice independently with similar results. n.s. not significant. Western blotting analysis was performed to evaluate the protein stability in 4T1 cells of GSDMD (g), GSDME (h), and MLKL (i) upon treatment with Fn-OMV (1 μg ml−1) and MG132 (10 μM) in the presence of 50 μg ml1 cycloheximide (CHX). Immunoprecipitation (IP) and western blotting analysis were performed to examine the ubiquitination and expression of GSDMD (j), GSDME (k), and MLKL (l) in Control and Gsdmd, Gsdme, or Mlkl-depleted 4T1 cells after 24 h of Fn-OMV (1 μg ml1) treatment. Western blotting was done thrice independently with similar results. Statistical significance was determined using one-way ANOVA with Tukey’s multiple comparisons test in (a). Data represent the mean ± s.e.m. Source data are provided in the Source Data file.
Fig. 5
Fig. 5. Fn-OMV and oHSV have great potential for synergistic application.
Evaluation of cell apoptosis by flow cytometry at 24 h in different treatment groups. Representative flow cytometric plots (a) and relative cell viability (b) of different treatment groups are shown in the 4T1 (left) and 4MOSC1 (right) cells. The release of LDH (c) and ATP (d) from 4T1 cells after oHSV (MOI = 1) treatment and Fn-OMV (1 μg ml1) alone or in combination. e Immunofluorescence detection of HMGB1 expressed on 4T1 (left) and 4MOSC1 (right) cells was observed using a Confocal Laser Scanning Microscope. Scale bars, 20 μm. f 4T1 cell culture supernatants were assayed for TNF-α by ELISA after oHSV (MOI = 1) treatment and Fn-OMV (1 μg ml1) alone or in combination. g Heatmap showing the expression of signature genes related to mRNA expression of M1 macrophage markers (upper) and M2 macrophage markers (below) in oHSV treatment and Fn-OMV alone or in combination. h Schematic illustration shows the effect of oHSV and Fn-OMV on the polarization regulation ability of macrophages. Heatmap (i) and bar graphs (j) showing relative mRNA levels of inflammatory-associated genes in M2 macrophages following treatment with oHSV and Fn-OMV alone or in combination. n  =  3 independent experiments for bd, f, g, i, j. Statistical significance was calculated via one-way ANOVA with Tukey’s multiple comparisons test. n.s. not significant. Data represent the mean ± s.e.m. Source data are provided as a Source Data file.
Fig. 6
Fig. 6. Combination of Fn-OMV and oHSV converts “cold” tumors into “hot” tumors.
a Schematic representation of 4T1 (upper) and 4MOSC1 (below) tumor inoculation and treatment with oHSV and Fn-OMV. S.C. = Subcutaneous. b Average 4T1 (left) and 4MOSC1 (right) tumor growth curve depicted as mean ± s.e.m. for each treatment group (n = 5 mice). Statistical significance was evaluated using two-way ANOVA. c Heatmap shows a 17-gene expression profile associated with inflammation produced in mice of different treatment groups. d Immunological profile of TDLNs. This includes the frequency of the lymph nodes CD80+ CD86+ population in CD11c+ cells in 4T1 (left) and 4MOSC1 (right) tumors. e CD8+ T cell populations in the tumors were measured using flow cytometry, and quantitative analyses were performed in 4T1 (left) and 4MOSC1 (right) tumors. f Heatmap shows the expression signature of four selected genes, all highly associated with CD8+ T cell activation, across different treatment groups. g Representative images of immunohistochemical analysis of CD8 and Granzyme B (GZMB) expression in different treatment groups of 4T1 tumors (left) and 4MOSC1 tumors (right), Scale bars, 50 μm. The images of immunostaining (g) were representative of those generated from five mice in each group. h CD86+ macrophages and CD206+ macrophages in the tumors were measured using flow cytometry, and quantitative analyses were performed. i CD25+ and FOXP3+ Treg cell populations in the TDLNs were measured using flow cytometry, and quantitative analyses were performed. j Representative images of immunohistochemical analysis of FOXP3 expression in different treatment groups of 4T1 tumors (upper) and 4MOSC1 tumors (below), Scale bars, 50 μm. The images of immunostaining (j) were representative of those generated from five mice in each group. k A schematic diagram illustrating the transformation of “cold” tumors into “hot” tumors by the combined treatment of oHSV and Fn-OMV. All data are shown as the mean ± s.e.m. n  =  3-5 independent experiments for (cf, h, i). Statistical significance was calculated via one-way ANOVA with Tukey’s multiple comparisons test in (d, e, h, i). n.s. not significant. Source data are provided as a Source Data file.
Fig. 7
Fig. 7. Combination of Fn-OMV and oHSV enhances the effectiveness of anti-PD-L1 immunotherapy and stimulates immune memory.
The expression of CD8 (green), PD-L1 (red), F4/80 (white), and FOXP3 (orange) was observed in 4T1 tumors (a) and 4MOSC1 tumors (b) using multiplex immunohistochemistry (mIHC). Scale bars, 50 μm. The images of mIHC (a, b) were representative of those generated from five mice in each group. c PD-L1 expression on 4T1 cells following combination treatment of oHSV and Fn-OMV was observed using flow cytometry (n = 3 independent experiments). Statistical significance was determined using a two-tailed Student’s t test. d CD44+ and CD62L+ T cell populations in the TDLNs were measured using flow cytometry, and quantitative analyses were performed (n = 5 independent experiments). Statistical significance was calculated via one-way ANOVA with Tukey’s multiple comparisons test. e Experimental schedule for 4T1 tumor inoculation and treatment with oHSV, Fn-OMV, and aPD-L1. f Tumor volume of 4T1 tumor-bearing mice with different treatments (n = 5 mice). S.C. = Subcutaneous. Statistical significance was calculated via two-way ANOVA with Tukey’s multiple comparisons test. g Survival analysis of 4T1 tumor-bearing mice after the different treatments (n = 5 mice). h Schematic of the experimental process for lung metastasis model. i Typical images of lung tissues, HE staining images of metastatic foci in lungs from the different treatment groups. Scale bars, 50 μm. The images of HE staining (i) were representative of those generated from five mice in each group. All data are shown as the mean ± s.e.m. Statistical significance was calculated via one-way ANOVA with Tukey’s multiple comparisons test. n.s. not significant. Source data are provided as a Source Data file.
Fig. 8
Fig. 8. Illustration of the Mechanism of Combined Fn-OMV and oHSV Therapy.
The diagram illustrates the process of oHSV-induced ZBP1-mediated PANoptosis, as well as the enhancement of oHSV-induced ZBP1-mediated PANoptosis by Fn-OMV.

References

    1. Shalhout SZ, Miller DM, Emerick KS, Kaufman HL. Therapy with oncolytic viruses: progress and challenges. Nat. Rev. Clin. Oncol. 2023;20:160–177. doi: 10.1038/s41571-022-00719-w. - DOI - PubMed
    1. Wang G, et al. An engineered oncolytic virus expressing PD-L1 inhibitors activates tumor neoantigen-specific T cell responses. Nat. Commun. 2020;11:1395. doi: 10.1038/s41467-020-15229-5. - DOI - PMC - PubMed
    1. Guo L, et al. Directed natural evolution generates a next-generation oncolytic virus with a high potency and safety profile. Nat. Commun. 2023;14:3410. doi: 10.1038/s41467-023-39156-3. - DOI - PMC - PubMed
    1. Wang S, et al. Oncolytic viruses engineered to enforce cholesterol efflux restore tumor-associated macrophage phagocytosis and anti-tumor immunity in glioblastoma. Nat. Commun. 2023;14:4367. doi: 10.1038/s41467-023-39683-z. - DOI - PMC - PubMed
    1. Azad T, et al. Synthetic virology approaches to improve the safety and efficacy of oncolytic virus therapies. Nat. Commun. 2023;14:3035. doi: 10.1038/s41467-023-38651-x. - DOI - PMC - PubMed

Publication types

Substances

LinkOut - more resources