Case Reports
. 2024 Apr 30;15(1):3664.
doi: 10.1038/s41467-024-47965-3.

Primary prophylaxis with mTOR inhibitor enhances T cell effector function and prevents heart transplant rejection during talimogene laherparepvec therapy of squamous cell carcinoma

Affiliations
Case Reports

Primary prophylaxis with mTOR inhibitor enhances T cell effector function and prevents heart transplant rejection during talimogene laherparepvec therapy of squamous cell carcinoma

Victor Joo et al. Nat Commun. .

Abstract

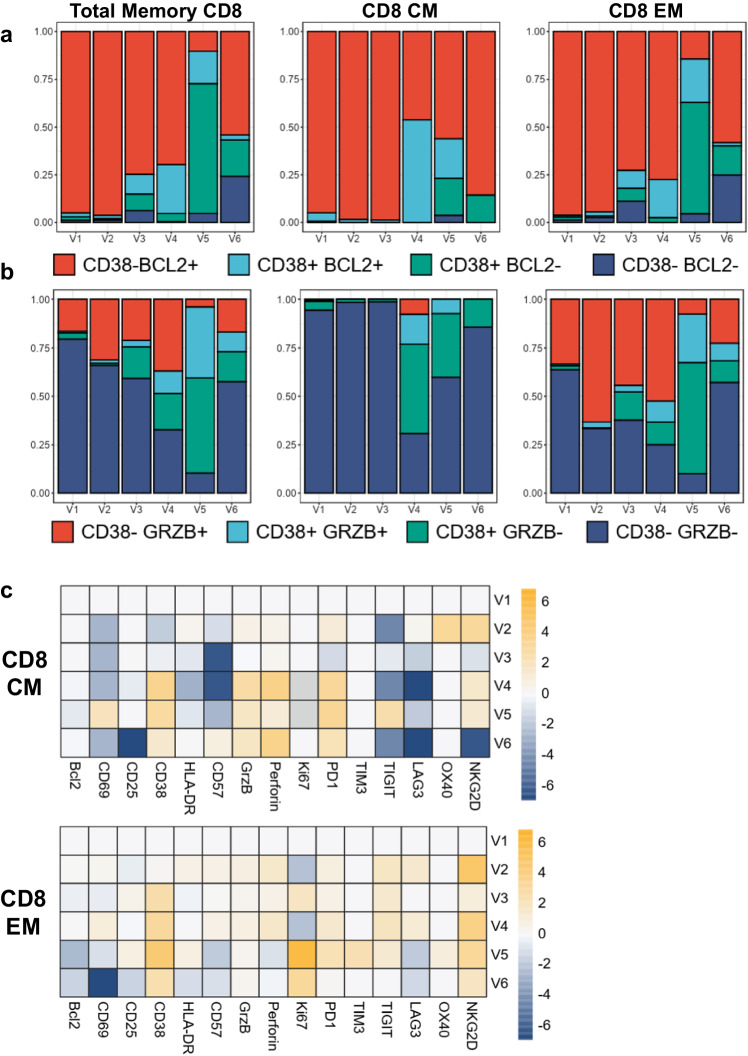
The application of mammalian target of rapamycin inhibition (mTORi) as primary prophylactic therapy to optimize T cell effector function while preserving allograft tolerance remains challenging. Here, we present a comprehensive two-step therapeutic approach in a male patient with metastatic cutaneous squamous cell carcinoma and heart transplantation followed with concomitant longitudinal analysis of systemic immunologic changes. In the first step, calcineurin inhibitor/ mycophenolic acid is replaced by the mTORi everolimus to achieve an improved effector T cell status with increased cytotoxic activity (perforin, granzyme), enhanced proliferation (Ki67) and upregulated activation markers (CD38, CD69). In the second step, talimogene laherparepvec (T-VEC) injection further enhances effector function by switching CD4 and CD8 cells from central memory to effector memory profiles, enhancing Th1 responses, and boosting cytotoxic and proliferative activities. In addition, cytokine release (IL-6, IL-18, sCD25, CCL-2, CCL-4) is enhanced and the frequency of circulating regulatory T cells is increased. Notably, no histologic signs of allograft rejection are observed in consecutive end-myocardial biopsies. These findings provide valuable insights into the dynamics of T cell activation and differentiation and suggest that timely initiation of mTORi-based primary prophylaxis may provide a dual benefit of revitalizing T cell function while maintaining allograft tolerance.


Conflict of interest statement

All authors declare no competing interests.

Figures

Fig. 1
Fig. 1. Timeline and imaging of lesions.
a Patient clinical history and timeline for the establishment of mTOR and T-VEC injection. be PET-CT images showing cSCC lesions (pointed by green arrows) before T-VEC (b, d), decreasing 2 months after T-VEC injections (c, e).
Fig. 2
Fig. 2. Absolute counts and frequencies of immune cell subsets.
a Absolute counts of total CD3, CD4, CD8, B cells (CD19 + ), NK cells (CD56 + ), and monocytes (CD14 + ) over time. Dotted lines represent the minimum and maximum reference range from healthy donors (N = 450). b Absolute counts and frequencies of Tregs (T regulatory cell) (CD4 + CD45RO + CD127- CD25 + ) over time. Gray bar shown as mean ± SD of individual data points corresponds to reference frequencies from healthy donors (HD) (N = 74). c Frequencies of mDC (myeloid dendritic cells) (Lin- CD14- HLA-DR+ CD11c + ) and pDC (plasmacytoid dendritic cells) (Lin- CD14- HLA-DR + CD123 + ) over time. Gray bar shown as mean ± SD of individual data points corresponds to reference frequencies from HD (N = 74).
Fig. 3
Fig. 3. Cytokine and T cell differentiation profiles.
a Differential cytokine expression from baseline compared to post T-VEC injection represented as a heatmap and expressed as log2-fold change compared to V1. Increasing expression represented in orange gradient, no changes shown as white, and decreasing expression shown in blue gradient compared to V1. b Differentiation of CD4 subsets in memory CD4 (T helper cell (Th), T regulatory cell (Treg), central memory (CM), transitional memory (TM), effector memory (EM)) over time represented as a heatmap and expressed as log2-fold change compared to V1. Increasing expression represented in orange gradient, no changes shown as white, and decreasing expression shown in blue gradient compared to V1. c Differentiation of CD8 subsets in memory CD8 (central memory (CM), transitional memory (TM), effector memory (EM), T effector memory CD45RA + (TEMRA)) over time represented as a heatmap and expressed as log2-fold change compared to V1. Increasing expression represented in orange gradient, no changes shown as white, and decreasing expression shown in blue gradient compared to V1. de Expression of activation markers at V1 and V2 vs HD in memory CD4 (d) and in memory CD8 (e). Gray bar shown as mean ± SD of individual data points corresponds to reference frequencies from HD (N = 74).
Fig. 4
Fig. 4. CD4 activation.
a Proportion of CD38/ Bcl-2 expression in CD4 memory, central memory (CM), and effector memory (EM) over time shown as stacked barplots. Red bar represents CD38- Bcl2 + , light blue bar represents CD38+ Bcl2 + , green bar represents CD38+ Bcl2-, dark blue bar represents CD38- Bcl2-. b Activation and co-inhibitory profile of Th1, Th2, and Th17 subsets in memory CD4 over time represented as a heatmap and expressed as log2-fold change compared to V1. Increasing expression represented in orange gradient, no changes shown as white, and decreasing expression shown in blue gradient compared to V1.
Fig. 5
Fig. 5. CD8 activation.
ab, Proportion of CD38/ GrzB expression (a) and CD38/ Bcl-2 expression (b) in CD8 memory, central memory (CM), and effector memory (EM) over time shown as stacked barplots. For (a), red bar represents CD38- Bcl2 + , light blue bar represents CD38+ Bcl2 + , green bar represents CD38+ Bcl2-, dark blue bar represents CD38- Bcl2- and for (b), red bar represents CD38- GrzB + , light blue bar represents CD38+ GrzB + , green bar represents CD38+ GrzB-, dark blue bar represents CD38- GrzB-. c, Activation and co-inhibitory profile of CD8 CM and EM subsets represented as a heatmap and expressed as log2-fold change compared to V1. Increasing expression represented in orange gradient, no changes shown as white, and decreasing expression shown in blue gradient compared to V1.

References

    1. Nguyen TA, Offner M, Hamid O, Zumsteg ZS, Gharavi NM. Complete and Sustained Remission of Metastatic Cutaneous Squamous Cell Carcinoma in a Liver Transplant Patient Treated With Talimogene Laherparepvec. Dermatol. Surg. 2021;47:820–822. doi: 10.1097/DSS.0000000000002739. - DOI - PubMed
    1. Bibee K, et al. Cutaneous squamous cell carcinoma in the organ transplant recipient. Oral. Oncol. 2020;103:104562. doi: 10.1016/j.oraloncology.2019.104562. - DOI - PMC - PubMed
    1. Manyam BV, et al. A multi-institutional comparison of outcomes of immunosuppressed and immunocompetent patients treated with surgery and radiation therapy for cutaneous squamous cell carcinoma of the head and neck. Cancer. 2017;123:2054–2060. doi: 10.1002/cncr.30601. - DOI - PubMed
    1. Boutros A, et al. Immunotherapy for the treatment of cutaneous squamous cell carcinoma. Front Oncol. 2021;11:733917. doi: 10.3389/fonc.2021.733917. - DOI - PMC - PubMed
    1. Grob JJ, et al. Pembrolizumab Monotherapy for Recurrent or Metastatic Cutaneous Squamous Cell Carcinoma: A Single-Arm Phase II Trial (KEYNOTE-629) J. Clin. Oncol. 2020;38:2916–2925. doi: 10.1200/JCO.19.03054. - DOI - PMC - PubMed

Publication types

MeSH terms