. 2024 May 1;15(1):3346.
doi: 10.1038/s41467-024-45966-w.

The impact of exercise on gene regulation in association with complex trait genetics

Collaborators, Affiliations

The impact of exercise on gene regulation in association with complex trait genetics

Nikolai G Vetr et al. Nat Commun. .

Abstract

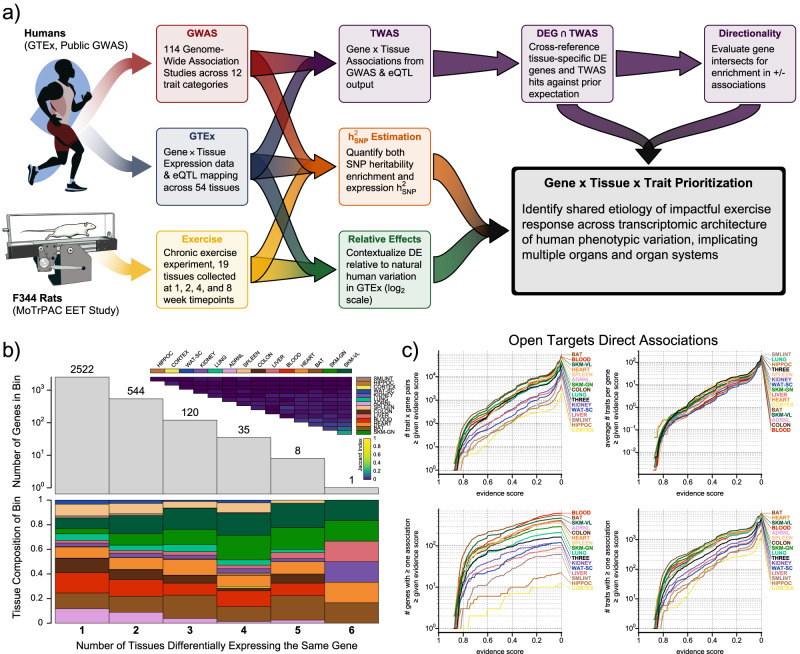
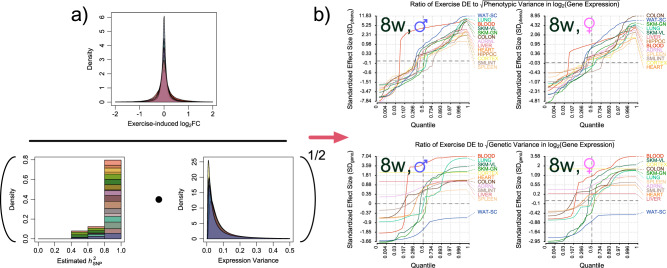
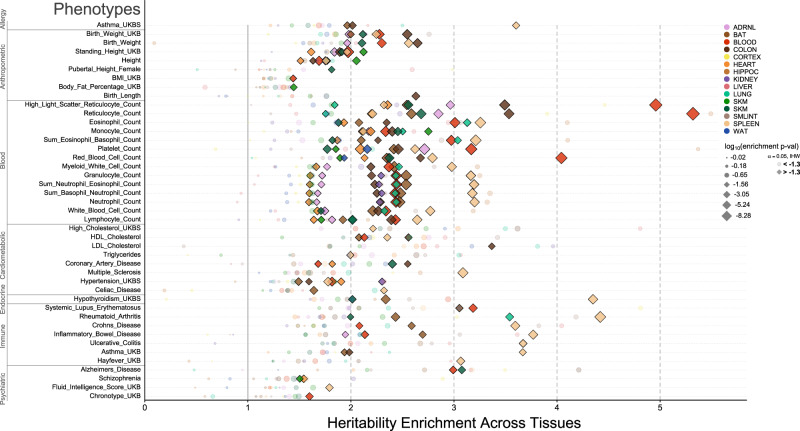
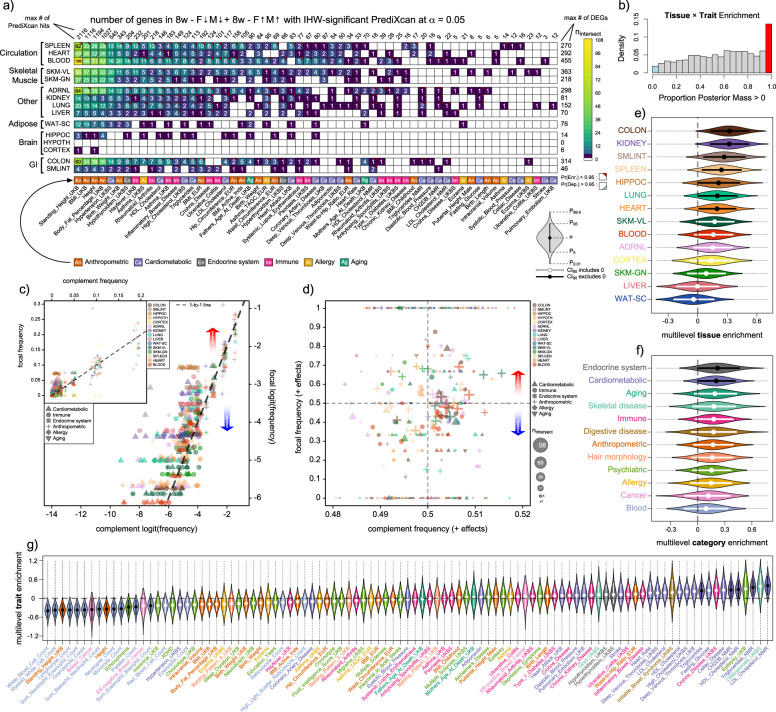
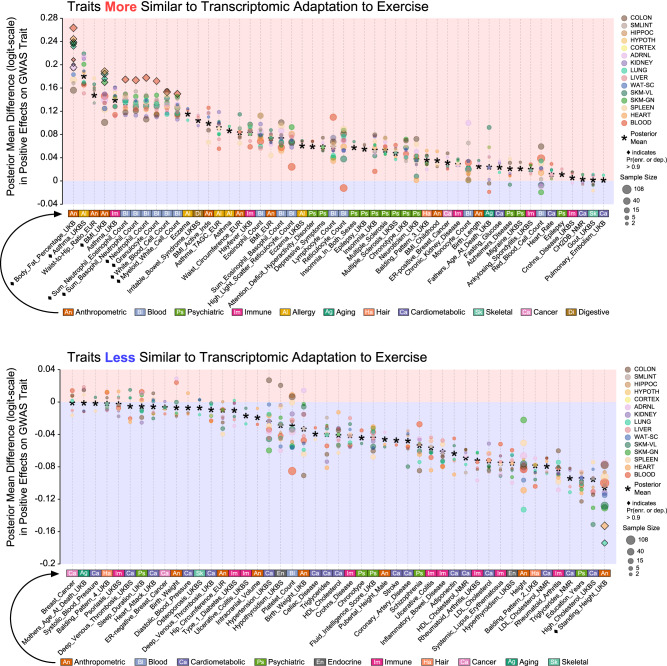
Endurance exercise training is known to reduce risk for a range of complex diseases. However, the molecular basis of this effect has been challenging to study and largely restricted to analyses of either few or easily biopsied tissues. Extensive transcriptome data collected across 15 tissues during exercise training in rats as part of the Molecular Transducers of Physical Activity Consortium has provided a unique opportunity to clarify how exercise can affect tissue-specific gene expression and further suggest how exercise adaptation may impact complex disease-associated genes. To build this map, we integrate this multi-tissue atlas of gene expression changes with gene-disease targets, genetic regulation of expression, and trait relationship data in humans. Consensus from multiple approaches prioritizes specific tissues and genes where endurance exercise impacts disease-relevant gene expression. Specifically, we identify a total of 5523 trait-tissue-gene triplets to serve as a valuable starting point for future investigations [Exercise; Transcription; Human Phenotypic Variation].


Conflict of interest statement

S.B.M. is a consultant for BioMarin, MyOme and Tenaya Therapeutics. These companies are broadly interested in treatments for rare and common genetic diseases but had no input on any component of this study. The authors have no other competing interests to declare.

Figures

Fig. 1
Fig. 1. Tissue-specific differential gene expression from exercise impacts unique sets of disease processes.
In (a), we provide a general overview of the work described here, from human genetic and transcriptomic data and rats subjected to an Endurance Exercise Training (EET) experimental perturbation to triplets of causally entangled genes, tissues, and traits. In (b), we subset Differentially Expressed (DE) Genes to just those determined to be DE at 8W in a sex-consistent manner, and visualize their distribution and tissue-specific composition across uniquely DE genes (genes DE in only one tissue), pairs (in two tissues), triplets, etc. To check for overlap in these gene sets, we also plot the upper triangle of a Jaccard Similarity matrix. In (c), we present alternative ways to characterize Open Targets associations across these gene sets.
Fig. 2
Fig. 2. Tissue-specific differential gene expression from exercise can exceed natural variation.
In this figure we visualize the procedure used to obtain Standardized Effect Sizes. In the numerator of (a) lies a truncated kernel density estimate of the distribution of log2FCs induced by exercise at the 8w timepoint. A stacked histogram of estimates for hSNP2 for expression scores from GTEx (p < 0.10 after IHW correction) is on the left in the denominator. On the right are the inverse-gamma distributions serving to regularize log2-normalized expression scores. Together, this results in a value equal to the estimated genetic variance of expression. Taking its square root yields a standard deviation, which we use to divide exercise-induced log2FC. In (b), we plot the empirical quantile function for distributions of ratios of each tissue’s exercise-induced log2(gene expression) / SD(log2(gene expression)). As most of the interesting behavior is contained in the tails of each distribution, we applied two separate transforms to the axes of each plot. The horizontal axis, corresponding to a given quantile in (0,1), was logit-transformed. The vertical axis, corresponding to the ratio of DE / SD(log2expression), received an inverse hyperbolic sine transformation. The upper panels are in units of standardized phenotypic effect, and the lower in units of standardized genetic effect for those genes and tissues with significant non-zero hSNP2 (IHW α = 0.10, one-sided). Source data for this figure are provided as a Source Data file.
Fig. 3
Fig. 3. Genetic variation near exercise training genes is enriched in heritability across human phenotypes.
Here, we visualize conditional heritability enrichments (LDSC) of multiple traits within differentially expressed, sex-independent gene sets corresponding to different tissues. Colors distinguish tissues, with opaque diamonds corresponding to IHW-significant hits (α = 0.05), and size proportional to the magnitude of log10(p-value) (two-sided, adjusted for multiple comparisons with IHW). The horizontal axis corresponds to the heritability enrichment factor, and the vertical to GWAS traits, grouped into high-level categories. Traits lacking an IHW-significant (α = 0.05) hit in at least one tissue are excluded from this visualization, and the horizontal axis has been truncated to exclude non-significant enrichments above that of the maximum significant enrichment, as well as estimated enrichments < 0, which are strictly impossible. Source data for this figure are provided as a Source Data file.
Fig. 4
Fig. 4. Exercise training genes are enriched for genes where expression is associated with trait variation across multiple trait categories.
Here, we visualize fitted output from our PrediXcan-DEG intersect enrichment model (n = 10,000 nominal iterations across four independent chains). In (a), we show the sizes of gene sets in the intersect of PrediXcan hits (IHW α = 0.05) across different traits (horizontal axis) and sex-homogeneous, differentially expressed genes (DEGs) at 8W in different tissues (vertical axis). Cell colors correspond to the size of the intersecting gene set. Numbers in each cell give the size of each intersect, with cell corners labeling cells whose marginal posterior difference parameter has >95% of its mass to one side of 0. Marginal counts give the maximum number of PrediXcan hits in each trait (vertical margin) or DEGs in each tissue (horizontal margin), after constraining the total pool to mutually expressed genes. In (b), we plot the histogram of posterior masses > 0 for trait × tissue difference effects, with colors drawn from cell labels in (a). In (c), the vertical axis corresponds to logit-transformed frequencies of PrediXcan hits in the DEGs from (a), and the horizontal axis represents the corresponding frequency in all genes outside this set. Only traits from six trait categories are depicted, with colors corresponding to tissues and shapes to categories. In (d), the vertical axis maps to the proportion of positive effects in the PrediXcan-DEG intersect across traits and tissues, and the horizontal axis to the same proportion outside that intersect. Point diameter is proportional to the square root of intersect gene set size, with colors and shapes retaining their meaning from (c). In (eg), marginal posterior distributions from our intersect enrichment model are shown as violin plots, with internal lines representing middle 90% credible intervals and internal points representing posterior means. Internal line and point colors are white when the credible interval overlaps with 0, and black otherwise. Violins are arranged in order of increasing posterior mean, with the horizontal axis on the logit scale. In (e), we plot these at the tissue level, in (f) at the trait category level, and in (g) at the trait level. Source data for this figure are provided as a Source Data file.
Fig. 5
Fig. 5. Exercise training genes can be enriched for more or less disease-like effects.
We visualize the posterior means of multilevel trait and trait × tissue terms from a Bayesian model corresponding to the proportion of genes imparting a positive effect on traits aligned along the horizontal axis. Diamonds mark traits or trait × tissue pairs whose difference effect’s posterior mass falls entirely to one side of 0, either prepending the trait name or else marking the trait × tissue symbol. Points sizes are in proportion to the square root of sample size, and traits are arranged on the horizontal axis according to the monotonic decrease in their posterior means. Source data for this figure are provided as a Source Data file.
Fig. 6
Fig. 6. Examining which trait-associated, exercise-responsive genes are differentially expressed at levels outside natural variation yields interesting candidates for further study.
We visualize the observed proportion of positive effects for the two non-anthropometric traits that had the highest posterior mean enrichment in that proportion according to our proportion of positive effects enrichment model. Above, two panels correspond to self-reported high cholesterol, and below, self-reported asthma. Lines terminate at 8W on the right of each panel, splitting into tissues and genes. Additionally, we trace the proportion for the 8w gene set backwards in time, examining the effect of those genes at 1w, 2w, and 4w. Tissue names are followed by the total number of genes in the intersecting gene set in parentheses, and gene names are followed by their sign (a red + if the effect of DE on the trait is positive and a blue - if negative), and the standardized effect size of DE from Fig. 2b. Additionally, we plot a line corresponding to the set of all gene-tissue pairs in black, labeled ALL. Source data for this figure are provided as a Source Data file.

References

    1. Ruegsegger GN, Booth FW. Health benefits of exercise. Cold Spring Harbor Perspect. Med. 2018;8:a029694. - PMC - PubMed
    1. Fiuza-Luces C, et al. Exercise benefits in cardiovascular disease: beyond attenuation of traditional risk factors. Nat. Rev. Cardiol. 2018;15:731–743. - PubMed
    1. Amar D, et al. Time trajectories in the transcriptomic response to exercise - a meta-analysis. Nat. Commun. 2021;12:3471. - PMC - PubMed
    1. MoTrPAC Study Group Temporal dynamics of the multi-omic response to endurance exercise training across tissues. Preprint at https://www.biorxiv.org/content/10.1101/2022.09.21.508770v2 (2022). - DOI - PMC - PubMed
    1. Barbeira AN, et al. Exploiting the GTEx resources to decipher the mechanisms at GWAS loci. Genome Biol. 2021;22:49. - PMC - PubMed

Publication types