. 2024 May 1;15(1):2869.
doi: 10.1038/s41467-024-47085-y.

A patient-based iPSC-derived hepatocyte model of alcohol-associated cirrhosis reveals bioenergetic insights into disease pathogenesis

Affiliations

A patient-based iPSC-derived hepatocyte model of alcohol-associated cirrhosis reveals bioenergetic insights into disease pathogenesis

Bani Mukhopadhyay et al. Nat Commun. .

Abstract

Only ~20% of heavy drinkers develop alcohol cirrhosis (AC). While differences in metabolism, inflammation, signaling, microbiome signatures and genetic variations have been tied to the pathogenesis of AC, the key underlying mechanisms for this interindividual variability, remain to be fully elucidated. Induced pluripotent stem cell-derived hepatocytes (iHLCs) from patients with AC and healthy controls differ transcriptomically, bioenergetically and histologically. They include a greater number of lipid droplets (LDs) and LD-associated mitochondria compared to control cells. These pre-pathologic indicators are effectively reversed by Aramchol, an inhibitor of stearoyl-CoA desaturase. Bioenergetically, AC iHLCs have lower spare capacity, slower ATP production and their mitochondrial fuel flexibility towards fatty acids and glutamate is weakened. MARC1 and PNPLA3, genes implicated by GWAS in alcohol cirrhosis, show to correlate with lipid droplet-associated and mitochondria-mediated oxidative damage in AC iHLCs. Knockdown of PNPLA3 expression exacerbates mitochondrial deficits and leads to lipid droplets alterations. These findings suggest that differences in mitochondrial bioenergetics and lipid droplet formation are intrinsic to AC hepatocytes and can play a role in its pathogenesis.


Conflict of interest statement

The authors do not have any financial and non-financial interest in design or preparation of the manuscript. D.M. receives a salary from Leica Microsystems where he is Manager for Aivia Software, however received no compensation to assist for this manuscript. A.J.S. have stock options in Genfit, Akarna, Tiziana, Durect Inversago, and Galmed. He has served as a consultant to Astra Zeneca, Salix, Tobira, Takeda, Jannsen, Gilead, Terns, Birdrock, Merck, Valeant, Boehringer Ingelheim, Bristol Myers Squibb, Lilly, Hemoshear, Novartis, Novo Nordisk, Pfizer, 89 bio, Regeneron, Alnylam, Akero, Tern, Histoindex, Corcept, Poxel, Path AI, and Genfit. His institution has received grant support from Gilead, Salix, Tobira, Bristol Myers, Shire, Intercept, Merck, Astra Zeneca, Malinckrodt and Novartis. He receives royalties from Elsevier and UptoDate. However, A.J.S. received no compensation from any source for this manuscript.

Figures

Fig. 1
Fig. 1. Generation and analysis of iPSC-derived iHLCs from AC and healthy controls.
A A schematic diagram illustrating the timeline for the generation of iHLCs from peripheral blood T lymphocytes. Scale bar 400 µm. B Phase-contrast imaging at day 5, 9, 29 and 80 after initiation from blood samples showing progression to cuboid iHLC morphology. Scale bar 400 µm. C De-differentiation of B lymphocytes to iPSCs and differentiation to iHLCs shown by staining of representative healthy (H iHLC) and alcohol cirrhosis (AC iHLC) lines for SSEA4, an indicator of pluripotency. Scale bar 400 µm. D Flow cytometry analyses with HNF4α and albumin staining showing differentiation to iHLCs from iPSCs E Representative images showing iHLC staining of E-cadherin, along with a nuclear stain (DAPI). Scale bar 20 µm. F Representative images illustrating maturity and homogeneity of iHLCs using antibodies to albumin versus the iPSC-specific marker OCT4. Scale bar 10 µm G Quantitation of hepatocyte-specific transcripts CYP1A2, CYP2C9, PROX1, and TBX3 by real-time PCR and comparison of iHLCs with iPSCs (n = 6, *P = 0.0018, 0.0003, <0.0001 and 0.0007 by unpaired two-tailed t-test for CYP1A2, CYP2C9, PROX1, and TBX3 respectively). All data were shown as mean ± SEM. All experiments were replicated three times or more.
Fig. 2
Fig. 2. The number of LDs in AC iHLCs is increased and the LDs are closely associated with mitochondria.
A Representative confocal images showing Nile red staining in AC and H iHLCs. Scale bar 20 µm. B Increased Nile red staining observed in AC iHLCs was quantified (n = 6/group, *P < 0.05, unpaired two tailed t-test). C Confirmation of increased lipid accumulation in AC iHLCs via quantitative Adipo Red assay. n = 6/groups, *P < 0.05(unpaired two tailed t-test). D. Representative confocal images for both Nile red and neutral lipid staining along with Hoechst33342 in live cells. Scale bar 5 µm Metabolic comparisons of H and AC iHLCs showed a trend for increased de novo lipogenesis (E) and significant increases in fatty acid uptake (F) and triglyceride (G) and phosphocholine (H) content. (n = 6/group, *P < 0.05, unpaired two tailed t-test). I Confocal images of mitochondrial/lipid proximity in live cells with a neutral lipid stain and the mitochondrial stain Hoechst33342. Scale bar 10 µm. J AIVIA machine learning generated diagram showing increased lipid droplets in proximity to mitochondria in AC iHLCs. All data were shown as mean ± SEM. All experiments were replicated three times.
Fig. 3
Fig. 3. Transcriptomic analyses of differentially expressed genes in H and AC iHLCs.
A Integrative analysis of differentially expressed genes for the Wikipathways gene set was performed using PIANO (Bioconductor). The most statistically significant downregulated pathways (blue) associated with metabolism and cell fate. B Wikipathways gene set analyses of upregulated pathways (red) associated with metabolism and cell fate. C Analyses of differentially expressed genes for KEGG pathways using the COLOR feature. Several genes associated with lipid pathways (red) were upregulated. D KEGG COLOR analyses highlighted multiple genes interacting with oxidative phosphorylation that were downregulated(blue), predicting lower NAD and ATP (blue). E KEGG COLOR analyses also highlighted the electron transport chain in which several genes interacting with mitochondrial complexes were downregulated (blue) in AC.
Fig. 4
Fig. 4. Bioenergetics mitochondrial is significantly altered iHLCs.
A Relative anaerobic (Glycolytic) and aerobic (Mitochondrial) ATP production by iHLCs. B Comparison of H and AC iHLC mitochondrial bioenergetics using the Seahorse instrument demonstrating lower mitochondrial efficiency. C Quantification of mitochondrial functional parameters showed that basal respiration, maximal respiration, spare respiratory capacity, and ATP production were significantly decreased in AC iHLCs compared to H iHLCs. AC iHLCs had lower spare mitochondrial capacity (62%; P < 0.0001) as well as lower basal (46%; P = 0.0002), maximal (55%; P < 0.0001), and ATP production (48%; P = 0.0002)(unpaired two-tailed t-test). There was no statistical difference in proton leak and non-mitochondrial oxygen consumption (unpaired two tailed t test) D AC IHLCs were also significantly lower in percentage spare respiratory capacity (18%, P = 0.0041) but did not differ in coupling efficiency (unpaired two-tailed t-test). E Immunoblot analyses of mitochondrial complex I, II, III and V normalized with β-actin in cell lysates from samples measured for OCR. F Schematic diagram depicting the differential mitochondrial bioenergetics observed in H and AC iHLCs. All data were shown as mean ± SEM (n = 6/group).
Fig. 5
Fig. 5. Utilization of fatty acid and glutamine substrates by mitochondria is diminished in AC iHLCs leading to lower mitochondrial capacity.
A Dependency of mitochondrial metabolism on glutamine (GLN) (68%, P = 0.0018) and fatty acid (FA) (29%, P = 0.035) substrates was reduced in AC iHLCs. The changes in flexibility were not statistically significant. However, the mitochondrial capacities, a measure for both, differed significantly (unpaired two tailed t test). B Schematic diagram of substrate utilization by H and AC iHLCs. C Substrate oxidation stress test (OCR) profiles of respiration parameters critical for substrate demand in H and AC iHLCs. For OCR, compounds were sequentially injected measuring basal respiration, acute response to the inhibitor etomoxir (blocking fatty acid transport to mitochondria), and maximal respiration. D Quantitative measurements of parameters demonstrating decreases in basal respiration (37%, P = 0.0002), maximal respiration (54%, P = 0.0001), spare respiratory capacity (73%, P = 0.0013), and ATP production (47%, P = 0.0029) in AC iHLCs compared to H iHLCs after FA substrate blockade whereas there were no differences between case and control iHLCs in proton leak and nonmitochondrial oxygen consumption. (unpaired two tailed t-test). E Coupling efficiency and spare respiratory capacity expressed as percent for AC IHLCs for FA substrate (unpaired two tailed t-test). F Substrate oxidation stress test OCR profiles critical for substrate demand in control and AC iHLCs showing basal respiration and acute response to BTES (which blocks GLN transport to mitochondria) and maximal respiration. G Quantitative measurements of parameters demonstrating decreases in basal respiration (35%, P = 0.0055), maximal respiration (46%, P = 0.0002), spare respiratory capacity (68%, P < 0.0001), and ATP production (42%, P = 0.0039) in AC iHLCs compared to control iHLCs after GLN substrate blockade whereas no differences were observed between case and control iHLCs in proton leak and nonmitochondrial oxygen consumption. (unpaired two-tailed t-test). H Quantification of Coupling efficiency and spare respiratory capacity is expressed as percent for AC iHLCs for GLN substrate. All data were shown as mean ± SEM (n = 6/group).
Fig. 6
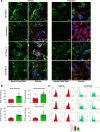
Fig. 6. Treatment of AC iHLCs with Aramchol leads to decreased LD formation, increased mitochondrial performance and diminished senescence.
A Representative confocal image (40× objective) of AC iHLCs treated with vehicle or Aramchol for Neutral lipid stain (green), and nuclear stain (blue). Scale bar 10 µm. B Quantitative measurements of parameters demonstrating increases in basal respiration (106%, P = 0.0013), maximal respiration (88.9%, P = 0.0028), spare respiratory capacity (130%, P = 0.0008), and ATP production (139%, P = 0.0055) in AC iHLCs compared to control iHLCs (unpaired two tailed t-test). C Flow cytometry histogram of senescence cell staining of six AC patient-derived iHLCs(red) and after treatment of the same group of samples with Aramchol (green). Senescence-positive cells decreased 32% (P = 0.002) after treatment with Aramchol (unpaired two-tailed t test). All data were shown as mean ± SEM (n = 6/group).
Fig. 7
Fig. 7. In AC iHLCs, PNPLA3 and MARC1 show increased colocalization with mitochondria and LDs.
A Representative confocal image (60× objective) of control and AC iHLCs for MARC1 (cyan), PNPLA3 (green), mitochondria (red) and nuclear stain (blue). Scale bar 10 µm. B Representative confocal images (40× objective) of control and AC iHLCs for neutral lipid stain (green), MARC1 (red), PNPLA3 (turquoise), and nuclear stain (blue). Scale bar 10 µm C Increased colocalization of MARC1 and PNPLA3 in AC iHLCs compared to control iHLCs. Scale bar 10 µm. D Schematic model of interaction of PNPLA3 with MARC1, and in the physical context of proximity of mitochondria and lipid droplets. All data were shown as mean ± SEM(n = 6/group).
Fig. 8
Fig. 8. The interplay of PNPLA3 and MARC1 with mitochondria and LDs in the interactome lead to increased lipid peroxidation and oxidative modification of lipid metabolism proteins in AC iHLCs.
A Representative confocal images of iHLCs derived from three patients with AC, the cells having been stained with neutral lipid stain (green) and nuclear (blue). AC IHLCs were treated with either scrambled siRNA or PNPLA3 smart pool siRNA and LD were visualized by airyscan confocal technology. Scale bar 10 µm. B Representative machine learning clipping plane images from control and PNPLA3 siRNA treated AC iHLCs. C Quantification of LD size/nuclei, and volume of LD based on sizing criteria: small, medium and large, as described in methods. Knockdown of PNPLA3 with siRNA led to increased LD size (P = 0.007, 0.0111,0.0121 and 0.0050; unpaired two-tailed t-test). D Flow cytometric quantification of Mitochondrial lipid peroxidation using MitoPER. Representative univariate histograms of H and AC iHLCs along with no-reagent control (gray shade) in the top panel. The quantitative measurement of the mitochondrial lipid peroxidation in the bottom panels demonstrated a significant increase in AC iHLCs, (n = 4/group, unpaired two-tailed t-test, P < 0.0001). E Selective modification of short and long-chain derived fatty acyl-COA synthetase by HNE adducts represented by western blot analyses in the left panel. Quantitative measurement of HNE adducts with ACSS2 and ACSL1 showed a significant increase in AC iHLCs compared to H iHLCs (P = 0.0089 and 0.0005; unpaired two tailed t-test). F Schematic diagram of a hypothesized underlying mechanism for lower AC iHLCs bioenergetic fitness due to the interplay of PNPLA3 and MARC1 with mitochondria and lipid droplets generating lipid peroxidation and mitochondrial dysfunction. Oxidative modification of mitochondrial proteins and key metabolic proteins can lead to reduced mitochondrial metabolism of fatty acids and glutamate leading to mitochondrial-reduced capacity and efficiency and decreased ATP production and overall. to the poor bioenergetic state of AC iHLCs. All data were shown as mean ± SEM (n = 6/groups except stated).

References

    1. NIAAA. Alcohol Use Disorder (AUD) in the United States: Age Groups and Demographic Characteristics. (2023).
    1. CDC. Chronic Liver Disease and Cirrhosis, (2023).
    1. Puri, P. et al. Alcohol produces distinct hepatic lipidome and eicosanoid signature in lean and obese. J. Lipid Res.57, 1017–1028 (2016). - PMC - PubMed
    1. Mitra, S., De, A. & Chowdhury, A. Epidemiology of non-alcoholic and alcoholic fatty liver diseases. Transl. Gastroenterol. Hepatol.5, 16 (2020). - PMC - PubMed
    1. HRSA. OPTN/SRTR 2019 Annual Data Report: Liver) (2019).

Publication types

MeSH terms