. 2024 May;629(8012):704-709.
doi: 10.1038/s41586-024-07326-y. Epub 2024 May 1.

Structural and molecular basis of choline uptake into the brain by FLVCR2

Affiliations

Structural and molecular basis of choline uptake into the brain by FLVCR2

Rosemary J Cater et al. Nature. 2024 May.

Abstract

Choline is an essential nutrient that the human body needs in vast quantities for cell membrane synthesis, epigenetic modification and neurotransmission. The brain has a particularly high demand for choline, but how it enters the brain remains unknown1-3. The major facilitator superfamily transporter FLVCR1 (also known as MFSD7B or SLC49A1) was recently determined to be a choline transporter but is not highly expressed at the blood-brain barrier, whereas the related protein FLVCR2 (also known as MFSD7C or SLC49A2) is expressed in endothelial cells at the blood-brain barrier4-7. Previous studies have shown that mutations in human Flvcr2 cause cerebral vascular abnormalities, hydrocephalus and embryonic lethality, but the physiological role of FLVCR2 is unknown4,5. Here we demonstrate both in vivo and in vitro that FLVCR2 is a BBB choline transporter and is responsible for the majority of choline uptake into the brain. We also determine the structures of choline-bound FLVCR2 in both inward-facing and outward-facing states using cryo-electron microscopy. These results reveal how the brain obtains choline and provide molecular-level insights into how FLVCR2 binds choline in an aromatic cage and mediates its uptake. Our work could provide a novel framework for the targeted delivery of therapeutic agents into the brain.


Conflict of interest statement

Competing interests

The authors declare no competing interests.

Figures

Extended Data Figure 1 |
Extended Data Figure 1 |. Expression profiles of bona fide and putative choline transporters.
a, Expression profiles, showing that Flvcr2 is enriched in brain endothelial cells in both human and mouse. Other putative and validated choline transporters are not specifically enriched at the BBB. Abbreviations on the horizontal axes indicate: astrocytes (astro), neuron, oligodendrocyte progenitor cells (OPC), immature oligodendrocytes (Olig1), mature oligodendrocytes (Olig2), microglia (MG), endothelial cells (EC), foetal astrocytes (FetalAC), maternal astrocytes (MatAC), and oligodendrocytes (Olig). Expression in endothelial cells is shown in orange; all other cell types are shown in green. Note the differences in vertical axis scale between transporters. b, Affinities of putative and validated choline transporters. c, RNA sequencing expression profiles from multiple in vitro BBB models compared to acutely isolated brain endothelial cells (Brain EC): primary culture of brain EC, iHBEC, BEND3, HEK293, human iPSC-derived neurons, and HeLa cells (with and without Flvcr1 knockout), showing expression of putative and validated choline transporters in these cells. Flvcr1 expression level in Flvcr1 knockout HeLa cells is coloured grey to denote gene knockout by Crispr/Cas9. d, RT-qPCR performed with RNA extracted from iHBEC cells transfected with either scr siRNA (control) or Flvcr2 siRNA. Human Gapdh expression was used as the internal loading control. e, Fixed sections from Flvcr2HA/HA mice immuno-stained for HA (cyan) and vascular markers ICAM2 (luminal; pink) and COL IV (abluminal; dark blue). Projected Z-stack images (15 um thick) and scale bars of 10 μm are shown. Each representative image was taken from three different biological samples and data analysed from four/five images from each brain. The right panel shows percentage co-localisation of FLVCR2-HA with ICAM2 and COL IV. f, Fixed human brain tissues were immuno-stained for FLVCR2 (cyan) using an FLVCR2 specific antibody and pan-endothelial markers CD34 (luminal; pink) and COL IV (abluminal; dark blue). Projected Z-stack images (15 um thick) and scale bars of 10 μm are shown. Each representative image was taken from five different biological samples and data analysed from four/five images from each brain. The right panel shows percentage co-localisation of FLVCR2 with CD34 and COL IV. Graphical data represent mean ± s.e.m. ****P < 0.0001, ***P < 0.001, **P < 0.01, and *P < 0.05. Statistical tests used and exact P and n values are provided in Supplementary Tables 1 and 2.
Extended Data Figure 2 |
Extended Data Figure 2 |. Generation and validation of Flvcr2 HA-tagging, knock-out, and knock-down.
a, Targeting strategy to generate Flvcr2-HA mice. Pink flag denotes HA tag placed downstream of G4S linker (orange) and immediately upstream from 3’ untranslated region (UTR). Mice carrying the HA insertion were selected based on screening PCR (not shown) and confirmed using Southern blot (right panel; twelve mice diagnosed with correct Flvcr2-HA insertion, and two WT controls). b, Strategy adopted to generate endothelial cell-specific Flvcr2 conditional knockouts (Flvcr2 cKO). c, RT-qPCR performed with RNA extracted from adult mouse brain showing control (Flvcr2Fl/+:Cdh5CreER) vs. Flvcr2 cKO (Flvcr2Fl/Fl:Cdh5CreER). Mouse β-actin expression was used as the internal loading control. d, Brains from control (Flvcr2Fl/+:Cdh5CreER) and Flvcr2 cKO (Flvcr2Fl/Fl:Cdh5CreER) mice stained for HA (Rpl22HA recombination reporter; pink, upper panel) and ERG (red, lower panel) to stain endothelial cell nuclei and CD31 (blue) to delineate blood vessels. Scale bar is 100 μm. Each representative image was taken from three biologically different samples and data analysed from four/five images from each brain. e, Measurement of vascular density vessel length density and total number of endothelial nuclei per unit length of vessel in control vs Flvcr2 cKO. Graphical data represent mean ± s.e.m. ***P < 0.001, **P < 0.01, *P < 0.05, and ns = not significant. Statistical tests used and exact P and n values are provided in Supplementary Tables 1 and 2.
Extended Data Figure 3 |
Extended Data Figure 3 |. Expression, purification, and Fab complex formation of MmFLVCR2.
a, Fluorescent size exclusion chromatography elution profiles of six FLVCR2 orthologs fused to green fluorescent protein (GFP). Orthologs screened are from Homo sapiens (HsFLVCR2; NCBI – NP_060261.2), Mus musculus (MmFLVCR2; NCBI – NP_663422.1), Eptesicus fuscus (EfFLVCR2; NCBI – XP_027997147.2), Canis lupus dingo (CldFLVCR2; NCBI – XP_025299773.1), Bos taurus (BtFLVCR2; NCBI – NP_001179072.1), and Danio rerio (DrFLVCR2; NCBI – XP_693589.3). b, Representative SDS-PAGE gel of MmFLVCR2 purified in DDM/CHS. c, EC50 evaluation of select purified Fabs binding to MmFLVCR2 incorporated into MSP1D1 nanodisc. Data points represent the mean of two data points; approximate EC50 values are provided. d, Normalised high-performance liquid chromatography elution profiles of MmFLVCR2 reconstituted into MSP1D1 nanodisc alone (black) and in complex with Fab FLV23 (blue) and Fab FLV9 (orange). Numbers indicate the retention time (mins) of each peak. e, Mass photometry analysis of nanodisc-reconstituted MmFLVCR2 purified via size exclusion chromatography in the presence (orange) and absence (purple) of Fab FLV23. The peaks differ by 51 kDa which corresponds to the molecular weight of Fab FLV23. Note that negative masses are artefacts caused by non-protein unbinding events. f, Single-point phage ELISA for binding of MmFLVCR2-specific Fab-phage in the presence (orange) and absence (blue) of 1 μM purified Fab FLV32, which was used as an epitope masking reagent. Note that FLV32 was confirmed to have the same binding epitope as FLV23 via preliminary cryo-EM experiments (data not shown). Only Fab FLV9 produced the same level of ELISA signal in the presence and absence of the Fab FLV32.
Extended Data Figure 4 |
Extended Data Figure 4 |. FLVCR2 and FLVCR1 multiple sequence alignment.
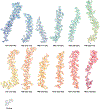
Four FLVCR2 and FLVCR1 variants were aligned using Clustal Omega and visualised and coloured using MView, colouring by property colour scheme. The sequences aligned are: Homo sapiens (HsFLVCR2; NCBI – NP_060261.2), Mus musculus (MmFLVCR2; NCBI – NP_663422.1), Canis lupus dingo (CldFLVCR2; NCBI – XP_025299773.1), Bos taurus (BtFLVCR2; NCBI – NP_001179072.1), Homo sapiens (HsFLVCR1; NCBI – NP_054772.1), Mus musculus (MmFLVCR1; NCBI – NP_001074728.1), Canis lupus familiaris (ClfFLVCR1; NCBI – XP_003639227.1), and Bos taurus (BtFLVCR1; NCBI – NP_001192948.1). Secondary structural elements are shown as cylinders, labelled, and coloured as in Fig. 2. Red circles and orange triangles denote choline-coordinating residues and gating residues respectively. Purple diamonds denote residues at which mutations are associated with PVHH. Blue squares represent residues surrounding the substrate-adjacent ion-like cryo-EM densities.
Extended Data Figure 5 |
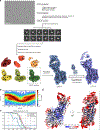
Extended Data Figure 5 |. Cryo-EM workflow and analysis of the outward-facing state of MmFLVCR2.
a, Flow chart outlining cryo-EM image acquisition and processing performed to obtain a structure of detergent-purified MmFLVCR2 in complex with the Fab FLV23. A representative micrograph and 2D class averages are shown. All processing was performed using CryoSPARC v.4.1.2 (see Methods for details). b, Euler angle distribution plot of the final three-dimensional reconstruction of the MmFLVCR2-Fab FLV23 complex. c, Fourier shell correlation (FSC) curves for the MmFLVCR2-Fab FLV23 complex. d, Local resolution map of the MmFLVCR2-Fab FLV23 complex, with an orthogonal view indicating the location of the clipping plane. Density is coloured by resolution from 2.0 (blue) to 3.0 Å (red).
Extended Data Figure 6 |
Extended Data Figure 6 |. Cryo-EM density fit of the outward-facing FLVCR2 model.
Cryo-EM densities (semi-transparent surface) are superimposed on the structural elements of MmFLVCR2 including TM helices 1–12 and bound choline. All elements are shown in stick representation and coloured as in Fig. 2.
Extended Data Figure 7 |
Extended Data Figure 7 |. Structural features of FLVCR2 and human mutations in FLVCR2 associated with PVHH.
a, The N- and C-domains of FLVCR2 as viewed from within the extracellular cavity of the OFS (top panel) and the intracellular cavity of the IFS (bottom panel). For both domains, the electrostatic potential is shown as a surface coloured from red (negative) to blue (positive) with the structure overlayed in ribbon representation and coloured as in Fig. 2. b, Interaction site of Fab FLV23 with FLVCR2 in the OFS. TM2, TM11, and Fab FLV23 are coloured red, blue, and grey respectively, with interacting residues highlighted in stick representation. c, The N- and C-domains of FLVCR2 viewed in the same manner as in panel a, with the protein shown in ribbon representation and coloured by sequence conservation across mammalian FLVCR2 species using a gradient from most (maroon) to least (cyan) conserved. d, Ion-like cryo-EM densities observed close to the choline binding site in the OFS (left) and IFS (right). The protein is coloured as in Fig. 2 with choline shown in grey stick representation and the ion-like cryo-EM densities and cryo-EM density of surrounding residues and choline shown as a grey semi-transparent surface. Positions of the ion-like densities are indicated by the arrows. Note that the ion-like density in the OFS has a higher occupancy than choline. e, Known human mutations in FLVCR2 that are associated with PVHH, their equivalent sites in MmFLVCR2, and observed phenotypes associated with these mutations. Postnatal phenotype refers to a mild phenotype, whereas foetal phenotype refers to subjects who died during birth or by compassionate abortion. f,g, Position of human mutations in FLVCR2 mapped onto the structure of MmFLVCR2 in the f, OFS and g, IFS. Left panel shows a front-on view of the protein and the right panel shows the N- and C-domains as viewed from within the central cavity. All views are in the plane of the membrane. Equivalent sites of human mutations are coloured in purple and shown in stick representation.
Extended Data Figure 8 |
Extended Data Figure 8 |. Cryo-EM workflow and analysis of the inward-facing state of MmFLVCR2.
a, Flow chart outlining cryo-EM image acquisition and processing performed to obtain a structure of detergent-purified MmFLVCR2 in complex with the Fab FLV9. A representative micrograph and 2D class averages are shown. All processing was performed using CryoSPARC v.4.1.2 (see Methods for details). b, Euler angle distribution plot of the final three-dimensional reconstruction of the MmFLVCR2-Fab FLV9 complex. c, Fourier shell correlation (FSC) curves for the MmFLVCR2-Fab FLV9 complex. d, Local resolution map of the MmFLVCR2-Fab FLV9 complex, with an orthogonal view indicating the location of the clipping plane. Density is coloured by resolution from 2.25 (blue) to 3.25 Å (red).
Extended Data Figure 9 |
Extended Data Figure 9 |. Cryo-EM density fit of the inward-facing MmFLVCR2 model.
Cryo-EM densities (semi-transparent surface) are superimposed on structural elements of MmFLVCR2 including TM helices 1–12 and bound choline. All elements are shown in stick representation and coloured as in Fig. 2.
Figure 1 |
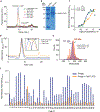
Figure 1 |. FLVCR2 is a blood-brain barrier choline transporter.
a, High-resolution projected Z-stack images from Flvcr2HA/HA brains stained for HA (cyan) and vascular markers ICAM2 (luminal; pink) and COL IV (abluminal; dark blue). Representative image from six mice. Cartoon from SciDraw.io. b, Uptake of intravenously injected [3H]ChCl (0.3 mCi/kg) in control and Flvcr2 cKO mice measured 30 minutes post-injection, represented as brain:blood [3H]ChCl ratio. c-f, Uptake of 20 nM [3H]ChCl into: c, HEK293 cells transfected with empty vector or Flvcr2 cDNA; d, Flvcr1 KO HEK293 cells transfected with empty vector, Flvcr1 or Flvcr2 cDNA; e, iHBEC transfected with scrambled (Scr) or Flvcr2 siRNA; f, WT and two Flvcr2 KO BEND3 cell lines. Data in c-f represent fold change relative to control. g, Binding of 1 μM [3H]ChCl to MmFLVCR2 at various pHs determined using SPA and normalised to binding at pH 9.5. h, One-minute uptake of 1 μM [3H]ChCl into MmFLVCR2-proteoliposomes (internal pH 7.5) with various external buffer conditions. i, One-minute uptake of 0.1 μM [3H]ChCl into MmFLVCR2-proteoliposomes (internal pH 7.5) in the presence of increasing concentrations of unlabelled ChCl with various external buffer conditions. j, One-minute uptake of 1 μM [3H]ChCl into MmFLVCR2-proteoliposomes (internal pH 7.5, external pH 5.5) in the absence and presence of 1 μM Fab-FLV23 or 5 μM CCCP. Data in h and j are normalised to uptake at pH 5.5 without additive. Data in i is normalised to the average max uptake observed at pH 5.5. k, FLVCR2 enriched on brain-vascular lumen where it mediates choline uptake. Illustrations in a,b were generated using BioRender; k was adapted with permission. Data represent mean ± s.e.m. ***P < 0.0001, ***P < 0.001, **P < 0.01, and *P < 0.05. Statistical tests used and exact P and n values are provided in Supplementary Tables 1 and 2.
Figure 2 |
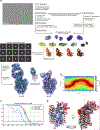
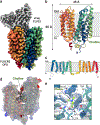
Figure 2 |. The structure of FLVCR2 in an outward-facing conformation.
a, The 2.49 Å resolution cryo-EM density map of FLVCR2 in complex with Fab FLV23. Density corresponding to FLVCR2 is shown in rainbow from the N-terminus (blue) to the C-terminus (red) and in grey for the variable region of Fab FLV23. b, The OFS structure of FLVCR2 in the plane of the membrane, coloured as in a. Choline is shown in green stick representation and an unresolved intracellular loop as a dashed line. c, Topology of FLVCR2 showing the twelve numbered TM helices, coloured as in a. Disordered regions that could not be resolved in our cryo-EM map are shown as dashed lines. d, Surface representation of the electrostatic potential of the extracellular cavity. Red and blue indicate negatively and positively charged regions, respectively. Inset refers to the region highlighted in panel e. The structure is overlaid in rainbow ribbon and choline is shown in green stick representation. e, Choline binding site in the OFS. Choline and surrounding residues are shown in stick representation and the cryo-EM density corresponding to these is displayed as a semi-transparent light blue surface.
Figure 3 |
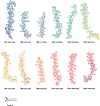
Figure 3 |. The structure of FLVCR2 in an inward-facing conformation.
a, The 2.77 Å resolution cryo-EM density map of FLVCR2 in complex with Fab FLV9. Density corresponding to FLVCR2 is shown in rainbow from the N-terminus (blue) to the C-terminus (red) and in grey for the variable region of Fab FLV9. b, The IFS structure of FLVCR2 in the plane of the membrane, coloured as in a. Choline is shown in green stick representation and an unresolved intracellular loop as a dashed line. c, Surface representation of the electrostatic potential of the intracellular cavity. Red and blue indicate negatively and positively charged regions, respectively. Inset refers to the region highlighted in panel d. The structure is overlaid in rainbow ribbon and choline is shown in green stick representation. d, Choline binding site in the IFS. Choline and surrounding residues are shown in stick representation and the cryo-EM density corresponding to these is displayed as a semi-transparent light blue surface. e, Specific binding of 1 μM [3H]ChCl alone or in the presence of 250 μM unlabelled ChCl, acetylcholine, betaine, or ethanolamine, with their chemical structures shown above. Data represent mean ± s.e.m. (n = 7). ***P < 0.001, **P < 0.01, *P < 0.05, and ns = not significant. Statistical tests used and exact P and n values are provided in Supplementary Tables 1 and 2.
Figure 4 |
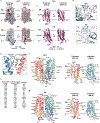
Figure 4 |. Mechanism of FLVCR2-mediated choline transport.
a, Cross-sectional surface representation of FLVCR2 in the OFS (left) and IFS (right). The N- and C-domains are coloured in blue and orange, respectively. Choline is shown in green stick representation. b, Choline binding site in the OFS (left) and IFS (right). The protein is coloured as in panel a and shown in cartoon representation with residues involved in choline coordination from the N- and C-domain shown as blue and red-orange sticks, respectively. Choline is also shown in green stick representation. TMs in the foreground are shown in partial transparency for visual clarity. c, FLVCR2 in the OFS (top) and IFS (bottom) with residues participating in interdomain interactions highlighted in stick representation. The protein is coloured as in panel b with TMs shown as tubes and those in the foreground in partial transparency for visual clarity.

Update of

References

    1. Zeisel SH & da Costa K-A Choline: an essential nutrient for public health. Nutrition Reviews 67, 615–623 (2009). - PMC - PubMed
    1. Zeisel SH Choline: Critical Role During Fetal Development and Dietary Requirements in Adults. Annu Rev Nutr 26, 229–250 (2006). - PMC - PubMed
    1. Institute of Medicine (US) Standing Committee on the Scientific Evaluation of Dietary Reference Intakes and its Panel on Folate, Other B Vitamins, and Choline. Dietary Reference Intakes for Thiamin, Riboflavin, Niacin, Vitamin B6, Folate, Vitamin B12, Pantothenic Acid, Biotin, and Choline. (National Academies Press (US), Washington (DC), 1998). - PubMed
    1. Hupe M et al. Gene expression profiles of brain endothelial cells during embryonic development at bulk and single-cell levels. Science Signaling 10, eaag2476 (2017). - PubMed
    1. Santander N et al. Lack of Flvcr2 impairs brain angiogenesis without affecting the blood-brain barrier. J Clin Invest 130, 4055–4068 (2020). - PMC - PubMed

Additional References

    1. Li Y et al. MFSD7C switches mitochondrial ATP synthesis to thermogenesis in response to heme. Nat Commun 11, 4837 (2020). - PMC - PubMed
    1. Sabbagh MF & Nathans J A genome-wide view of the de-differentiation of central nervous system endothelial cells in culture. Elife 9, e51276 (2020). - PMC - PubMed
    1. Semesta KM, Garces A & Tsvetanova NG The psychosis risk factor RBM12 encodes a novel repressor of GPCR/cAMP signal transduction. J Biol Chem 299, 105133 (2023). - PMC - PubMed
    1. Assur Z, Hendrickson WA & Mancia F Tools for coproducing multiple proteins in mammalian cells. Methods Mol Biol 801, 173–87 (2012). - PMC - PubMed
    1. Kawate T & Gouaux E Fluorescence-detection size-exclusion chromatography for precrystallization screening of integral membrane proteins. Structure 14, 673–81 (2006). - PubMed