. 2024 May;629(8012):660-668.
doi: 10.1038/s41586-024-07340-0. Epub 2024 May 1.

Mitochondrial transfer mediates endothelial cell engraftment through mitophagy

Affiliations

Mitochondrial transfer mediates endothelial cell engraftment through mitophagy

Ruei-Zeng Lin et al. Nature. 2024 May.

Abstract

Ischaemic diseases such as critical limb ischaemia and myocardial infarction affect millions of people worldwide1. Transplanting endothelial cells (ECs) is a promising therapy in vascular medicine, but engrafting ECs typically necessitates co-transplanting perivascular supporting cells such as mesenchymal stromal cells (MSCs), which makes clinical implementation complicated2,3. The mechanisms that enable MSCs to facilitate EC engraftment remain elusive. Here we show that, under cellular stress, MSCs transfer mitochondria to ECs through tunnelling nanotubes, and that blocking this transfer impairs EC engraftment. We devised a strategy to artificially transplant mitochondria, transiently enhancing EC bioenergetics and enabling them to form functional vessels in ischaemic tissues without the support of MSCs. Notably, exogenous mitochondria did not integrate into the endogenous EC mitochondrial pool, but triggered mitophagy after internalization. Transplanted mitochondria co-localized with autophagosomes, and ablation of the PINK1-Parkin pathway negated the enhanced engraftment ability of ECs. Our findings reveal a mechanism that underlies the effects of mitochondrial transfer between mesenchymal and endothelial cells, and offer potential for a new approach for vascular cell therapy.


Figures

Extended Data Fig. 1 ∣
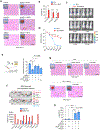
Extended Data Fig. 1 ∣. Stromal cell support is essential for human EC engraftment.
Grafts comprising human ECs with or without MSCs were subcutaneously implanted in immunodeficient nude mice. a, H&E staining of 7-day explants with human ECFCs, HUVECs, and wat-ECs, highlighting perfused vessels (yellow arrowheads). Insets show day 7 macroscopic views. Scale bar, 100 μm. b, Microvessel density at day 7 with various human EC types; **P ≤ 0.01, ***P ≤ 0.001 (n = 3; unpaired t-test). c, Bioluminescence of lucif-EC grafts with or without MSCs. d, Time-dependent quantification of bioluminescence; *P ≤ 0.05, **P ≤ 0.01, ***P ≤ 0.001 (n = 3; unpaired t-test). e, EC apoptosis assessed by flow cytometry at 24 h post-implantation with/without MSCs, MSC-CM, VEGF, bFGF, and AG1296; *P ≤ 0.05, ***P ≤ 0.001 (n = 3; unpaired t-test). f, Proteomic dot blotting reveals unique pro-angiogenic factors in MSC-conditioned media. g, H&E staining of 7-day explants with multiple conditions; yellow arrowheads indicate perfused vessels. Scale bar, 100 μm. h, Day-7 microvessel density; ***P ≤ 0.001 (n = 3; unpaired t-test). All data are mean ± s.e.m. n are biological replicates (e) and independent animals (b,d,h).
Extended Data Fig. 2 ∣
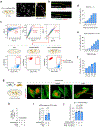
Extended Data Fig. 2 ∣. Formation of mitochondria-laden TNTs by MSCs in the presence of ECs.
a, Schematic of 24 h co-culture of mitoRed-MSCs with human ECs. DsRed+ mitochondria in TNTs visualized via fluorescence microscopy. Scale bar, 40 μm. b, Immunofluorescence reveals F-actin and microtubule components in TNTs. Scale bar, 5 μm. c, Flow cytometry gating strategy to evaluate mitochondrial transfer and eliminate doublets and aggregates. d, Proportion of ECs (CD31+) with mitoDsRed+ mitochondria in 1:1 co-culture, indicating plated cell number. e, Proportion of mitoDsRed+ mitochondria-receiving ECs at varying MSC:EC ratios, with constant total cell density (4 × 10⁵ cells). f, Comparison of mitochondrial transfer in 2D vs. 3D culture and under normoxic vs. hypoxic conditions (4 × 10⁶ cells). g, mitoRed-ECs cultured with/without MSCs show negligible DsRed+ mitochondria-laden TNT formation, even after TNF treatment. F-actin visualized by FITC-phalloidin. Scale bars, 10 μm. h, Fluorescent quantification confirms minimal TNT formation by ECs under tested conditions (n = 3). i, Flow cytometry quantification of DsRed+ mitochondria in MSCs (CD31) indicates minimal transfer (~1%) from mitoRed-ECs (n = 3).j, Proportion of ECs (CD31+) with mitoDsRed+ mitochondria in 1:1 (ECs + mitoRed-MSCs) co-culture in the presence of angiogenic factors VEGF (10 ng/mL) or bFGF (10 ng/mL) (n = 3-4; one-way ANOVA followed by Bonferroni’s post-test). All data are mean ± s.e.m. n are biological replicates (h,i,j).
Extended Data Fig. 3 ∣
Extended Data Fig. 3 ∣. Regulation of TNT formation and mitochondrial transfer from MSCs to ECs.
a, Human ECs cultured in 2D plates or 3D hydrogel had conditioned media analysed for cytokine secretion using proteomic dot blotting arrays; selected cytokines predominantly secreted in 3D are marked. b, Blot intensities quantified by ImageJ. c, Effect of IL-1α and IL-1β on TNT formation in MSCs. MSCs were exposed to IL-1α, IL-1β, or an anti-IL-1α antibody, and changes in TNT formation were observed and quantified at 24 h. *P ≤ 0.05, **P ≤ 0.01, ***P ≤ 0.001 (n = 17, MSCs; n = 10, +IL-1β; n = 6, +IL-1α; n = 11, +ECs; n = 11, +ECs + anti-IL-1α; one-way ANOVA followed by Bonferroni’s post-test). d, shRNA silencing of TNFAIP2 in mitoRed-MSCs confirmed by qPCR against GAPDH, *P ≤ 0.05 (n = 2; unpaired two-tailed t-test). e, Reduced DsRed+ TNTs in shTNFAIP2-MSCs compared to controls; scale bar, 10 μm. f, MIRO1 silencing in mitoRed-MSCs confirmed by qPCR, *P ≤ 0.05 (n = 2; unpaired two-tailed t-test). g, F-actin in mitoRed-MSCs visualized by FITC-phalloidin; scale bar, 10 μm. h, Lower DsRed+ mitochondria count per TNT in shMIRO1-MSCs, ***P ≤ 0.001 (n = 30 TNTs; unpaired two-tailed t-test). i, Co-cultures of ECs and mitoRed-MSCs assessed by flow cytometry revealed reduced mitochondrial transfer from shMIRO1-MSCs compared to control MSCs, ***P ≤ 0.001 (n = 4; unpaired two-tailed t-test). All data are mean ± s.e.m. n are independent fields (c,h) and biological replicates (d,f,i,j).
Extended Data Fig. 4 ∣
Extended Data Fig. 4 ∣. In vivo temporal dynamics of mitochondrial transfer from MSCs to ECs.
a, Depiction of mitoRed-MSCs containing DsRed+ mitochondria and subcutaneously co-transplanted with human ECs into immunodeficient nude mice. b, Day-7 post-transplant, immunofluorescence of explanted grafts stained with UEA1 lectin showcases human ECs. Red fluorescence indicates DsRed+ mitochondria, identified with white arrows. UEA1+ ECs containing DsRed+ mitochondria are marked with a yellow arrowhead. Control grafts with unlabelled MSCs, showing no DsRed signal, are displayed on the left. Blood vessel lumens are asterisked. Scale bars, 50 μm. c, Different time-point immunofluorescent images of explants highlight DsRed+ mitochondria in UEA1+ ECs (yellow arrowhead) on day 7, absent on day 14. However, administering TNF (contrary to saline) on day 14 reinstated the DsRed+ mitochondrial transfer into UEA1+ ECs, seen on day 16. Scale bars, 50 μm. d, Diagram representing the time course appearance of DsRed+ mitochondria (mitoRed) in the grafted ECs.
Extended Data Fig. 5 ∣
Extended Data Fig. 5 ∣. Artificial transplantation of exogenous mitochondria into human ECs.
a, Phase contrast images combined with red fluorescence show cultured ECs 4 h post artificial transplantation with DsRed+ mitochondria (mitoAT-ECs); Scale bar, 200 μm. b, Flow cytometry highlights a significant proportion of DsRed+ mitoAT-ECs. c, Confocal imaging reveals DsRed+ mitochondria inside mitoAT-ECs; Scale bar, 10 μm. d, Depiction of the pPB-mitoAPEX2 piggyBac vector carrying APEX2 and mitochondria-targeting sequences. APEX2, an enhanced soybean ascorbate peroxidase, acts as a tag for TEM. e, Method to visualize APEX2+ mitochondria using TEM: APEX2-expressing cells are fixed, then treated with diaminobenzidine (DAB) and hydrogen peroxide. APEX2 catalyses the DAB polymerization, generating TEM contrast after osmium treatment. f, TEM contrasts APEX2-labelled mitochondria in mitoAPEX2-transfected cells with unlabelled counterparts in controls; Scale bar, 500 nm. g, High-magnification TEM of an APEX2-labelled mitochondrion. h, Mitochondria from mitoAPEX2-MSCs transplanted into ECs show APEX2+ mitochondria in mitoAT-ECs at 4 h; Scale bar, 500 nm.
Extended Data Fig. 6 ∣
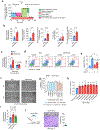
Extended Data Fig. 6 ∣. Enhanced mitochondrial respiration, apoptosis resistance and migration capacity in mitoAT-ECs.
a, Schematic of OCR profile (Seahorse analysis) with specific mitochondrial respiration parameters. Abbreviations: FCCP, carbonyl cyanide-p-trifluoromethoxyphenyl hydrazone. b, Basal respiration, maximal respiration, spare respiratory capacity, proton leak, and non-mitochondrial respiration in ECs and mitoAT-ECs. ***P ≤ 0.001 (n = 6; unpaired two-tailed t-test). c, ATP production in mitoAT-ECs measured at 1 and 7 days after a one-time artificial mitochondrial transplantation. ***P ≤ 0.001 (n = 6 at day 1, n = 10 at day 7; unpaired two-tailed t-test). d, Post-mitochondrial transplantation, mitoAT-ECs exposed to 200 μM H2O2 for 12 h were analysed for apoptosis using flow cytometry (PI/Annexin-V staining), with non-transplanted ECs as controls. e, Percentage of apoptotic (Annexin-V+) ECs post H2O2 exposure. **P ≤ 0.01, ***P ≤ 0.001 (n = 3-4; one-way ANOVA with Bonferroni’s post-test). f, A standard wound closure assay depicts migration capacity, with wound areas at 0 h and 12 h in mitoAT-ECs compared to control ECs. g, Quantification of wound gap closure in mitoAT-ECs transplanted with mitochondria from various donors, indicating improved closure rates, ***P ≤ 0.001 (n = 3; one-way ANOVA followed by Bonferroni’s post-test). h, Relative ATP production levels in ECs measured 24 h after receiving different concentrations of mitochondria (mitoAT-ECs). ECs without mitochondrial transfer served as control. *P ≤ 0.05, **P ≤ 0.01, ***P ≤ 0.001 compared to control (n = 3–7; unpaired two-tailed t-test). i, Comparison of ATP production in ECs transplanted with exogenous mitochondria (mitoAT-ECs) or lysosomes (lysoAT-ECs). **P ≤ 0.01, ***P ≤ 0.001 (n = 10; one-way ANOVA with Bonferroni’s post-test). j, Histological evaluations of subcutaneous grafts with lysoAT-ECs at 7 days post-transplantation. Scale bar, 100 μm. Quantitative analysis of microvascular density displaying reduced vascularization potential (n = 4). All data are mean ± s.e.m. n are biological replicates (b,c,e,g,h,i) and independent animals (j).
Extended Data Fig. 7 ∣
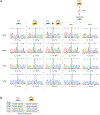
Extended Data Fig. 7 ∣. Temporal analysis of mtDNA heteroplasmy in mitoAT-ECs after mitochondrial transplantation.
a, mtDNA sequencing showcases four specific loci with heteroplasmy in hypervariable regions, highlighting a single nucleotide difference between ECs and MSCs. Depicted sequences represent ECs (monoculture), MSCs (monoculture), ECs + MSCs (1:1 co-culture), and mitoAT-ECs (monoculture) for the chosen loci. b, Summary table detailing heteroplasmy at four loci in the hypervariable mtDNA regions across ECs and MSCs.
Extended Data Fig. 8 ∣
Extended Data Fig. 8 ∣. Quantitative flow cytometry analysis of exogenous mitochondrial integration using the split-GFP system.
a, Schematic of the split-GFP system, with GFP-1–10 in EC mitochondria and GFP-11 in mitoRed-MSCs. Fluorescence signals fusion between MSC-derived and EC mitochondria. b, Flow cytometry gating strategy for mitochondria, using size-specific microbeads as reference. c, Flow cytometry analysis of isolated mitochondria illustrating the proportion of non-fused DsRed+ (red box) and fused DsRed+GFP+ (yellow box) mitochondria across experimental groups. d, Mitochondrial integration post-transplantation analysis. Proportions of DsRed+ (red box) and DsRed+GFP+ (yellow box) in mitoAT-EC-derived mitochondria assessed at 24 h post-transplantation, with EC-derived mitochondria as the negative control. Representative flow cytometry data showing a dose-dependent increase in DsRed+ mitochondria at 24 h with double (×2) and quadruple (×4) transplanted mitochondria, consistently <0.1% GFP+.
Extended Data Fig. 9 ∣
Extended Data Fig. 9 ∣. Transplantation of mtDNA-free mitochondria enhances ATP in ECs.
a, Diagram illustrating the engineering of mtDNA-free cells (mitoRed-ρ0) using a Dox-regulated MTS-EcoRI-GFP complex for mtDNA degradation. b, PCR gel confirms the thorough depletion of mtDNA in the mitoRed-ρ0-293T cell line after a 48-hour Dox treatment. c, Transplantation of mtDNA-free mitochondria from mitoRed-ρ0-MSCs into ECs. Quantification of ATP production in both ECs and mitoAT-ECs. *P ≤ 0.05, ***P ≤ 0.001 (n = 3; one-way ANOVA with Bonferroni’s post-test). d, Transplantation of normal and mtDNA-free mitochondria into ρ0-ECs. ATP production in ρ0-ECs measured before and 24 h after exogenous mitochondrial transplantation. ***P ≤ 0.001 (n = 4, ECs; n = 8, ρ0-ECs; n = 8, mitoAT-ECs with normal mito; n = 6, mitoAT-ECs with mtDNA-free mito; one-way ANOVA followed by Bonferroni’s post-test). All data are mean ± s.e.m. n are biological replicates (c,d).
Extended Data Fig. 10 ∣
Extended Data Fig. 10 ∣. Exogenous mitochondrial transplantation induces mitophagy in mitoAT-ECs.
a, Analysis of autophagic flux in mitoAT-ECs, showing LC3B-I to LC3B-II conversion with Bafilomycin A1. b, Flow cytometry analysis showing PINK1 presence on isolated mitochondria from control MSCs (shCTR-MSCs) but not from shPINK1-MSCs. Quantification of the percentage of PINK1-positive in isolated mitochondria from control versus shPINK1-MSCs. ***P ≤ 0.001 (n = 4; unpaired two-tailed t-test). c, Western blot analysis demonstrating the presence of PINK1 (63 kDa) in lysates from both MSCs and isolated mitochondria (red line box), with TOM20 (16 kDa) as a mitochondrial marker and GAPDH (36 kDa) as a cytosolic control. d, Immunofluorescence indicates co-localization of exogenous DsRed+ mitochondria (Red) with endogenous Parkin (Alexa 647) in mitoAT-ECs 24 h post-transplantation (white arrows). Scale bar, 100 μm; insets #1–4, 10 μm. e–h, Evaluation of MSC viability and functionality after PINK1 silencing (shRNA). e, Morphological observations of MSCs with shRNA against PINK1 (shPINK1-MSCs) vs. control shRNA (shCTR-MSCs) show standard mesenchymal cell morphology. Scale bar, 100 μm. f, Flow cytometry using PI/Annexin-V highlights the high viability of shPINK1-MSCs after lentiviral transduction (n = 4). g, qPCR analysis measures angiogenic growth factor expression (ANGPT, CXCL12, VEGF) in shCTR-MSCs vs. shPINK1-MSCs (n = 4; unpaired two-tailed t-test). h, In vitro assay of EC vascular network formation, using conditioned medium (CM) from shPINK1-MSCs vs. shCTR-MSCs (n = 4; unpaired two-tailed t-test). Scale bar, 200 μm. i, Immunofluorescence detection of LC3B+ autophagosomes in mitoAT-ECs. Effects of Parkin and PINK1 silencing (shRNA) in either the donor MSC mitochondria (mito) or recipient ECs. DAPI denotes cell nuclei. Scale bar, 10 μm. All data are mean ± s.e.m. n are biological replicates (b,f,g,h). For gel source data, see Supplementary Fig. 1.
Fig. 1 ∣
Fig. 1 ∣. MSCs facilitate EC engraftment through mitochondrial transfer.
a, Illustration of mitoRed-MSCs with ECs in mice, showing TNTs with DsRed+ mitochondria at 24 h. b, hCD90hCD31+ ECs with DsRed+ mitochondria (mitoRed-ECs) identified by flow cytometry and immunofluorescence; CD90 identifies MSCs. c, Quantification of TNTs containing DsRed+ mitochondria in MSC–EC co-cultures. The effects of anti-TNF antibody treatment or TNFAIP2 silencing are shown (n = 3; one-way ANOVA with Bonferroni’s post-test). d, Quantification of ECs receiving DsRed+ mitochondria from shTNFAIP2-MSCs or control shCTR-MSCs (n = 5; unpaired two-tailed t-test). e, Temporal analysis of DsRed+ mitochondria in ECs after engraftment. UEA1+ ECs show mitoRed at day 7, and this is absent by day 14. TNF triggers the reactivation of mitoRed transfer (n = 3; one-way ANOVA with Bonferroni’s post-test). f,g, Bioluminescence of lucif-EC and MSC grafts at day 7. f, The effects of TNFAIP2 and MIRO1 silencing on EC engraftment were assessed. g, Quantification at day 7 (n = 4; paired two-tailed t-test). h, H&E-stained grafts at day 7, revealing blood vessels (arrowheads) after TNFAIP2 and MIRO1 silencing. i, Microvessel perfusion density at day 7 (n = 4–8; one-way ANOVA with Bonferroni’s post-test). j, Schematic of twenty-four-hour co-culture of ECs and mitoRed-MSCs; CD31+DsRed+ mitoT-ECs were FACS sorted. H&E staining of grafts implanted in mice shows day-7 perfused vessels (arrowheads). k, Perfused microvessel density at day 7 (n = 3; unpaired two-tailed t-test). l, Grafts (mitoT-ECs) at day 7, immunostained for human-specific vessels (UEA1+hVimentin+; arrowheads, asterisk). Data are mean ± s.e.m.; n are biological replicates (c,d) and independent animals (e,g,i,k); *P ≤ 0.05, **P ≤ 0.01, ***P ≤ 0.001. Scale bars, 10 μm (a,b); 50 μm (e,l); 100 μm (h,j). Related results in Extended Data Figs. 1-4.
Fig. 2 ∣
Fig. 2 ∣. Exogenous mitochondrial transplantation enhances EC engraftment.
a, Diagram of the mitochondrial isolation and transplantation process. b, Seahorse analysis shows enhanced respiration in mitoAT-ECs 24 h after transplantation (n = 6). OCR, oxygen consumption rate; OM, oligomycin; FCCP, carbonyl cyanide-p-trifluoromethoxyphenyl hydrazone; R&A, rotenone and antimycin A. c, ATP production from Seahorse analysis. ***P ≤ 0.001 (n = 6; unpaired two-tailed t-test). d–f, Functional comparison of ECs and mitoAT-ECs: ATP production (d), migration capacity (e) and apoptosis after H2O2 exposure (f). a.u., arbitrary units. ***P ≤ 0.001 (n = 3; unpaired two-tailed t-test). g, Bioluminescence imaging of grafts with ECs or mitoAT-ECs. h, Quantification at days 1, 3 and 7. **P ≤ 0.01, ***P ≤ 0.001 (n = 3; unpaired two-tailed t-test). i–k, Grafts with ECs or mitoAT-ECs implanted in mice. i, Macroscopic view at day 7. H&E staining shows perfused vessels (arrowheads) in mitoAT-EC grafts. j, Microvessel density at day 7. ***P ≤ 0.001 (n = 3; unpaired two-tailed t-test). k, Immunofluorescent staining of human-specific vessels at day 7 in mitoAT-EC grafts. l–p, Hindlimb ischaemia in mice injected with luciferase-labelled ECs or mitoAT-ECs. l, Bioluminescence images on days 1 and 7. **P ≤ 0.01 (n = 3; unpaired two-tailed t-test). m, Immunofluorescence of human vessels in ischaemic muscle with mitoAT-ECs (day 7). n, Laser Doppler images of ischaemic hindlimbs at three weeks. o, Blood flow quantified by laser Doppler. ***P ≤ 0.001, compared to ECs. #P ≤ 0.05, ##P ≤ 0.01, ###P ≤ 0.001, compared to no cells (n = 5; one-way ANOVA with Bonferroni’s post-test analysis). p, Mice with necrosis or intact legs in each group at three weeks (n = 5). Data are mean ± s.e.m.; n indicates biological replicates (b–f) and independent animals (h,j,l,o,p). Scale bars, 100 μm (i); 40 μm (k); 50 μm (m). Related results in Extended Data Figs. 5 and 6.
Fig. 3 ∣
Fig. 3 ∣. Transplanted mitochondria are not incorporated into the recipient pool.
a, Schematic of JC-10 assay for measuring mitochondrial depolarization. b, Changes in mitochondrial membrane potential (FL590/FL520 ratio) in MSC-derived mitochondria in Ca2+-free (C buffer) and Ca2+-containing (EGM2) medium (n = 5; unpaired two-tailed t-test). c, Heteroplasmy in mtDNA of ECs and MSCs. Left, mtDNA sequencing at a distinct locus showing a single-nucleotide difference between ECs and MSCs. Right, exogenous versus endogenous mtDNA in mitoAT-ECs was assessed by sequencing heteroplasmic sites at days 1 and 7 after transplantation (n = 4 loci; unpaired two-tailed t-test). d, Left, schematic of the split-GFP system with GFP-1–10 and GFP-11 in the mitochondrial matrix of ECs and mitoRed-MSCs, respectively. ITR, inverted terminal repeats of piggyBac transposon. Right, flow cytometry of mitoAT-EC mitochondria to detect fused DsRed+GFP+ mitochondria over time (time points are hours after mitochondria transplantation). e, mtDNA-free MSCs (mitoRed-ρ0-MSCs) with Dox-inducible MTS-EcoRI-GFP for mtDNA degradation, assessed by qPCR for mtDNA normalized to genomic DNA (gDNA) with or without Dox (n = 4; unpaired two-tailed t-test). f, Schematic of transplantation of mtDNA-free mitochondria into ECs. g,h, Comparison of ECs and mitoAT-ECs: ATP production (g) and migration (h) (n = 3; unpaired two-tailed t-test). i, Grafts of mtDNA-free mitoAT-ECs in mice. Macroscopic view at day 7. H&E staining reveals perfused vessels (arrowheads). j, Perfused microvessel density at day 7 (n = 3; unpaired two-tailed t-test). k, Human-specific (hVimentin+UEA1+) vessel immunofluorescence at day 7 (arrowheads). Data are mean ± s.e.m.; n indicates biological replicates (b,e,g,h) and independent animals (j); *P ≤ 0.05, ***P ≤ 0.001. Scale bars, 100 μm (i); 50 μm (k). Related results in Extended Data Figs. 7-9.
Fig. 4 ∣
Fig. 4 ∣. Insights into the enhancement of mitochondrial respiration and biogenesis in mitoT-ECs and mitoAT-ECs.
a–d, Bulk RNA-seq of EC samples (i) ECs with transplanted exogenous mitochondria (mitoAT-ECs); (ii) ECs gaining exogenous mitochondria through MSC co-culture (mitoT-ECs); and (iii) ECs in MSC co-culture without exogenous mitochondria uptake (unprimed ECs). a, Summary of differential gene expression. b, PCA. c,d, GO analysis (positive enrichment) for mitoT-ECs versus unprimed ECs (c) and for mitoAT-ECs versus unprimed ECs (d). Adjusted P values using Benjamini–Hochberg. e–g, Mitochondrial biogenesis after mitochondrial transplantation in mitoAT-ECs. e, Heat map of mRNA expression (qPCR) of mitochondrial biogenesis genes in mitoAT-ECs versus ECs. *P ≤ 0.05, **P ≤ 0.01 (n = 9 ECs and n = 9 mitoAT-ECs; unpaired two-tailed t-test). f, Mitochondrial content in mitoAT-ECs 24 h after transplantation, quantified by flow cytometry and normalized to nuclear protein, with pre-transplant ECs as control. g, Western blot evaluation of TOM20 for mitochondrial content in mitoAT-ECs. β-Actin was used as a housekeeping protein. Lysates from regular ECs and a mixture of ECs and exogenous mitochondria pre-transplantation (ECs + mito; not transplanted) served as controls. *P ≤ 0.05 (n = 3; one-way ANOVA with Bonferroni’s post-test; mean ± s.e.m.). n are biological replicates (a–e,g). For gel source data, see Supplementary Fig. 1.
Fig. 5 ∣
Fig. 5 ∣. Enhanced engraftment ability in ECs mediated by mitophagy.
a, Mitochondria isolated from mitoAPEX2-MSCs transplanted into ECs. TEM micrograph shows internalized APEX2+ mitochondria co-localizing with autophagosomes in mitoAT-ECs after 24 h. b, Immunofluorescent staining of LC3B+ autophagosomes in ECs and mitoAT-ECs. Starvation and mitochondrial transplantation increased LC3B+ autophagosomes in ECs. Inhibiting autophagy with 3-methyladenine (3-MA) or silencing ULK1 (shULK1) prevented LC3B+ autophagosome accumulation in mitoAT-ECs. c, Co-localization of exogenous DsRed+ mitochondria and LC3B+ autophagosomes in mitoAT-ECs. d, Effects of shRNA-mediated silencing of PINK1 or PRKN (encoding Parkin) on LC3B+ autophagosomes in mitoAT-ECs (n = 30 cells per group; one-way ANOVA with Bonferroni’s post-test). e–g, Effects of shRNA-mediated silencing of ULK1, PINK1 or PRKN on the engraftment ability of mitoAT-ECs. e, Macroscopic view of grafts at day 7. f, H&E-stained mitoAT-EC grafts show perfused vessels (arrowheads) at day 7. g, Microvessel density at day 7 (n = 4; n = 8 in ECs + mito; one-way ANOVA with Bonferroni’s post-test). h, Schematic showing the roles of Parkin (recipient ECs) and PINK1 (donor mitochondria) in mitophagy activation in mitoAT-ECs. i–k, Effects of silencing PINK1 and PRKN on the engraftment ability of ECs co-implanted with MSCs. i, Bioluminescence of grafts with lucif-ECs and MSCs at day 7. PRKN silenced in ECs (left) and PINK1 silenced in MSCs (right). Quantification at day 7 (n = 4; paired two-tailed t-test). j, Macroscopic views and H&E staining of grafts with perfused vessels (arrowheads) at day 7. k, Microvessel density at day 7 (n = 4; paired two-tailed t-test). Data are mean ± s.e.m.; n are independent animals (g,i,k); *P ≤ 0.05, **P ≤ 0.01, ***P ≤ 0.001. Scale bars, 50 nm (a); 10 μm (b,c); 50 μm (f); 100 μm (j). Related results in Extended Data Fig. 10.

Comment in

References

    1. Nowbar AN, Gitto M, Howard JP, Francis DP & Al-Lamee R Mortality from ischemic heart disease. Circ. Cardiovasc. Qual. Outcomes 12, e005375 (2019). - PMC - PubMed
    1. Loffredo F & Lee RT Therapeutic vasculogenesis. Circ. Res 103, 128–130 (2008). - PMC - PubMed
    1. Melero-Martin JM et al. Engineering robust and functional vascular networks in vivo with human adult and cord blood-derived progenitor cells. Circ. Res 103, 194–202 (2008). - PMC - PubMed
    1. Beckman JA, Schneider PA & Conte MS Advances in revascularization for peripheral artery disease: revascularization in PAD. Circ. Res 128, 1885–1912 (2021). - PubMed
    1. Carmeliet P & Jain RK Molecular mechanisms and clinical applications of angiogenesis. Nature 473, 298 (2011). - PMC - PubMed

MeSH terms