. 2025 Nov;647(8088):179-186.
doi: 10.1038/s41586-024-07234-1. Epub 2024 May 1.

Chromatin accessibility during human first-trimester neurodevelopment

Affiliations

Chromatin accessibility during human first-trimester neurodevelopment

Camiel C A Mannens et al. Nature. 2025 Nov.

Abstract

The human brain develops through a tightly organized cascade of patterning events, induced by transcription factor expression and changes in chromatin accessibility. Although gene expression across the developing brain has been described at single-cell resolution1, similar atlases of chromatin accessibility have been primarily focused on the forebrain2-4. Here we describe chromatin accessibility and paired gene expression across the entire developing human brain during the first trimester (6-13 weeks after conception). We defined 135 clusters and used multiomic measurements to link candidate cis-regulatory elements to gene expression. The number of accessible regions increased both with age and along neuronal differentiation. Using a convolutional neural network, we identified putative functional transcription factor-binding sites in enhancers characterizing neuronal subtypes. We applied this model to cis-regulatory elements linked to ESRRB to elucidate its activation mechanism in the Purkinje cell lineage. Finally, by linking disease-associated single nucleotide polymorphisms to cis-regulatory elements, we validated putative pathogenic mechanisms in several diseases and identified midbrain-derived GABAergic neurons as being the most vulnerable to major depressive disorder-related mutations. Our findings provide a more detailed view of key gene regulatory mechanisms underlying the emergence of brain cell types during the first trimester and a comprehensive reference for future studies related to human neurodevelopment.


Conflict of interest statement

Competing interests: S.L. is a paid scientific adviser to Moleculent, Combigene and the Oslo University Center of Excellence in Immunotherapy. All other authors declare no competing interests.

Figures

Fig. 1
Fig. 1. Atlas overview.
a, Overview of experimental design. Dissected samples were processed using scATAC-seq and single-cell multiome sequencing to infer gene-regulatory relationships throughout early development across the human brain. Illustration by Ivana Kapustova. bd, t-SNE embedding plot of developmental ages (b), regional identities (c) and cell classes (d). PCW, post-conception week. e, Proportions of cell class by age and anatomical region. f, Top to bottom: per-cluster regional distribution of cell types (legend in c); distribution of ages (legend in b); assigned cell class (legend in d); aggregated gene activity by cluster based on region co-accessibility; gene expression of the same genes; TF motif enrichment (HOMER; one-sided; no multiple test correction) in the top 2,000 most enriched accessible regions per cluster (by Pearson residual enrichment). For the accessibility scores and gene expression, the dot size represents percentage of positive cells. For motif enrichment, the dot size represents the P value and colour indicates corresponding expression of the TF (trinarization score; a probabilistic score of whether a gene is expressed). OPCs, oligodendrocyte progenitor cells; VLMCs, vascular lepotomeningeal cells; max., maximum.
Fig. 2
Fig. 2. Functional annotation of open chromatin regions.
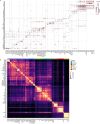
a, Number of accessible regions by cell class, split between biological samples. n = 26 biologically independent samples (17 samples at <10 post-conception weeks and 9 samples >10 post-conception weeks). Box plots are centred on the median, the box represents the first to third quartiles and the whiskers extend to the minima and maxima with a maximum of 1.5× the interquartile range; points beyond this range are plotted as outliers. b, TF motifs in regions that are differentially accessible early or late in the dataset (P < 0.05; Benjamini–Hochberg-corrected one-sided Fisher exact test). c, Enrichment comparison between the gene expression and chromatin accessibility components of the dataset. A moving threshold was used to identify the fraction of features enriched in at least one cluster at different levels of stringency. d, Selection of marker gene expression and accessible marker regions. Accessible regions are limited to top 2,000 per cluster. OCRs, open chromatin regions. e, t-SNE plot in which dots represent accessible regions and are coloured by highest-scoring topic. A strong enrichment of promoter regions in the top right of the second plot shows constitutively active elements. f, t-SNE plots of topics 9 and 18. Both were enriched for CTCF-binding sites and grouped together on the t-SNE map. g, Enriched TF-binding motifs in topics 9 and 18 identified using HOMER (one-sided; no multiple test correction). h, t-SNE plots of nuclei showing enrichment of Gene Ontology signatures enriched in topics 4 and 25 (shown in e), identified using the Genomic Regions Enrichment for Annotation Tool. i, Arche-motif enrichment for a subset of topics. Dot size represents enrichment (identified using HOMER; one-sided; no multiple test correction). The arche-motifs contain binding sites for the following TFs (non-exhaustive)—HD/19: OTX1/2; MEIS: MEIS2/3; HD/2: HOXA2/LBX2; TFAP2/1: TFAP2A/B; NFI/3: NFIA/C; Ebox/CAGATGG: PTF1A/NEUROD1/2/ATOH1; SOX/4: SOX4/10; FOX/4: FOXA1/2/FOXP2; SPI: SPI1/SPIB/C; ETS/1: ELF1/3/5/GABPA; NFY: NFYA/B/C; RFX/1: RFX1/2/3/4.
Fig. 3
Fig. 3. CNN predicts neuron type from sequences.
a, Network layout. Enriched sequences for each cell type are one-hot-encoded and used to train a CNN network with four convolutional layers and two dense layers. The loadings of the convolutional layers are used to calculate the contribution of each of the nucleotides in the original sequence and recurrent patterns can be clustered to find driving TF motifs. b, ROC curves for each of the classes and mean ROC AUC of all classes. In a random classification model, the ROC AUC is 0.5. c, Dot plot representing expression of each of the TFs in d. Dot size represents the fraction of non-zero nuclei and the colour represents the expression level. HB, hindbrain; glut., glutamatergic; Tel., telencephalon; MB, midbrain. d, t-SNE map showing the selected classes. For each of the classes a subset of the characteristic motifs is shown. The identity of motifs was determined by the binding motif and expression of the corresponding TF in the corresponding class.
Fig. 4
Fig. 4. Gene regulatory dynamics in Purkinje neurons.
a, t-SNE map of Purkinje neurons showing pseudotime and the differentiation trajectory. b, TFs involved in the gene regulatory network as identified using DELAY. The nodes are sized by centrality. c, t-SNE map of nuclei simulated from the DELAY network using BoolODE. Colour represents the expression of NHLH2, LHX5 and ESRRB. d, Heat maps of Purkinje marker genes expressed along the pseudotime trajectory and the corresponding prediction based on the DELAY network. e, Trend lines of important factors in ESRRB gene progression. The vertical lines mark important events. Top to bottom: expression of LHX5 and TFAP2B; accessibility of cCREs regulating ESRRB; expression of the ESRRB gene; and enrichment of the ESRRB-binding site in target peaks. f, Chromatin accessibility landscape around the ESRRB gene. Nine cCREs were identified to regulate ESRRB expression. Two are highlighted that occur close to each other but open up at different stages in differentiation. g, The contribution scores of two cCREs regulating ESRRB expression (an early and a late cCRE), corresponding to the marked peaks in f. The top plot shows the contribution score (importance of nucleotide for prediction); the bottom plot shows the effect of mutating each nucleotide variant of a region on the prediction score (saturation mutagenesis). The early example contains two binding sites for TFAP2B, whereas the late cCRE contains an LHX5-binding site.
Fig. 5
Fig. 5. Enrichment of psychiatric SNPs in first-trimester central nervous system cell types.
a, −log10[P values] for neuropsychiatric phenotypes derived from stratified linkage disequilibrium score regression analysis (one-sided). Asterisks indicate significant (FDR or Bonferroni) differences. Only cell types reaching significance in one of the phenotypes are plotted. ADHD, attention-deficit hyperactivity disorder. CGE, caudal ganglionic eminence; LGE, lateral ganglionic eminence; MGE, medial ganglionic eminence. b, MAGMA −log10[P values] for gene-associated cCREs with the Benjamini–Hochberg α set at 1.2 × 104. c, Enriched TF-binding motifs in the MDD-associated SNPs passing Bonferroni correction (HOMER; one-sided; no multiple test correction). MEIS2, OTX2 and GATA2 are TFs strongly associated with midbrain inhibitory neurons. d, The contribution scores of region chr 6: 28,885,244–28,885,645, which contains rs114155007, one of the SNPs associated with MDD.
Extended Data Fig. 1
Extended Data Fig. 1. Quality control.
A) Collected nuclei counts per post-conceptual week (p.c.w.) and region. B) Distribution of fragment count (log10) and fraction of fragments in TSS for collected barcodes. C) t-SNE embedding generated from Latent Semantic Indexing without Harmony sample correction (top) and with sample correction (bottom). D) fragment size distribution per sample. Top plot shows log scaled density. E) TSS enrichment per sample. 5 was used as a minimum sample level cut-off. F) Distribution of TSS enrichment across nuclei per sample. n = 26 biologically independent samples (number of cells per sample in H). Box plots within the violins are centered on the median, the box represents the first to third quartiles and the whiskers extend to the minima/maxima with a maximum of 1.5x the interquartile range, points beyond this range are plotted as outliers. G) Fragment count (log10) across nuclei per sample. n = 26 biologically independent samples. Boxplot representations follow the same rules as F. H) Number of nuclei collected per sample, separated by method.
Extended Data Fig. 2
Extended Data Fig. 2. Analysis pipeline.
Steps taken to analyze single nucleus data. Following quality control the dataset is clustered using genomic bins as features. Peak calling is then performed per cluster and a nucleus-by-peak matrix is generated and nuclei are clustered. The available multiome nuclei are then used to impute gene expression across the dataset. Downstream analysis is performed including motif enrichment analysis and region-to-gene linkage before splitting the dataset by cell class. Each subset is reclustered and reanalyzed separately before being pooled together again using the subset clusters and a final analysis round is conducted.
Extended Data Fig. 3
Extended Data Fig. 3. Annotation of accessible chromatin regions.
A) Distribution of functional region annotations in relation to nearby genes. B) Distribution of accessible region distance to nearest TSS. C) Jaccard similarity between region-specific enhancers from the VISTA database and accessible regions identified in corresponding regions of the dataset. D) Spatially restricted accessibility of developmental enhancers overlapping with known enhancer sequences from the VISTA enhancer-database shown by LacZ staining. From left to right, active in Hindbrain neurons and glioblasts, immature interneurons in the Ganglionic Eminence and Midbrain radial glia and inhibitory neurons. E) Mean DNA conservation of proximal (<2,000 bp from TSS) and distal elements based on the PhastCon 100-way. F) Number of accessible regions that overlap with the ENCODE cCRE and DNAse hypersensitive site reference datasets. Additionally the number of elements that overlap with the human enhancer atlas fetal brain dataset. Red shows regions not in the reference dataset, gray are overlapping regions. G) Overlap between the identified accessible regions in this study (development) and a comparable study in the adult human brain (Li et al., 2022 under revision). The second panel shows the overlap between variable regions in the two datasets (pearson residuals > 10 in at least one cluster). Interestingly, a large number of regions that are variable in development seem to be invariable in adult. H) Overlap with two sets of evolutionarily accelerated regions, with overlap in blue and regions from the comparison list not in our dataset in gray. Human accelerated regions (HARs) are regions with increased rates of nucleotide substitution that are conserved in other species, while human ancestor quickly evolved regions (HAQERs) are regions that diverged rapidly between humans and chimpanzees that were not previously constrained. I) Overlap with annotated transposable elements. J) Comparison of transposable elements in early vs. late nuclei across the dataset. K) Heatmap of region topics across the 135,00 nuclei included in the topic modeling. Bottom images in d reproduced from ref. , https://enhancer.lbl.gov.
Extended Data Fig. 4
Extended Data Fig. 4. Regionalization of cell types.
A) Annotation of region of origin for each cell class. While clear effects of regionalization can be seen in the neural lineage, the non-neuronal nuclei are more similar across brain regions. B) Expression of canonical markers used to annotate radial glia, glioblasts, the roof plate and the floor plate. C) Distribution of radial glia and glioblasts between brain regions. D) tSNE showing change in abundance of early vs. late nuclei in local neighborhoods among radial glia and glioblasts. E) Volcano plot of change in abundance of early vs. late nuclei in local neighborhoods among radial glia and glioblasts as identified using milopy. F) Enriched transcription factor motifs (HOMER; one-sided; no multiple test correction) among the 2,000 most enriched accessible regions between early and late neighborhoods (by pearson residual). G) Boxplot showing the number of accessible regions identified in different cell types. Neuroblasts and neurons have significantly more accessible regions than radial glia (two-sided independent t-test; neuroblast: t = 3.6; CI = 8,343-30,358; Cohen’s D = 1.13; 38 DF; p = 0.001; neurons: t = 2.5; CI: 2,485-22,706; Cohen’s D = 0.77; 43 DF; p = 0.015). n = 26 biologically independent samples, the number of cells in each class were 57,210, 160,928, 69,716, 141,189, 83,800 and 13,251 respectively. Box plots are centered on the median, the box represents the first to third quartiles and the whiskers extend to the minima/maxima with a maximum of 1.5x the interquartile range, points beyond this range are plotted as outliers. H) Linear regression fitted to age to predict number of accessible regions using the cell types as covariates (t-test; two-sided; p-values in figure).
Extended Data Fig. 5
Extended Data Fig. 5. Cluster annotation.
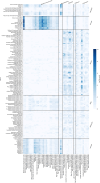
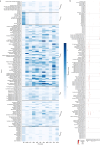
A) Extended motif enrichment plot of all clusters (HOMER; one-sided; no multiple test correction). Dot size represents -log p-value of the motif enrichment. The color represents expression level. B) Correlation between cell types based on marker peak accessibility. The colorbar at the top represents the assigned cell class.
Extended Data Fig. 6
Extended Data Fig. 6. Gene expression imputation.
A) Comparison between cell type specificity of marker genes in gene expression and gene accessibility space. Top 5 enriched genes were selected for each cluster in both modalities and the union was used for plotting. B) Correlation between expression and accessibility of each selected marker gene. C) Maximum log fold change of marker versus median expression. The genes with RNA enrichment of zero are not expressed. D) Distribution of scATAC-seq and multiomic nuclei across the tSNE embedding. E) Leave-one-out validation of imputed expression. Predicted versus true expression of CA8. F) Top 100,000 gene-cluster expression pairs true vs imputed expression pairs.
Extended Data Fig. 7
Extended Data Fig. 7. Additional figures related to TF CNN model.
A) Expression of DMBX1 in this dataset and Braun et al., B) Additional cCREs upstream of ESRRB.
Extended Data Fig. 8
Extended Data Fig. 8. Enrichment of selected UK Biobank traits in neurodevelopmental cell types.
Each trait is assigned to a group of related traits (Immune, blood pressure, cognitive, hayfever and psychiatric) and LDSC analysis (one-sided) is used to identify susceptible cell types. Nuclei are ordered by major cell class. Most traits show the expected enrichment pattern.
Extended Data Fig. 9
Extended Data Fig. 9. Enrichment of selected psychiatric phenotypes in neurodevelopmental cell types.
A) Nuclei are ordered by major cell class and LDSC analysis (one-sided) is used to identify susceptible cell types. While not reaching significance after multiple test correction, an increased association between Alzheimer’s disease and immune cells can be observed in opposition to the other traits which primarily are associated with neuronal cells. B) Expression of transcription factors identified in Fig. 5c.

References

    1. Braun, E. et al. Comprehensive cell atlas of the first-trimester developing human brain. Science382, eadf1226 (2023). - PubMed
    1. Ziffra, R. S. et al. Single-cell epigenomics reveals mechanisms of human cortical development. Nature598, 205–213 (2021). - PMC - PubMed
    1. Trevino, A. E. et al. Chromatin and gene-regulatory dynamics of the developing human cerebral cortex at single-cell resolution. Cell184, 5053–5069 (2021). - PubMed
    1. Domcke, S. et al. A human cell atlas of fetal chromatin accessibility. Science370, eaba7612 (2020). - PMC - PubMed
    1. Siletti, K. et al. Transcriptomic diversity of cell types across the adult human brain. Science382, eadd7046 (2023). - PubMed

LinkOut - more resources