. 2024 May;629(8012):652-659.
doi: 10.1038/s41586-024-07336-w. Epub 2024 May 1.

Paternal microbiome perturbations impact offspring fitness

Affiliations

Paternal microbiome perturbations impact offspring fitness

Ayele Argaw-Denboba et al. Nature. 2024 May.

Abstract

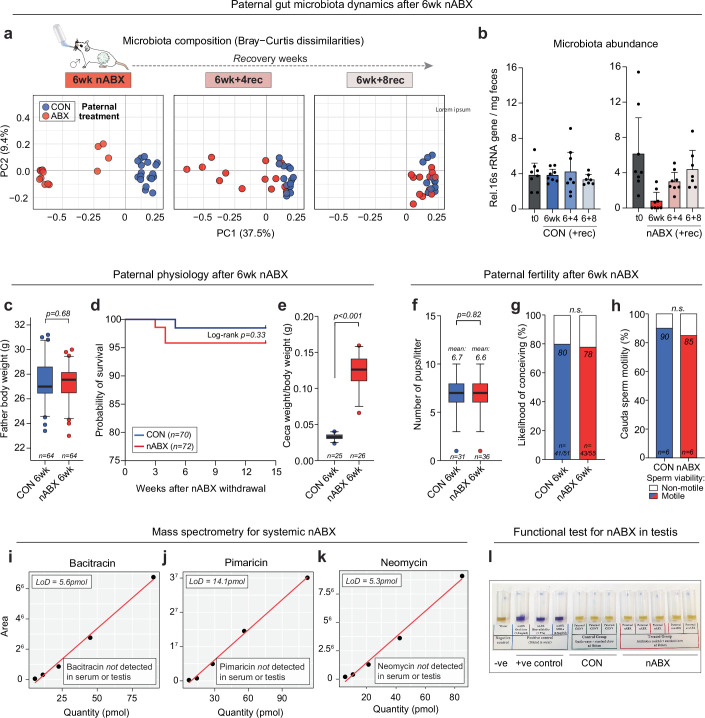
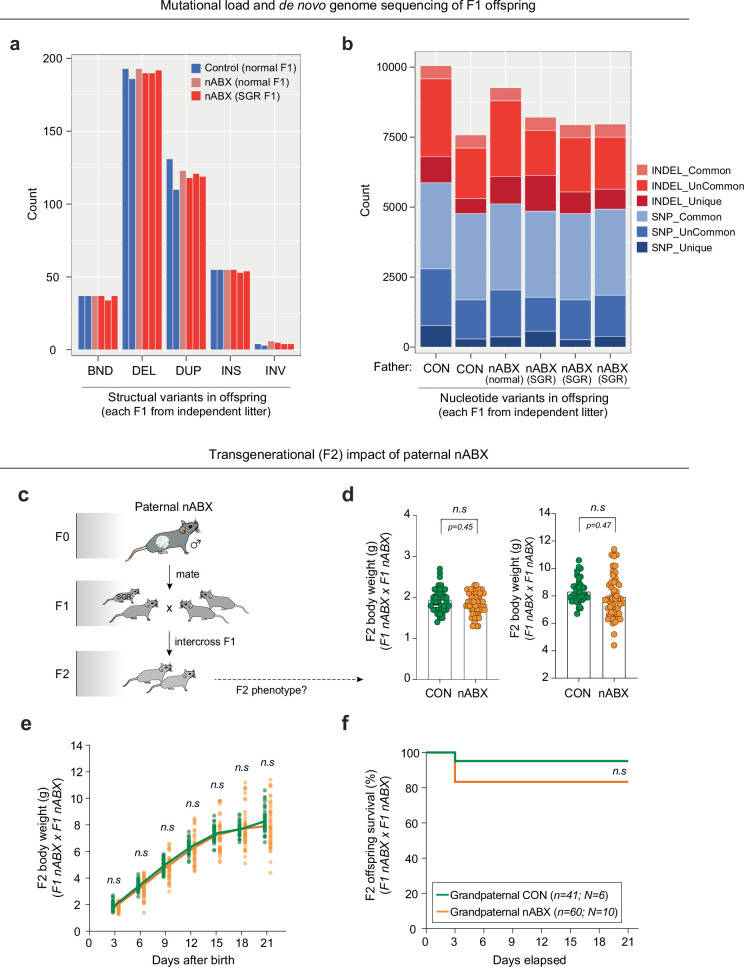
The gut microbiota operates at the interface of host-environment interactions to influence human homoeostasis and metabolic networks1-4. Environmental factors that unbalance gut microbial ecosystems can therefore shape physiological and disease-associated responses across somatic tissues5-9. However, the systemic impact of the gut microbiome on the germline-and consequently on the F1 offspring it gives rise to-is unexplored10. Here we show that the gut microbiota act as a key interface between paternal preconception environment and intergenerational health in mice. Perturbations to the gut microbiota of prospective fathers increase the probability of their offspring presenting with low birth weight, severe growth restriction and premature mortality. Transmission of disease risk occurs via the germline and is provoked by pervasive gut microbiome perturbations, including non-absorbable antibiotics or osmotic laxatives, but is rescued by restoring the paternal microbiota before conception. This effect is linked with a dynamic response to induced dysbiosis in the male reproductive system, including impaired leptin signalling, altered testicular metabolite profiles and remapped small RNA payloads in sperm. As a result, dysbiotic fathers trigger an elevated risk of in utero placental insufficiency, revealing a placental origin of mammalian intergenerational effects. Our study defines a regulatory 'gut-germline axis' in males, which is sensitive to environmental exposures and programmes offspring fitness through impacting placenta function.


Conflict of interest statement

The authors declare no competing interests.

Figures

Fig. 1
Fig. 1. Paternal gut dysbiosis probabilistically triggers major F1 phenotypes.
a, Schematic showing the strategy for induced paternal dysbiosis and recovery using nABX. b, Quantification of microbial taxa richness in males after 6 weeks of nABX treatment and during the recovery (rec) time course, by 16S rRNA sequencing (CON t0 = 18, 6 wk = 18, 6 wk + 4 rec = 14, 6 wk + 8 rec = 11; nABX t0 = 19, 6 wk = 12, 6 wk + 4 rec = 13, 6 wk + 8 rec = 12 individuals per timepoint). Bar represents median, whiskers 1.5× interquartile range. c, Body weight of F1 offspring at postnatal days P3 and P15 according to paternal nABX treatment. P value by two-tailed nested (hierarchical) t-test (CON n = 172, nested into N = 26 fathers; nABX n = 181 nested into N = 28 fathers). Bar indicates mean. d, Representative images of SGR phenotype in F1 offspring from dysbiotic fathers (nABX-treated). e, Forest plot showing the log OR of risk for abnormal body-weight classes in offspring that survive to P15. Null effect is represented by a vertical line for which OR value is 1. Whiskers indicate 95% CI, P value by two-sided Chi-square test (mortality P = 0.0001; SGR P = 0.044). f, Kaplan–Meier plot showing postnatal survival of F1 progeny depending on paternal nABX treatment regime (CON n = 179; nABX n = 199). P value by Mantel–Cox (log-rank) test. g, PCA of transcriptomes from F1 brains derived from control or nABX sires. The nABX offspring are stratified by normal or SGR phenotype. SGR not observed in control offspring. h, Heatmap showing expression of top upregulated and downregulated genes in F1 SGR brains, from independent litters sired by nABX-treated fathers. i, Left, OR of F1 susceptibility for abnormal body weight and mortality when sired by males with dysbiosis induced by 6 weeks of treatment with general antibiotics (avaABX). Whiskers indicate 95% CI, P value by two-sided Chi-square test (mortality P = 0.014; SGR P = 0.038). Right, Kaplan–Meier plot showing postnatal survival of F1 progeny from avaABX-treated males. j, Left, OR of F1 risk for abnormal body weight when sired by males with dysbiosis induced by 6 weeks of bowel cleansing with PEG laxative. Whiskers indicate 95% CI, P value by two-sided Chi-square test (mortality P = 0.013; SGR P = 0.014). Right, Kaplan–Meier plot showing survival of F1 progeny from PEG-treated males. n, offspring; N, litters; ND, not detected. Source Data
Fig. 2
Fig. 2. Recovery of paternal gut microbiota rescues susceptibility to F1 phenotypes.
a,b, Growth curves of F1 offspring sired by males during a time course of nABX withdrawal which still retain gut microbiota dysbiosis (6 wk + 4 rec) (a) and offspring of the same males after microbiota recovery (6 wk + 8 rec) (b), as well as aged-matched control sires. Line indicates mean, P value by nested (hierarchical) two-tailed t-test. c,d, Kaplan–Meier plot showing postnatal survival of F1 progeny sired by dysbiotic (c) or recovered nABX males (d). P value by Mantel–Cox (log-rank) test. e, Forest plots showing OR of F1 susceptibility to abnormal body weight and premature mortality when sired by dysbiotic (6 wk, 6 wk + 4 rec) or recovered males (6wk + 8 rec). Null effect is represented by a vertical line for which the OR value is 1. Whiskers indicate 95% CI, P value by two-sided Chi-square test (mortality: 6 wk P = 0.0001, 6 wk + 4 rec P = 0.0014, 6 wk + 8 rec P = 0.76; SGR: 6 wk P = 0.044, 6 wk + 4 rec P = 0.020, 6 wk + 8 rec P = 0.99). f, PCA of transcriptomes from F1 SGR adipose tissue sired by 6 wk or 6 wk + 4 rec nABX or control males, each from several independent litters. g, Gut microbiota richness of offspring (left) is not affected by paternal gut microbial status and does not correlate with F1 phenotype. Paternal microbiota richness (right) does correlate with F1 offspring phenotype. Shaded areas indicate 95% CI. h,i, Left, neonatal F1 body weight following IVF of isogenic oocytes using control or nABX-treated sperm donors. Right, F1 body-weight distribution at P15 following IVF. Data are independently derived from CD1 strain surrogate mothers (CON n = 66 offspring, nested into N = 12 fathers; nABX n = 75, nested into N = 12) (h) or BL6 strain surrogate mothers (CON n = 33 offspring, nested into N = 8 fathers; nABX n = 41, N = 7 fathers) (i). P value by nested (hierarchical) two-tailed t-test. Source Data
Fig. 3
Fig. 3. Testicular responses to gut microbiota dysbiosis indicate a regulatory gut–germline axis.
a, Boxplot showing testis mass to body weight ratio after 6 weeks of nABX treatment in males. Bar represents median and whiskers indicate 5th–95th percentile. P value by unpaired two-tailed t-test (CON n = 31; nABX n = 32). b, Representative haematoxylin and eosin stained histological sections of testes from control and nABX males. Seminiferous tubules from dysbiotic males show incidence of vacuoles formed by loss of epithelium and absence of mitotic (spermatogonial) compartments. Asterisks indicate abnormal tubules. c, Quantification of abnormal testis tubules in control and dysbiotic males. P value by nested Mann–Whitney test (CON n = 54 sections, nested into N = 4 males; nABX n = 72, N = 5; P = 0.032). Bar represents median and whiskers indicate 5th–95th percentile. d, Quantification of epithelial thickness of seminiferous tubules. P value by nested t-test (CON n = 854 tubules, N = 4 males; nABX n = 1,061, N = 4; P = 0.016). Bar represents median and whiskers indicate 5th–95th percentile. e, PCA of untargeted metabolomics profiles from independent testis of control or dysbiotic males (6 wk, 6 wk + 4 rec) and after gut microbiome recovery (6 wk + 8 rec). f, Volcano plot highlighting differentially abundant metabolites in testes after 6 weeks of nABX and during recovery to restore the gut microbiome. P value by two-tailed t-test adjusted for multiple testing. g, MA ((M (log2 ratio) and A (mean average)) plot showing gene expression changes in testes from independent (n = 5) nABX males. h, Quantitation of leptin hormone level in testes (left) and circulating plasma (right) of dysbiotic males after 6 weeks of nABX, by ELISA. Bar indicates mean with 95% CI whiskers. P value by unpaired two-tailed t-test (CON n = 9; nABX n = 9). i, Testes features in males that are leptin deficient (ob/ob) for 6 weeks and wild-type controls (WT n = 3; ob/ob n = 3). Left, haematoxylin and eosin stained tubule sections; stars indicate abnormal histo-architecture. Right, testis weight, P value by unpaired two-tailed t-test and bar indicates mean with 95% CI. j, Transcriptome PCA of blastocysts derived from leptin-deficient or control fathers. Data points represent single-embryos from duplicate independent IVF experiments, each with triplicate independent fathers and littermate fathers as controls. Scale bars, 100 μm (left panel) or 50 μm (right panel) (b); 50 μm (i). FC, fold change. Source Data
Fig. 4
Fig. 4. Paternal dysbiosis induces F1 placental insufficiency.
a, Left, heatmap showing DNA methylation levels across genomic features in sperm from control or nABX-treated males (n = 5 methylomes per condition) by whole-genome bisulfite-seq. Right, scatter plot of genome-wide DNA methylation (50 CpG tiles), with differential tiles highlighted. b, Heatmaps showing differential abundance of selected miRNA (left) and tRNA fragments (right) in pooled purified sperm from independent (n = 9) control or nABX males. c, PCA of transcriptomes from embryonic (E13.5) brain and placenta according to paternal exposure. d, PCA of placenta transcriptomes at E18.5 from independent litters. e, Volcano plot showing DEGs in E18.5 placenta sired by 6-week nABX-treated males. P value adjusted for multiple testing. f, Expression of key genes for placental development in E18.5 placenta. Bar indicates mean and whiskers are s.d. Each data point is an independent placenta (CON n = 5 placenta (3 litters); nABX n = 5 placenta (3 litters)). g, Ratio of fetal mass to placental mass at E18.5, depending on preconception paternal condition. Bar indicates mean, P value by unpaired two-tailed t-test (CON n = 82, nABX n = 53). h, Expression of biomarkers of pre-eclampsia (PE) in E18.5 placenta derived from nABX fathers. Bar indicates mean and whiskers are s.d. P value by multiple-testing corrected DESeq2. CON n = 5 placenta (3 litters); nABX n = 5 placenta (3 litters). i, Representative placenta sired by control or dysbiotic males (nABX), stained for DAPI (blue) and VE-cadherin (red) to demarcate the labyrinth zone (LZ). Quantification below shows LZ as a ratio of total area. Bars indicate mean ± 95% CI. Each data point is an independent placenta tissue section (CON n = 4 placenta (4 litters); nABX n = 6 placenta (6 litters)). JZ, junctional zone. P value by unpaired two-tailed t-test. j, Levels of placental growth factor (PLGF) protein (left), a marker of PE and the sFLT1/PLGF ratio (right), in F1 placenta depending on paternal regime. P value by two-tailed t-test. Bars indicate median. Each data point is an independent placenta (CON n = 12 placenta (7 litters); nABX n = 12 placenta (6 litters); avaABX n = 8 placenta (3 litters)). Asterisks indicate P values of 0.05 or less* and 0.0001 or less***. Scale bar, 100 μm. Prom, promoter. Source Data
Extended Data Fig. 1
Extended Data Fig. 1. Paternal microbiome and physiological responses to nABX-induced dysbiosis.
(a) Principal component analysis (PCA) showing gut microbiota composition (Bray–Curtis) in males after 6 weeks of nABX or in controls. Additional panels show gut microbiota composition after a 4- or 8- weeks recovery period following nABX withdrawal, demonstrating rescue of gut microbiota after 8 weeks nABX withdrawal. (b) qPCR quantifying the total abundance of microbes after 6wk nABX and following 4- and 8- weeks recovery (+rec), determined by 16S rRNA. (CON t0 = 8, 6wk = 8, 6wk + 4rec = 8, 6wk + 8rec = 7; nABX t0 = 7, 6wk = 8, 6wk + 4rec = 8, 6wk + 8rec = 7 individuals per timepoint). Error bars indicate S.D. (c) Boxplot showings body weights of males after 6wk nABX treatment. Bar represents median and whiskers indicate 5-95th percentile, p-value by unpaired two-tailed t-test. (d) Survival curve of males treated with nABX showing no subsequent effect on mortality. p-value by Mantel–Cox (log-rank). (e) Ratio of ceca to body weight in males treated with 6wk nABX. An enlarged ceca is symptomatic of major dysbiosis and/or reduced microbial abundance, further demonstrating changes in gut communities in nABX males. Bar represents median and whiskers indicate 5-95th percentile, p-value by unpaired two-tailed t-test (CON n = 25 males; nABX n = 26 males) (f) Number of pups per litter derived from nABX-treated male sires. Bar represents median and whiskers indicate 5-95th percentile. p-value by unpaired two-tailed t-test (CON n = 31 litters; nABX n = 36 litters). (g) Likelihood of males siring offspring following 6wk nABX, illustrating no difference in fertility relative to control (CON = 41 conceived from 51 plugs positive; nABX = 43 conceived from 55 plugs positive). (h) Sperm viability as judged by scoring the number of motile sperm per million after 6wk nABX exposure (CON n = 6 males; nABX n = 6 males, harvested sperm samples). (ik) Mass spectrometry analysis of each component of the nABX cocktail in tissues of treated male mice to confirm they are non-absorbable and do not reach distal tissues. Shown are standard curves demonstrating the high sensitivity and limit of detection (LoD). We were unable to detect (i) Bacitracin (j) Neomycin and (k) Pimaricin in either testis or blood (serum) of nABX-treated mice (l) Functional assay for the detection of antibiotic residues in testis of nABX-treated males indicates no bioavailable nABX can be detected (LoD detection threshold is below maximum residual level (MRL)). All assays indicate systemic and testicular responses to nABX are not due to direct chemical interactions with drugs, because nABX remain in the gastrointestinal tract and do not reach the systemic level or the testes. Source Data
Extended Data Fig. 2
Extended Data Fig. 2. Growth and molecular phenotypes in F1 offspring from nABX-induced dysbiotic fathers.
(a & b) Growth curves for F1 offspring fathered by control or nABX-treated sires, stratified for (a) male offspring (CON n = 87; nABX n = 96) and (b) female offspring (CON n = 85; nABX n = 85). Shown right is a representative higher-resolution timepoint (P15) of offspring body weights. Significance by a hierarchical (nested) two-tailed t-test that considers the number of litters (N) as degrees of freedom (CON = 25; nABX=28 litters). (c) Growth curves and P15 for all F1 offspring (male & female) combined (P3 n = 172/181 (CON/nABX), N = 26/28 fathers; P15 n = 164/180 (CON/nABX)). Significance by a hierarchical (nested) two-tailed t-test. (d) Distribution of fitted F1 offspring body weights at P15. There is a population shift leading to an increase in severe growth restriction (SGR) individuals amongst nABX-derived offspring. Body-weight categories are determined by Z-score relative to controls: < −3 = severe growth restriction (SGR); −3:−2 = growth restriction (GR); 2:3 = overweight (OW); >3 = obese (OB). (e) Representative images showing the range of F1 offspring growth phenotypes from nABX-treated sires at P17, spanning from normal to severe growth restriction (SGR). Obese individuals were not observed. (f) Additional phenotype comparisons between control and nABX-derived F1 offspring at indicated postnatal (P) days. Shown are three independent pairs, each from a different litter, with control and nABX born on same day. (g) Volcano plot showing significant DEGs (highlighted ochre for downregulated, green for upregulated) in brown adipose tissue (BAT) of offspring sired by dysbiotic fathers. The top enriched gene ontology terms for up- and down- regulated DEGs are shown above. p-value adjusted for multiple testing. (h) Heatmap showing the top 50 upregulated and top 50 downregulated genes in BAT from independent F1 offspring. Each column is an F1 individual from either a control or nABX-exposed father; circles indicate no observable phenotype whilst triangles indicate a physiological phenotype (SGR) observed in that individual. Data obtained from 3 litters per paternal treatment group. (i) Volcano plot showing significant differentially expressed genes in brain from F1 offspring. P-value adjusted for multiple testing. (j) Heatmap showing expression of the top 50 upregulated and downregulated genes in brain of F1 offspring according to paternal treatment. Each column is an F1 individual from either a control or nABX-exposed father; circles indicate no observable phenotype whilst triangles indicate a physiological phenotype (SGR) observed in that individual. Data obtained from 3 litters per paternal treatment group. Source Data
Extended Data Fig. 3
Extended Data Fig. 3. Reversion of F1 phenotypes coincident with restoration of preconception paternal gut microbiota.
(a) Body weights of F1 offspring derived from males exposed to nABX for 6wk (dysbiotic) and after 4 weeks recovery following nABX withdrawal (6wk + 4rec; still dysbiotic) and 8 weeks recovery (6wk + 8rec; recovered). The same males are used throughout the time course. p-value indicates nested (hierarchical) unpaired two-tailed t-test that calculates significance based on the number of treated males (fathers) rather than number of shown offspring. (b) QQ normality plots for F1 offspring body weights when sired by 6wk nABX (left), 6wk + 4rec (centre) or recovered 6wk + 8rec fathers (right). The plots indicate that SGR (low weight) offspring from dysbiotic fathers occur at a higher frequency than expected, indicating there is a change in the distribution (in addition to the mean) of F1 body weights, as indicated by excess kurtosis values. This implies a probabilistic affect that increases the frequency of outliers (SGR). (c) Volcano plot of gene expression in adipose of F1 offrpsing from 6wk + 4rec nABX fathers. Overlayed in green/ochre are differentially expressed genes from independent offspring derived from 6wk nABX fathers, indicating an equivalence in expression changes and directionality between cohorts sired from independent dysbiotic fathers. p-value adjusted for multiple testing. (d) Bubble plots showing gene ontology analysis of differentially expressed genes in F1 SGR offspring sired from 6wk or 6wk + 4rec fathers shows a striking similarity of enrichments. This suggests these independent dent offspring acquire a reproducible molecular response to paternal dysbiosis, whereas no SGR offspring were observed from 6wk + 8rec time points, indicating the effect is robust during the period of paternal gut microbiota perturbation but reverts coincident with recovery. Source Data
Extended Data Fig. 4
Extended Data Fig. 4. No evidence for increased structural or nucleotide variants in F1 offspring or transgenerational F2 phenotypes.
(a) Analysis of structural variants in independent F1 offspring sired by control or nABX-treated fathers reveals no change in their frequency irrespective of father’s status or offspring phenotype (normal or severe growth restriction: SGR). Each bar is an independent F1 offspring. (b) Analysis of nucleotide variants amongst independent F1 offspring from control or nABX fathers, showing no change in their frequency. These data indicate that the SGR F1 phenotype derived from nABX fathers is not associated with any increased rate of genetic abnormalities. We also did not identify any coding mutations underlying SGR phenotype. Note, most identified indels are ‘common’ (present in n = 6 (all) offspring), or ‘uncommon’ (present in n = 2–5 offspring), indicating they represent baseline nucleotide polymorphisms inherent throughout our C57BL/6J mouse colony relative to the reference genome. (c) Schematic showing the experimental design. Control or nABX-treated F0 males were mated with naive females and their F1 offspring were intercrossed to examine potential F2 effects. Note, the subset of F1 offspring with a severe growth restriction (SGR) phenotype could not be intercrossed, as they typically exhibited mortality prior to sexual maturity. Because of this reason and irrespective of F2 phenotype, nABX-exposed F0 males are predicted to have reduced F2 (transgenerational) fitness, as judged by number of grand-progeny. This reflects fewer sexually mature F1 offspring, which in turn would produce fewer F2 in absolute terms. (d) Dot plot showing neonatal (P3) and post-weaning (P21) body weight of F2 offspring is not altered (F2 n = 39 offspring from 6 intercrossed F1 CON offspring, F2 n = 50 offspring from 10 intercrossed F1 nABX offspring). Significance by nested two-tailed t-test. (e) Growth curves of all F2 offspring from grandpaternal control or nABX conditions (CON n = 39 F2 (6 litters); nABX n = 50 F2 (10 litters)). Significance by nested two-tailed t-test. (f) Survival plot of F2 offspring. Significance by Mantel–Cox test (log-rank). n = number of F2 offspring, N = number of independent F1 parents. Source Data
Extended Data Fig. 5
Extended Data Fig. 5. No significant changes in maternal or offspring microbiome.
(a & b) Bray–curtis dissimilarities showing no change in the composition of the gut microbiome in (a) F1 offspring sired by nABX fathers or (b) in mothers mated with nABX males, indicating transmitted F1 effects are independent of influencing the F1 or maternal microbiota per se. (c) Microbiota beta diversity confirming no consistent alteration in F1 microbiota as a function of the fathers microbial status. (d) Rarefaction analysis in fathers, mothers and offspring stratified by treatment of the father. (e) Spearman analysis between offspring taxa abundance and offspring phenotype shows no correlation (left), whereas spearman analysis between paternal microbiota taxa abundance and offspring phenotype shows associations of specific taxa in fathers with positive or negative correlations to F1 phenotype. Grey dot indicates mean correlation. (f) Analysis of microbiota richness of mothers and fathers prior to - and following − 4d cohousing and mating with either a control or nABX male. Pre- and post-mating faecal samples were collected from both mating pairs (CON = 6; nABX = 6). The results indicate there is no significant change in mothers following 4 days exposure to nABX males. Bar represents median and whiskers indicate 1.5x IQR. (g) Foldchange in specific taxa in mothers during pre- to post- mating with either a control or nABX male, revealing high variance and no significant effects linked with nABX males. Faecal samples collected pre- and post-mating (CON = 6; nABX = 6, females). Error bars indicate 95% C.I. (h) Upper; qPCR analysis showing unaltered microbiota abundance in mothers post-mating and after 4d exposure to nABX males. Also shown is failure to detect a seminal fluid microbiome ruling out this modality of information transfer (CON = 8; nABX = 7, seminal fluid samples). Error indicates S.D. Lower: Bray–curtis dissimilarities in fathers and mothers from pre- and post- mating periods.
Extended Data Fig. 6
Extended Data Fig. 6. In vitro fertilization and cohousing suggest germline transmission directly contributes to F1 phenotypes.
(a) Schematic of the cohousing strategy to empirically determine whether prior maternal exposure to an nABX male or his environment influences offspring phenotype independently of germ cells via, for example, coprophagy or microbiome transfer. Females were maintained within a control or nABX male cage for 4 days, which recapitulates the maximum time period used for natural matings throughout the study (mating within 1–4 days). Mating was prevented by removing males during the evening whilst leaving the females within the male environment, including exposure to faeces, microbes and chemical cues. After 4 days, independent control males were used for mating to examine the functional effect of prior cohousing with an nABX males. (b) Survival of F1 offspring from mothers mated with control males but pre-exposed to control or nABX males/environments. Significance by Mantel–Cox test (log-rank). (c) Neonatal birth weight, p-value by nested two-tailed t-test and bar indicate mean with 95% C.I. (d) Growth curves of F1 offspring from mothers mated with control males but pre-exposed to control or nABX male environments. ns = non-significant by nested two-tailed t-test analysis. (e) Schematic of experimental strategy for in vitro fertilization using control or dysbiotic (nABX) sperm donors. Oocytes from C57BL/6J females were pooled and split evenly to be fertilized by freshly harvested sperm from CON or nABX-treated (6wk) C57BL/6J males. IVF from CON and nABX males was performed in parallel. Fertilized embryos were transferred to recipient foster dams and subsequently analysed for F1 effects postnatally. (f) Growth curve of F1 offspring from IVF transferred to CD1 surrogate dams shows mean birth- and postnatal- weight is reduced when fertilized by nABX donor sperm. The prevalence of the severe growth restriction phenotype, characterized by extremely low body weight (Z-score < −3) by P15, can be observed in nABX outliers. Shown right is all data points from IVF embryos at P15. p-value by nested two-tailed t-test. (g) Growth curves of independent IVF offspring transferred to C57BL/6J surrogate dams. p-value by nested two-tailed t-test. Note CD1 mothers foster larger pups than C57BL/6J mothers, despite offspring being genetically-identical pure C57BL/6J (compare scale in Fig B & C), owing to higher quality in utero/maternal care from CD1. Nevertheless, we still observed a recapitulation of the F1 body weight phenotypes as observed in natural C57BL/6J matings in both in utero backgrounds. Source Data
Extended Data Fig. 7
Extended Data Fig. 7. Changes in testes features in response to gut microbiota perturbation.
(a) Testes seminiferous tubule sections from control males or after 6wk nABX, stained with hematoxylin and eosin (H&E). Shown are corresponding sections of CON and nABX testis from multiple different tubule stages (labelled in roman numerals), with the expected distribution of germ cell types for each stage shown (left). nABX testis routinely exhibited abnormalities and loss of entire cell-type compartments, potentially reflective of an impacted spermatogonial stem cell pool. Round spermatids (RS), Elongated spermatids (ES), Pachytene (P), Zygotene (Z), Preleptotene (Pl), Leptotene (L), Diplotene (D), Meiotic division (M). Scale bars: 100μm. (b) Sperm count from indpendent control and 6wk nABX-treated males. p-value by unpaired two-tailed t-test (CON n = 29, nABX n = 33). Bar indicates mean with 95% C.I. (c) Quantification of abnormal testes stratified by effect on individual testis (CON n = 7 testis, from N = 4 males; nABX n = 10, N = 5 males). All but one nABX testis had a higher mean rate of abnormalities relative to control average. Bar indicate mean with 95% C.I. (d) Quantification of total tubule diameter in control and nABX-treated (6wk) testis. p-value by nested unpaired two-tailed t-test (CON n = 854 tubules, nested into N = 4 males; nABX n = 1061, N = 4 males). Bar represents median and whiskers indicate 5-95th percentile. (e) Representative images of epididymis sections from independent nABX-treated males. Star indicates abnormality. (f) Assessment of sperm morphology. Shown are representative examples of normal sperm and those with abnormal head-piece, mid-piece and tail defects. Indicated right is quantification of overall level of abnormal sperm in control and nABX-treated males. All values are within the normal range, consistent with normal fecundity but altered molecular payload. Each male sperm sample was prepared in 3 slide smears at different concentrations and ~100 sperm cells were counted per slide (N = 2 males; n = 300 sperm cells counted per male). Out of 600 sperm cells counted per group, 279 from the CON group and 339 from the nABX group showed one or more morphological defects. Source Data
Extended Data Fig. 8
Extended Data Fig. 8. Molecular changes in testes as a response to gut microbiota perturbation.
(a) Representative examples of metabolites that exhibit a change in abundance specifically in testis of mice with gut dysbiosis induced by nABX. Five independently treated testis samples were analysed using untargeted metabolomics (CON = 5; nABX = 5). Shown is the effect after 6wk nABX-induced dysbiosis and the dynamic abundance of testis metabolites during microbiota recovery. The specific metabolite is shown with its class in brackets. Bar represents median and whiskers indicates data range. (b) Pathway analysis of differentially abundant metabolites in testes of nABX-exposed males. p-value adjusted for multiple testing. (c) Principal component analysis (PCA) of changes on the global transcriptomes of testes from independent control (blue) or nABX-exposed males at 6wk. (d) PCA analysis of metabolite composition in the testes from control or dysbiotic males treated with nABX for 6wk. (e) Integrated joint analysis of pathway enrichments arising from both transcriptome and metabolomic changes in testes of nABX-treated males. (f) Enriched KEGG pathways using gene-set enrichment analysis of transcriptome in testes of nABX males relative to controls. (g) Collective changes in marker genes for specific cell types (Green et al, 2018) in testes after nABX. Germ cell markers are globally downregulated whilst somatic cell markers, such as for sertoli cells are increased.
Extended Data Fig. 9
Extended Data Fig. 9. Single-cell RNA-seq and hybISS of testis in dysbiotic males.
(a & b) Heatmap showing marker gene expression for cell identity clusters identified by unbiased analysis in mouse testis from single-cell (sc)RNA-seq analysis of ~3,000 cells, pooled from n = 4 independent males for each condition. (c) Violin plots showing the expression profiles of selected marker genes within specific cell-type clusters in mouse testis. (d) UMAP projection of single-cell RNA-seq data indicating cell-type specific proportions in testes from control or nABX-treated males. Post-meiotic cell types (highlighted) are preferentially depleted in nABX males, whereas somatic sertoli cells are proportionally enriched as a consequence. Data in each condition from n = 4 independent males pooled. (e) Violin plots showing representative examples of single-cell expression profiles of DEGs in elongating spermatids. (f) Differentially expressed genes (DEG) within each testicular cell type in nABX-exposed males. (g). KEGG pathway analysis of differentially expressed genes from elongating spermatids. q-value corrected for multiple testing. (h) In situ sequencing in single cells confirming reduction of leptin expression in the seminiferous tubules of nABX-exposed males (CON = 5; nABX=5, testes). Middle panel: bar represents the median and whiskers indicate the 5-95th percentile. Right panel: bar indicate mean with 95% C.I. Source Data
Extended Data Fig. 10
Extended Data Fig. 10. Paternal leptin deficiency induces testicular phenotypes and major intergenerational expression changes.
(a) Bar chart showing sperm count in young (6wk old) ob/ob males that lack leptin signalling for an equivalent time period as 6wk-treated nABX males, where leptin is also impaired (WT = 3; ob/ob = 3, sperm samples). Bars show mean with S.D and significance by two-tailed t-test. (b-c) Bar chart showing (b) body weight and (c) testis/body weight ratio of ob/ob males at 6-week-old. Note that despite increased body weight linked with elevated satiety, testes weight is still reduced in absolute terms in ob/ob males (see Fig. 3i) and as a ratio to body weight, indicating a reproductive response. (d) Percentage natural matings that led to a successful pregnancy from control or ob/ob males. The lack of ob/ob pregnancies could indicate infertility due to direct sperm defects, or to indirect effects, such as impaired behaviour or physical capacity. These can be distinguished by IVF (see panel E-F), which indicates failure of ob/ob natural mating at this age is due to indirect effects, as IVF from ob/ob sperm was equally efficient as from WT. (e) Schematic showing the experimental design to test potential F1 impacts of dysregulated paternal leptin signalling. wt/ob mice were intercrossed to generate ob/ob and wt/wt males and sperm from such littermates was then isolated and used to fertilse WT oocytes, with no difference observed in the fertilization rate or development to blastocyst, indicating viable sperm from ob/ob and wt/wt males. (f) Principal component analysis of single-embryo transcripomes from E4.5 (left) and E5.5 (right) blastocysts. Each embryo was generated by parallel fertilizations using control or leptin-deficient sperm. Triplicate independent males were used per condition, across duplicate independent IVF experiments. A reproducible shift in gene expression patterns and thus phenotype, is observed depending on the father’s leptin levels. (g) Expression of Leptin in early embryos is undetectable. This argues against a potential haplo-insufficient effect on gene expression in wt/ob embryos derived from leptin-deficient (ob/ob) sires. Instead it points to a paternally inherited defect in sperm. (h) Gene ontology pathways of differentially expressed genes in embryos from leptin-deficient fathers. The test statistic reported as p-value. (i) Representative differentially expressed genes in blastocysts, depending on the paternal leptin status (WT = 9; ob/ob = 10, blastocysts). Each data point indicates log expression in an individual embryo at E4.5. Source Data
Extended Data Fig. 11
Extended Data Fig. 11. DNA methylation and small RNA profiles in purified sperm from dysbiotic males.
(a) Boxplot showing the global level of DNA methylation in sperm from multiple independent males, (n = 5 per condition) ascertained by whole-genome bisulfite sequencing (WGBS), quantified using 50 CpG tiles. Bar represents median and whiskers indicate median plus/minus the IQR multipled by 2. (b) Example genome track showing highly reproducible DNA methylation patterns in sperm irrespective of nABX treatment. Each data point represents the percentage methylation across a 50 CpG tile. Grey regions demarcate hypermethylated genomic zones. (c) Volcano plot highlighting significant differential methylated regions (DMR). Whilst 21 DMR loci were identified, the effect size was modest and they primarily overlapped CpG shores; loci more prone to natural biological or technical variation. (d) Genome track showing DNA methylation changes at a representative DMR (in green) using read-depth sensitive logistic regression (p < 0.05 & >20% abs. change). Percentages indicate DNA methylation level across the DMR in each sperm sample. Data points indicate methylation at each sliding 50 CpG tile. (e) Scatter plot showing DNA methylation at genomic imprinted regions in control and nABX-treated sperm. Paternal and maternal imprints are indicated. (f) Bar chart showing small RNAs that exhibit a foldchange in expression in purified sperm from nABX males relative to control sperm. (g) Absolute abundance of each indicated small RNA and class in control or nABX sperm. tRNA-Gly-GCC-2 (and tRNA-Gly-GCC-4) represent a major constituent of total RNA abundance in mature sperm and therefore relatively small foldchange differences in their expression constitutes a major change in absolute copy number in sperm heads. Each sample represents a total of n = 9 individual male samples pooled in to three replicates. Inset is the overall abundance (proportion of reads) of each small RNA class (h) Zoomed in representation of (B) showing miR-141 and Let-7 are highly abundant among microRNA and piRNA classes. (i) TaqMan qPCR quantification of top hits (miR-141-3p and tRNA-Gly-GCC) from small RNA-seq datasets using purified sperm from nABX-exposed males. Bars show mean with S.D and significance by one-tailed t-test. Sperm samples obtained in independent treatments from samples used for small RNA-seq (CON n = 4; nABX n = 4). Source Data
Extended Data Fig. 12
Extended Data Fig. 12. Paternal nABX exposure induces molecular and physiological responses in forthcoming placenta.
(a) Principal component analysis of placental transcriptomes from independent litters sired by control or nABX-treated fathers. (b) Volcano plot showing differentially expressed genes (DEG; highlighted ochre for downregulated, green for upregulated) in nascent (E13.5) placenta derived from control of nABX-exposed sires. p-value adjusted for multiple testing. (c) Heatmap showing consistent changes in gene expression between independent placenta from different litters, depending on the microbial status of the father. (d) E13.5 placental staining with IB4, a marker for endothelial cells to reveal fetoplacental vascularization within the labyrinth. nABX-derived placental tissue displayed abnormal vasculization (arrows) and reduced total vascularization, quantified right. (e) Immunofluorescent staining to determine the prevalence of trophoblast cells (arrows indicate absence) in E13.5 placenta, with quantification shown right. (f) Increased number and size of placental infarctions (lesions, arrow) in E18.5 placenta derived from CON or nABX males. (g) E18.5 placental staining with the IB4 endothelial cell marker demonstrating impaired fetoplacental vascularization within the labyrinth zone (arrowheads indicate normal blood vessels, arrows indicate abnormal). Multiple placenta from three independent litters were examined for each group, with each sired by independent fathers (CON = 3; nABX = 3). Data in panel d-f were each collected from placenta samples (CON n = 30 subregions of labyrinth, N = 5 placenta (3 litters); nABX n = 27 subregions of labyrinth, N = 5 placenta (3 litters)) and from each placenta 5 tissue sections covering different subregions of the labyrinth were analysed. It should be noted that these samples are independent litters from Fig. 4. Bar indicates mean with 95% C.I. Data analysis using unpaired student’s two-tailed t-test. Scale bars: 50 μm (d,e), 20 μm (f) and 500 μm, 20 μm (g). Placental vascular network and trophoblastic cell count were analysed using QUPath-V0.2.3. Source Data

Comment in

References

    1. Gilbert JA, et al. Current understanding of the human microbiome. Nat. Med. 2018;24:392–400. doi: 10.1038/nm.4517. - DOI - PMC - PubMed
    1. Sanna S, et al. Causal relationships among the gut microbiome, short-chain fatty acids and metabolic diseases. Nat. Genet. 2019;51:600–605. doi: 10.1038/s41588-019-0350-x. - DOI - PMC - PubMed
    1. Kuang Z, et al. The intestinal microbiota programs diurnal rhythms in host metabolism through histone deacetylase 3. Science. 2019;365:1428–1434. doi: 10.1126/science.aaw3134. - DOI - PMC - PubMed
    1. Zimmermann M, Zimmermann-Kogadeeva M, Wegmann R, Goodman AL. Separating host and microbiome contributions to drug pharmacokinetics and toxicity. Science. 2019;363:eaat9931. doi: 10.1126/science.aat9931. - DOI - PMC - PubMed
    1. Kolodziejczyk AA, et al. Acute liver failure is regulated by MYC- and microbiome-dependent programs. Nat. Med. 2020;26:1899–1911. doi: 10.1038/s41591-020-1102-2. - DOI - PubMed

MeSH terms