Comparative Study
. 2024 May;629(8013):910-918.
doi: 10.1038/s41586-024-07368-2. Epub 2024 May 1.

Geographic variation of mutagenic exposures in kidney cancer genomes

Sergey Senkin #  1 Sarah Moody #  2 Marcos Díaz-Gay  3   4   5 Behnoush Abedi-Ardekani  1 Thomas Cattiaux  1 Aida Ferreiro-Iglesias  1 Jingwei Wang  2 Stephen Fitzgerald  2 Mariya Kazachkova  3   5   6 Raviteja Vangara  3   4   5 Anh Phuong Le  2 Erik N Bergstrom  3   4   5 Azhar Khandekar  3   4   5 Burçak Otlu  3   4   5   7 Saamin Cheema  2 Calli Latimer  2 Emily Thomas  2 Joshua Ronald Atkins  8 Karl Smith-Byrne  8 Ricardo Cortez Cardoso Penha  1 Christine Carreira  9 Priscilia Chopard  1 Valérie Gaborieau  1 Pekka Keski-Rahkonen  10 David Jones  2 Jon W Teague  2 Sophie Ferlicot  11 Mojgan Asgari  12   13 Surasak Sangkhathat  14 Worapat Attawettayanon  15 Beata Świątkowska  16 Sonata Jarmalaite  17   18 Rasa Sabaliauskaite  17 Tatsuhiro Shibata  19   20 Akihiko Fukagawa  20   21 Dana Mates  22 Viorel Jinga  23 Stefan Rascu  23 Mirjana Mijuskovic  24 Slavisa Savic  25 Sasa Milosavljevic  26 John M S Bartlett  27 Monique Albert  28   29 Larry Phouthavongsy  29 Patricia Ashton-Prolla  30   31 Mariana R Botton  32 Brasil Silva Neto  33   34 Stephania Martins Bezerra  35 Maria Paula Curado  36 Stênio de Cássio Zequi  37   38   39   40 Rui Manuel Reis  41   42 Eliney Ferreira Faria  43   44 Nei Soares de Menezes  45 Renata Spagnoli Ferrari  44 Rosamonde E Banks  46 Naveen S Vasudev  46 David Zaridze  47 Anush Mukeriya  47 Oxana Shangina  47 Vsevolod Matveev  48 Lenka Foretova  49 Marie Navratilova  49 Ivana Holcatova  50   51 Anna Hornakova  52 Vladimir Janout  53 Mark P Purdue  54 Nathaniel Rothman  54 Stephen J Chanock  54 Per Magne Ueland  55 Mattias Johansson  1 James McKay  1 Ghislaine Scelo  56 Estelle Chanudet  57 Laura Humphreys  2 Ana Carolina de Carvalho  1 Sandra Perdomo  1 Ludmil B Alexandrov  3   4   5 Michael R Stratton  2 Paul Brennan  58
Affiliations
Comparative Study

Geographic variation of mutagenic exposures in kidney cancer genomes

Sergey Senkin et al. Nature. 2024 May.

Abstract

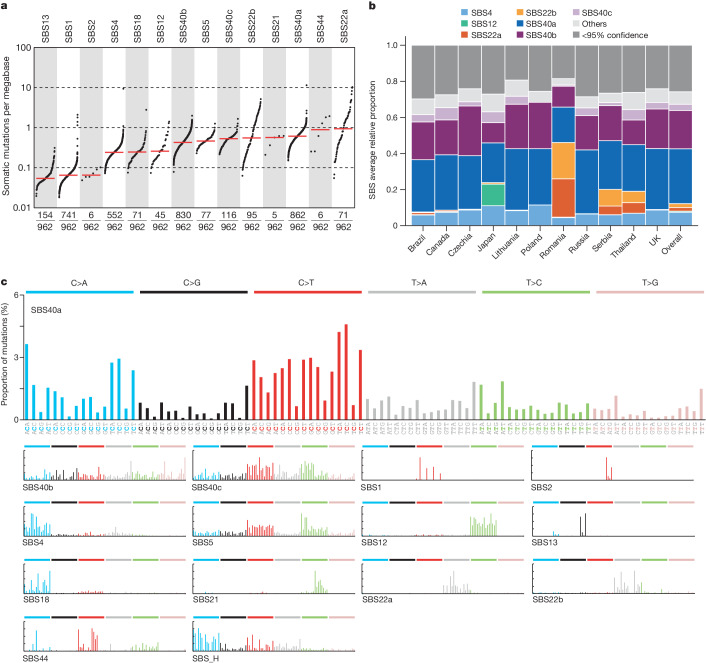
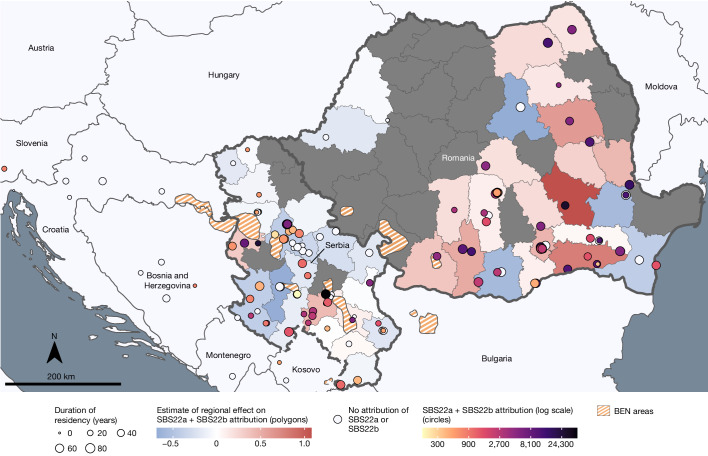
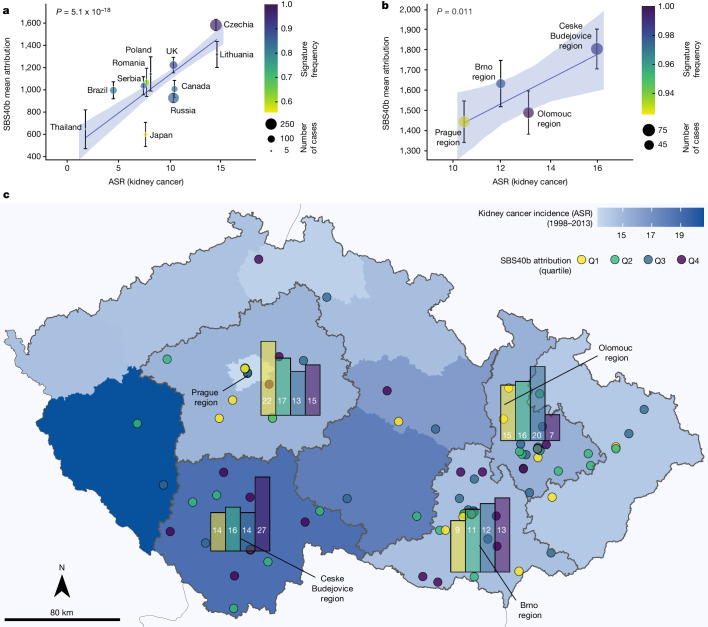
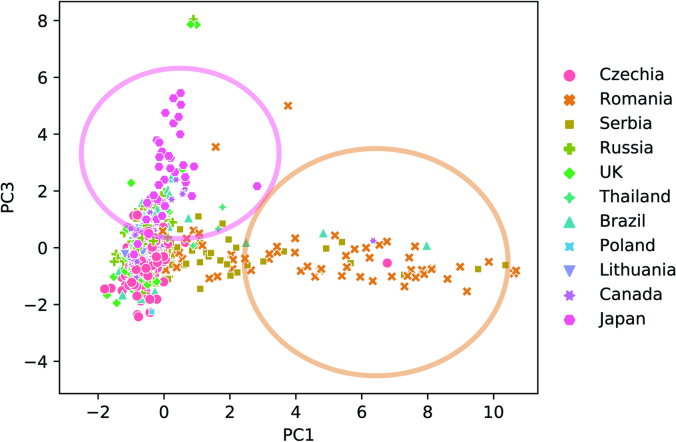
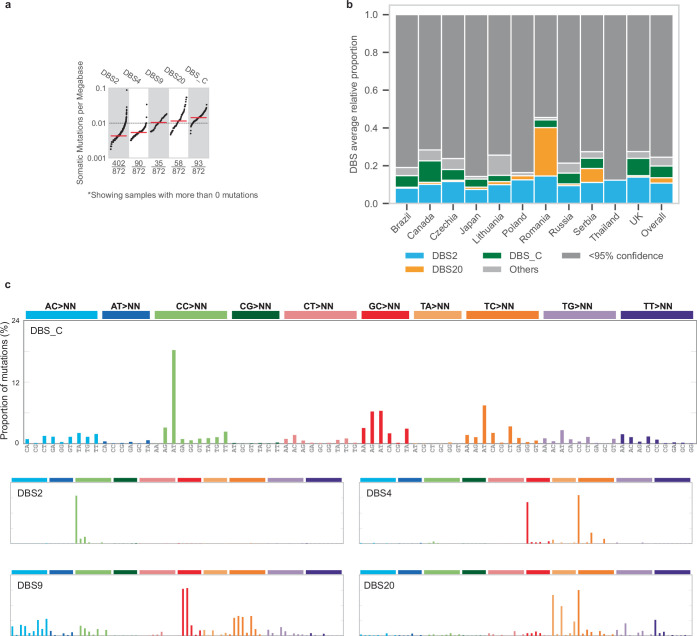
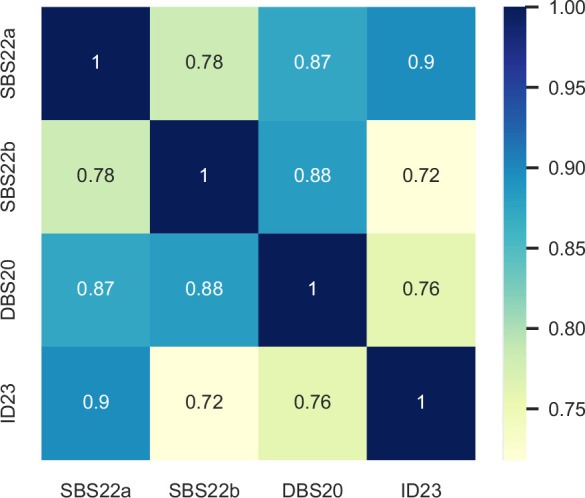
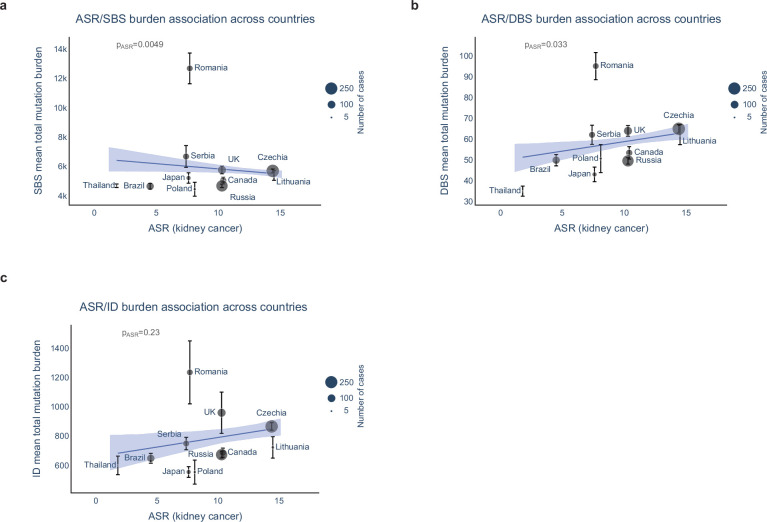
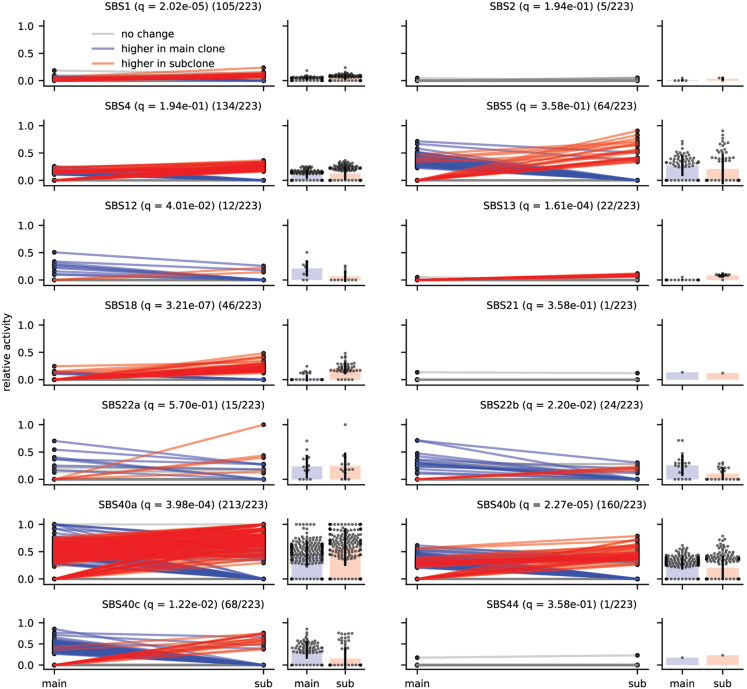
International differences in the incidence of many cancer types indicate the existence of carcinogen exposures that have not yet been identified by conventional epidemiology make a substantial contribution to cancer burden1. In clear cell renal cell carcinoma, obesity, hypertension and tobacco smoking are risk factors, but they do not explain the geographical variation in its incidence2. Underlying causes can be inferred by sequencing the genomes of cancers from populations with different incidence rates and detecting differences in patterns of somatic mutations. Here we sequenced 962 clear cell renal cell carcinomas from 11 countries with varying incidence. The somatic mutation profiles differed between countries. In Romania, Serbia and Thailand, mutational signatures characteristic of aristolochic acid compounds were present in most cases, but these were rare elsewhere. In Japan, a mutational signature of unknown cause was found in more than 70% of cases but in less than 2% elsewhere. A further mutational signature of unknown cause was ubiquitous but exhibited higher mutation loads in countries with higher incidence rates of kidney cancer. Known signatures of tobacco smoking correlated with tobacco consumption, but no signature was associated with obesity or hypertension, suggesting that non-mutagenic mechanisms of action underlie these risk factors. The results of this study indicate the existence of multiple, geographically variable, mutagenic exposures that potentially affect tens of millions of people and illustrate the opportunities for new insights into cancer causation through large-scale global cancer genomics.


Conflict of interest statement

L.B.A. is a compensated consultant and has equity interest in io9 and Genome Insight. His spouse is an employee of Biotheranostics. L.B.A. is also an inventor of a US Patent 10,776,718 for source identification by non-negative matrix factorization. E.N.B. and L.B.A. declare US provisional patent applications with serial numbers: 63/289,601, 63/269,033 and 63/483,237. L.B.A. also declares US provisional patent applications with serial numbers: 63/366,392, 63/367,846, 63/412,835 and 63/492,348. V.M. received honoraria from Ipsen, Bayer, AstraZeneca, Janssen, Astellas Pharm and MSD, and provided expert testimony to BMS, Bayer, MSD and Janssen. The other authors declare no competing interests.

Figures

Fig. 1
Fig. 1. Eleven participating countries and estimated ASRs of ccRCCs.
Incidence of ccRCC for men and women combined (ASR per 100,000). Data from GLOBOCAN 2020. Markers indicate countries included in this study (number of participants with ccRCC per country).
Fig. 2
Fig. 2. SBS signature operative in ccRCCs.
a, TMB plot showing the frequency and number of mutations per megabase for each of the decomposed SBS signatures. Data include only samples with more than zero mutations. b, Average relative attribution for SBS signatures across countries. Signatures that contribute less than 5% on average are grouped in the ‘others’ category, except for SBS12 and the aristolochic acid-related signatures SBS22a and SBS22b. The ‘<95% confidence’ category accounts for the proportion of mutation burden that could not be assigned to any signature with confidence level of at least 95%. c, Decomposed signatures, including reference COSMIC signatures as well as de novo signatures that are not decomposed into COSMIC reference signatures.
Fig. 3
Fig. 3. Geospatial analysis of aristolochic acid-related SBS signatures.
Distribution of cases of ccRCC from Romania and Serbia with known residential history, along with the summed levels of SBS22a and SBS22b attributions (per case and regional estimate), with respect to BEN areas. White circles represented cases with no detected activity of SBS22a and SBS22b.
Fig. 4
Fig. 4. Association of SBS40b signature attribution with incidence of kidney cancer.
a, Number of mutations attributed to signature SBS40b against ASR of kidney cancer in each of the 11 countries represented in the cohort. Data are mean ± s.e.m. (n = 961 biologically independent samples examined over 1 independent experiment). b, Number of mutations attributed to signature SBS40b in four regions of Czech Republic against ASR of kidney cancer in each region. Data are mean ± s.e.m. (n = 961 biologically independent samples examined over 1 independent experiment). a,b, P values are shown for the ASR variable in linear regressions across all cases, adjusted for sex and age of diagnosis. c, Attribution of SBS40b signature within the Czech Republic, with bar plots showing the number of cases for each quartile of SBS40b attribution across Prague, Olomouc, Ceske Budejovice and Brno regions.
Fig. 5
Fig. 5. Driver mutation analysis in ccRCCs.
a, Frequency of driver genes in the cohort. Only genes mutated in at least ten cases are shown. b, Frequency of driver genes across countries. Thailand, Poland and Lithuania are not shown owing to low numbers of samples. c, SBS-96 mutational spectra of all driver mutations in ccRCC for aristolochic acid-exposed and unexposed cases. d, Percentage of T>A driver mutations in aristolochic acid-exposed and unexposed cases. e, SBS-96 mutational spectra of VHL mutations in ccRCC for aristolochic acid-exposed and unexposed cases. f, Percentage of T>A VHL mutations in AA-exposed and unexposed cases.
Extended Data Fig. 1
Extended Data Fig. 1. Mutation burdens in clear cell renal cell carcinomas across countries.
Mutation burdens for single base substitutions (SBS) (a), doublet base substitutions (DBS) (b) and small insertions and deletions (ID) (c) show significant differences between countries using the Kruskal-Wallis (two-sided) test (n = 961 biologically independent samples over 1 independent experiment). Four SBS hypermutators and four ID hypermutators above mutation burden of 30000 and 3000, respectively, were removed for clarity. Box and whiskers plots are in the style of Tukey. The line within the box is plotted at the median while the upper and lower ends are indicated 25th and 75th percentiles. Whiskers show 1.5*IQR (interquartile range) and values outside it are shown as individual data points.
Extended Data Fig. 2
Extended Data Fig. 2. Principal component analysis of relative mutation counts.
PCA performed on relative mutation counts of all ccRCC tumors incorporating the six mutation classes (C > A, C > G, C > T, T > A, T > C, T > G). Principal component 1 (PC1) clearly separates the cluster of mostly Romanian cases that are enriched with AA signatures, often at high mutation burdens. Principal component 3 (PC3) identifies a cluster of mostly Japanese cases, enriched with signature SBS12.
Extended Data Fig. 3
Extended Data Fig. 3. Attribution of signatures SBS40a, SBS40b, and SBS40c in a pan-cancer cohort.
Attribution of signatures SBS40a, SBS40b, and SBS40c in a pan-cancer cohort, showing a widespread distribution for SBS40a whilst SBS40b and SBS40c are only seen consistently in clear cell renal cell carcinomas (ccRCC). The size of each dot represents the proportion of samples of each tumor type where the signature is present. The color of each dot represents the average mutation burden.
Extended Data Fig. 4
Extended Data Fig. 4. Doublet-base substitution signatures operative in clear cell renal cell carcinomas.
(a) Tumour mutation burden (TMB) plot showing the frequency and mutations per Mb for each of the decomposed DBS signatures. (b) Average relative attribution for doublet-base substitution (DBS) signatures across countries. Signatures contributing less than 5% on average are grouped in the ‘Other’ category, apart from signature DBS20. Category named ‘<95% confidence’ accounts for the proportion of mutation burden which could not be assigned to any signature with confidence level of at least 95%. (c) Decomposed DBS signatures, including reference COSMIC signatures as well as de novo signatures not decomposed into COSMIC reference signatures.
Extended Data Fig. 5
Extended Data Fig. 5. Small insertions and deletion signatures operative in clear cell renal cell carcinomas.
(a) Tumour mutation burden (TMB) plot showing the frequency and mutations per Mb for each of the decomposed ID signatures. (b) Average relative attribution for small insertion and deletion (ID) signatures across countries. Signatures contributing less than 5% on average are grouped in the ‘Others’ category, apart from signature ID23. Category named ‘<95% confidence’ accounts for the proportion of mutation burden which could not be assigned to any signature with confidence level of at least 95%. (c) Decomposed ID signatures, including reference COSMIC signatures as well as de novo signatures not decomposed into COSMIC reference signatures.
Extended Data Fig. 6
Extended Data Fig. 6. Correlation between signatures SBS22a, SBS22b, DBS20, ID23.
Heatmap of pairwise Pearson correlation between signatures SBS22a, SBS22b, DBS20 and ID23. Numbers and colors indicate correlation coefficient.
Extended Data Fig. 7
Extended Data Fig. 7. Single base substitution signatures showing significant differences in attributed mutation burden between countries.
Signatures SBS40a (a) and SBS40b (b) were more prevalent in high-incidence regions of Czech Republic and Lithuania. Signatures SBS22a (c) and SBS22b (d) were enriched in Romania and Serbia. SBS1 (e), SBS5 (f) and SBS4 (g) showed moderate differences across countries. Signature SBS12 (h) is highly prevalent in Japan. Five SBS1 hypermutators above mutation burden of 1000 were removed for clarity. Box and whiskers plots are in the style of Tukey. The line within the box is plotted at the median while the upper and lower ends are indicated 25th and 75th percentiles. Whiskers show 1.5*IQR (interquartile range) and values outside it are shown as individual data points. N = 961 biologically independent samples examined over 1 independent experiment.
Extended Data Fig. 8
Extended Data Fig. 8. Association of mutational signatures with incidence of renal cancer.
Number of mutations attributed to signatures (a) SBS40a, (b) ID5 and (c) ID8 against age-standardized incidence rate (ASR) of kidney cancer in each of the eleven countries represented in the cohort. Data are presented as mean values +/− SEM (n = 961 biologically independent samples examined over 1 independent experiment). The p-values shown are for the ASR variable in linear regressions across all cases, adjusted for sex and age of diagnosis.
Extended Data Fig. 9
Extended Data Fig. 9. Association of mutation burden with incidence of renal cancer.
Association of age-standardized rates (ASR) of kidney cancer incidence with SBS (a), DBS (b) and ID (c) mutation burdens across countries. Data are presented as mean values +/− SEM (n = 961 biologically independent samples examined over 1 independent experiment). The p-values shown are for the ASR variable in linear regressions across all cases, adjusted for sex and age of diagnosis.
Extended Data Fig. 10
Extended Data Fig. 10. Evolutionary analysis of mutational signatures in ccRCC.
Comparison of mutational signatures between clonal and subclonal mutations. Lines show the change in relative activity between the clonal mutations (main) and subclonal mutations (sub) within a sample. Blue and red lines represent an activity change of more than 6% (blue indicates higher in the clonal mutations; red indicates higher in the subclonal mutations). Bar plots show the distribution of activities in samples where the signature was present in the clonal and/or subclonal mutations; this number is represented in the title of each plot as X/223 for each signature (n = 223 biologically independent samples examined over 1 independent experiment). Black bars indicate one standard deviation away from the mean. Significance was assessed using a two-sided Wilcoxon signed-rank test, and q-values were generated using the Benjamini-Hochberg Procedure.

Comment in

References

    1. Brennan P, Davey-Smith G. Identifying novel causes of cancers to enhance cancer prevention: new strategies are needed. J. Natl Cancer Inst. 2022;114:353–360. doi: 10.1093/jnci/djab204. - DOI - PMC - PubMed
    1. Hsieh JJ, et al. Renal cell carcinoma. Nat. Rev. Dis. Primers. 2017;3:17009. doi: 10.1038/nrdp.2017.9. - DOI - PMC - PubMed
    1. Koh G, Degasperi A, Zou X, Momen S, Nik-Zainal S. Mutational signatures: emerging concepts, caveats and clinical applications. Nat. Rev. Cancer. 2021;21:619–637. doi: 10.1038/s41568-021-00377-7. - DOI - PubMed
    1. Alexandrov LB, et al. The repertoire of mutational signatures in human cancer. Nature. 2020;578:94–101. doi: 10.1038/s41586-020-1943-3. - DOI - PMC - PubMed
    1. Scelo G, et al. Variation in genomic landscape of clear cell renal cell carcinoma across Europe. Nat. Commun. 2014;5:5135. doi: 10.1038/ncomms6135. - DOI - PubMed

Publication types

MeSH terms