. 2024 May;629(8012):639-645.
doi: 10.1038/s41586-024-07367-3. Epub 2024 May 1.

Sleep pressure modulates single-neuron synapse number in zebrafish

Affiliations

Sleep pressure modulates single-neuron synapse number in zebrafish

Anya Suppermpool et al. Nature. 2024 May.

Abstract

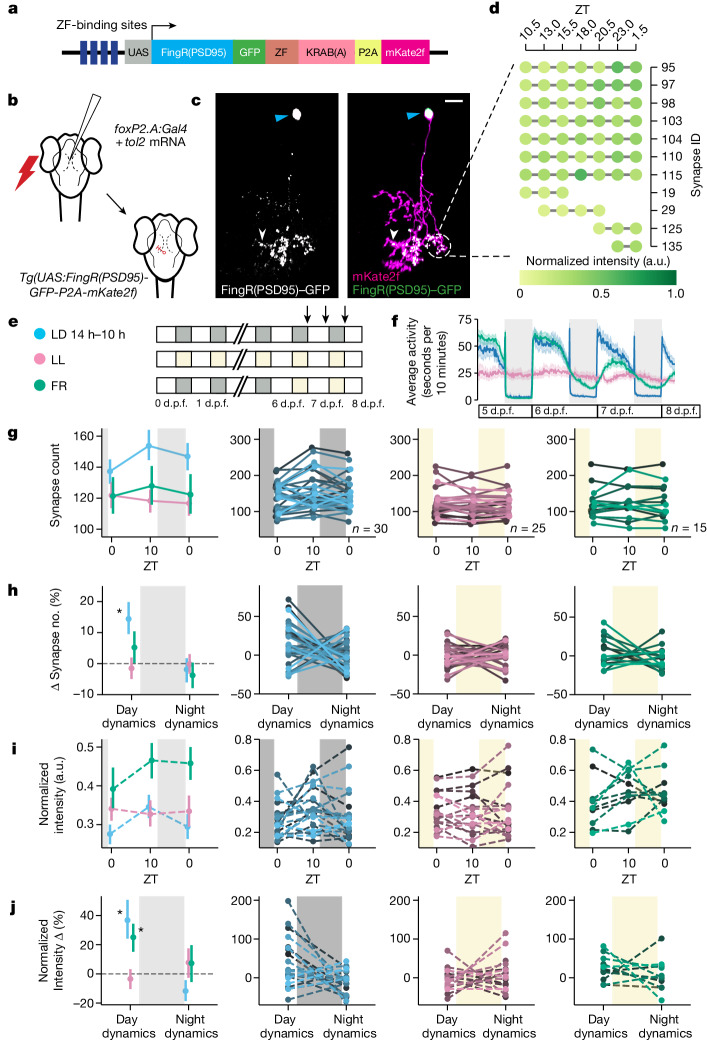
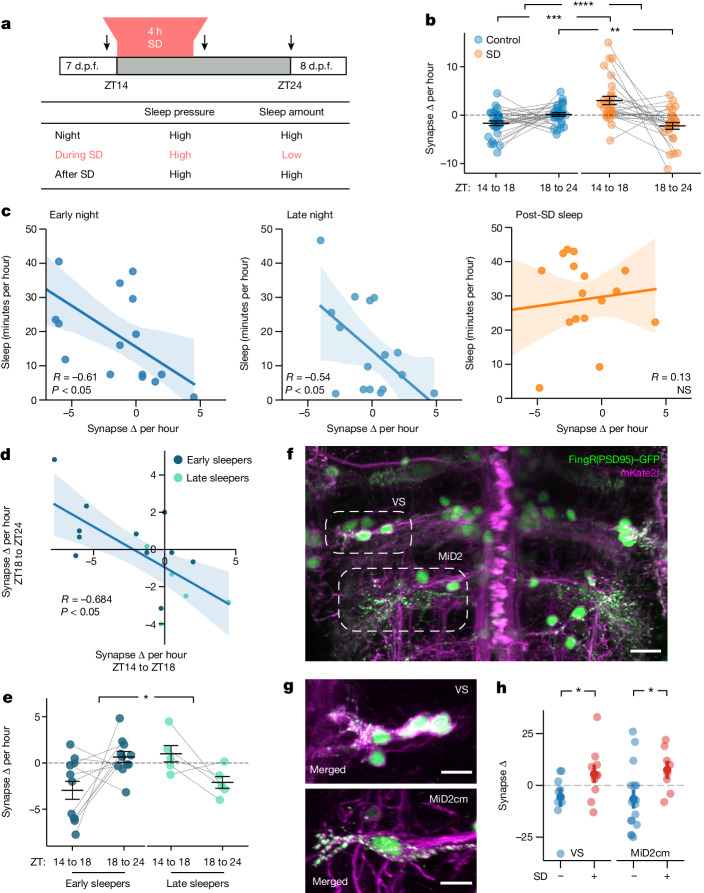
Sleep is a nearly universal behaviour with unclear functions1. The synaptic homeostasis hypothesis proposes that sleep is required to renormalize the increases in synaptic number and strength that occur during wakefulness2. Some studies examining either large neuronal populations3 or small patches of dendrites4 have found evidence consistent with the synaptic homeostasis hypothesis, but whether sleep merely functions as a permissive state or actively promotes synaptic downregulation at the scale of whole neurons is unclear. Here, by repeatedly imaging all excitatory synapses on single neurons across sleep-wake states of zebrafish larvae, we show that synapses are gained during periods of wake (either spontaneous or forced) and lost during sleep in a neuron-subtype-dependent manner. However, synapse loss is greatest during sleep associated with high sleep pressure after prolonged wakefulness, and lowest in the latter half of an undisrupted night. Conversely, sleep induced pharmacologically during periods of low sleep pressure is insufficient to trigger synapse loss unless adenosine levels are boosted while noradrenergic tone is inhibited. We conclude that sleep-dependent synapse loss is regulated by sleep pressure at the level of the single neuron and that not all sleep periods are equally capable of fulfilling the functions of synaptic homeostasis.


Conflict of interest statement

The authors declare no competing interests.

Figures

Fig. 1
Fig. 1. Single-neuron synapse tracking across day–night cycles reveals diverse dynamics.
a, The synapse labelling construct. Zinc finger (ZF) and KRAB(A) domains limit overexpression. b, The strategy to sparsely label synapses of FoxP2.A+ tectal neurons (Methods). c, Example FoxP2.A:FingR(PSD95)+ neuron at 7 d.p.f., with the synapses (white arrowheads, left), nucleus (blue arrowheads, left) and membrane (magenta, right) co-labelled. d, Overnight time-lapse tracking of select synapses from the neuron in c. The normalized GFP intensity (shading) is shown for each synapse (rows). The complete neuron map is shown in Extended Data Fig. 2a. e, Larvae were raised on 14 h–10 h light–dark (LD) cycles (blue), constant light (LL, pink) or switched from LD to LL at 6 d.p.f. (free running (FR), green), and then imaged (arrows) (Methods). f, The average locomotor activity and 95% confidence intervals (CIs) of larvae reared under LD (blue, n = 75), clock-break LL (pink, n = 84) or FR (green, n = 98) conditions. gj, The mean and 68% CI (column 1) and individual neuron (columns 2–4) synapse counts (g), percentage change in synapse number calculated within each neuron (h), normalized synapse intensity (i) and percentage change in synapse intensity (j) under the LD (blue), LL (pink) or FR (green) conditions. For columns 2–4, a line is shown for each neuron, collected across 8 LD, 4 LL and 4 FR independent experiments. For h, synapse number change (Δ synapse number) dynamics are different during the day from those during the night under LD conditions (*P = 0.043, repeated-measures analysis of variance (ANOVA)). Synapse number change dynamics under LD cycling are significantly different from those under LL conditions (*P = 0.015, main effect of condition, two-tailed mixed ANOVA, post hoc Benjamini–Hochberg correction; Hedge’s g = 0.761). For j, day–night dynamics are significantly different under LD from those under the other conditions (P < 0.01, repeated-measures ANOVA). Both daytime FR and LD day–night dynamics are significantly different from those under the LL condition (mixed ANOVA interaction (condition × time), P = 0.029; FR versus LL, P = 0.038, g = 0.937; LD versus LL, P = 0.027, g = 0.792; post hoc Benjamini–Hochberg correction, two-tailed). At night, LD versus FR, g = −0.538; LD versus LL, g = −0.527. The diagram in a is adapted from ref. , CC BY 4.0, and the diagram in b is adapted from ref. , CC BY 4.0. The colour key in e applies also to fi. Source Data
Fig. 2
Fig. 2. Subtype-specific synapse changes in FoxP2.A tectal neurons over 3 days.
a, The morphological parameters used to characterize FoxP2.A tectal neurons. A–P, anterior–posterior. b, Examples of each morphological subtype, chosen from n = 17 (type 1), n = 28 (type 2), n = 61 (type 3) and n = 42 (type 4) neurons collected over 26 independent experiments. The blue circles label nuclei. c, Example of the parameters used to distinguish the four subtypes. For the box plots, the centre lines show the median, the box limits show the interquartile range and the whiskers represent the distribution for each parameter. The slashed zero indicates that the feature is absent. See also Extended Data Fig. 5. dg, Synapse counts across multiple LD cycles for FoxP2.A tectal neurons of different subtypes. d,e, Average (68% CI) synapse counts (d) and average (68% CI) synapse number change (e) of subtypes (column 1) and for each neuron (columns 2–4), collected over 8 independent experiments. f,g, Average (68% CI) synapse counts (f) and net change (g), averaged across all days and nights for each subtype and larvae, including additional neurons tracked over a single day (Extended Data Fig. 5). Tectal subtype influences synapse changes (mixed ANOVA, interaction P = 0.012, subtype × time). Type 2 (n = 16) and type 4 (n = 15) neurons gain more synapses during the day under LD conditions compared with under LL clock-break conditions (P = 0.018, g = 0.952; P = 0.021, g = 0.812, respectively). At night, both type 2 and type 4 neurons lose synapses relative to type 3 (type 2 versus type 3, P = 0.038; g = −0.714; type 4 versus type 3, P = 0.038, g = −0.781, post hoc Benjamini–Hochberg correction, one-tailed). For b, scale bars, 10 μm. Source Data
Fig. 3
Fig. 3. Synapse counts of neurons are modulated by sleep and SD.
a, The 4 h gentle handling SD paradigm (ZT14–ZT18). Larvae were video-tracked and neurons were periodically imaged (arrows). b, The mean ± s.e.m. change in synapse counts per hour for the SD (orange, n = 31 neurons) and control (blue, n = 28) groups. c, Sleep time versus the change in synapse counts per hour for each larva during either the early (ZT14–ZT18, left) or late (ZT18–ZT24, middle) night for controls and after SD (ZT18–ZT24, right). The rate of synapse change is negatively correlated with sleep time during both early and late night but not after SD. d, In control larvae, the change in early night synapse counts is negatively correlated with late night synapse change. Early and late sleepers are defined as larvae that either sleep more in the first or second phase of the night, respectively. e, Synapse counts per hour for early- and late-night sleeping control larvae in the early (ZT14–ZT18) and late (ZT18–ZT24) phases of the night. Data are mean ± s.e.m. fh, The reticulospinal neuron synapse number is modulated by sleep and wake states. f, Example reticulospinal neurons from the Tg(pvalb6:KALTA4)u508 line co-labelled by FingR(PSD95)–GFP (green, nuclei and synapses) and mKate2f (magenta, membrane). Vestibulospinal (VS) and MiD2cm neurons are indicated by the dashed ovals. g, Vestibulospinal (top) and MiD2cm (bottom) neurons from different larvae showing FingR(PSD95)+ synapses (green) co-localized to the cell membrane (magenta). h, Changes in synapse number (mean and 68% CI) from ZT14 to ZT18 for vestibulospinal and MiD2cm neurons. Each dot represents the average across multiple neurons per larva. For b and e, statistical analysis was performed using two-tailed mixed ANOVA interaction (condition × time) with post hoc Benjamini–Hochberg correction; ****P = 0.00007, ***P = 0.0002 and **P = 0.006 (b) and *P = 0.01 (e). For h, statistical analysis was performed using one-tailed Student’s t-tests; *P < 0.03. Scale bars, 15 μm (f) and 10 μm (g). The lines in c and d depict the linear regression with the 95% CI. Source Data
Fig. 4
Fig. 4. Single-neuron synapse loss during sleep is driven by boosting adenosine and blocking noradrenaline.
a, Larvae were temporarily treated with sleep-promoting drugs during the day (ZT5–ZT10). The black arrows indicate the imaging periods before and after drug treatment. b, Drug-induced sleep during the day disentangles sleep pressure (that is, low) from sleep amount (that is, high), which are otherwise tightly correlated. c, Drug-treated larvae sleep significantly more during the day compared with the dimethyl sulfoxide (DMSO)-treated controls. d, During the day (from ZT5–ZT10), synapse counts increase under all control and drug conditions, except during co-administration of clonidine and 2-chloroadenosine, when synapses are significantly lost. Data are mean ± s.e.m. n values represent the number of neurons (top row) or fish (bottom row). For c and d, statistical analysis was performed using Kruskal–Wallis tests with post hoc Dunn’s multiple-comparison test (left) and one-way ANOVA (right); not significant (NS), P > 0.5; *P = 0.034, **P < 0.01, ****P < 0.0001. Source Data
Extended Data Fig. 1
Extended Data Fig. 1. The modified FingR(PSD95)-GFP construct labels synapses in vivo.
a-a”, Maximum projection (Z-stack, ~10 μm) of anti-MAGUK immunohistochemistry and endogenous fluorescence of FingR(PSD95)-GFP in the spinal cord of 2 dpf Tg(mnx1:Gal4) larvae. Examples of FingR(PSD95)+ puncta co-labelled by anti-MAGUK are indicated by white arrowheads; an example of a FingR(PSD95)+ not labelled by anti-MAGUK is indicated by the blue arrowhead. b-b”’, Higher magnification (white box from a) depicting how sectional grey values for each synapse were obtained. b, The FingR(PSD95)-GFP channel showing part of a neuron with its nucleus (asterisk) and synaptic puncta (green). Dotted lines indicate example cross-sectional areas obtained for each synapse. b’, Anti-MAGUK puncta of the same neuron. b”,b”’, FingR(PSD95)-GFP and MAGUK channels merged, with examples of cross-sections 1–4. c, Examples of normalized cross-sectional grey values for anti-MAGUK signals and FingR(PSD95)-GFP signal for the same puncta (numbered 1–4 in b”’). Three examples in which FingR(PSD-95)-GFP co-localized with anti-MAGUK signals (#1–3) and one example (#4) where a FingR(PSD-95)-GFP punctum did not co-localize with MAGUK. See Methods for details. d, Percentage of FingR(PSD-95)-GFP synapses that co-localized with anti-MAGUK+ puncta (blue). As a control for chance co-localization, the calculation was repeated on images in which the anti-MAGUK image was rotated by 90° relative to the FingR(PSD-95)-GFP channel. ****P = 1.1 × 10−83 Chi-square. e, Histogram of the distance between all co-localized FingR(PSD95)-GFP and anti-MAGUK cross-sectional grey value peaks. f-g, The intensity and Full Width Half Max (FWHM) of FingR(PSD95)-GFP and anti-MAGUK puncta are weakly, but significantly, positively correlated. Blue and red lines depict the linear regression curve and 95% CI for the colocalized and non-colocalized populations, respectively. n = 540 puncta, 5 fish (data as in d). h, Percentage of anti-MAGUK+ puncta that co-localized with FingR(PSD-95)-GFP synapses (blue). As a control for chance co-localization, the calculation was repeated on images in which the FingR(PSD-95)-GFP image was rotated by 90° relative to the anti-MAGUK channel. ****P = 3.1 × 10⁻¹⁴ Chi-square. i, Histogram of the distance between co-localized anti-MAGUK and FingR(PSD95)-GFP cross-sectional grey value peaks. Scale bar: 5 μm (a-b”’). Source Data
Extended Data Fig. 2
Extended Data Fig. 2. The synapse number of single tectal neurons is developmentally stable at 6–9 dpf.
a, The full map of synapse tracking from the neuron in Fig. 1c. Each column depicts a synapse, and the colour indicates the normalized GFP intensity of each synapse. In this example, 56 synapses disappeared and 20 synapses appeared during the imaging, resulting in a net change of −36 synapses. Grey bars depict night (ZT14-24). b, Example of a single FoxP2.A:FingR(PSD95)+ neuron imaged through development from 4–10 dpf. Nuclei and synapses are FingR(PSD95)-GFP+ (green), and cellular morphology is labelled by mKate2f (magenta). White arrowheads indicate examples of puncta that persisted through time. Blue arrowheads indicate examples of synapses gained/lost through time. c, Synapse counts across all neurons (average and 68% CI) (left) and for single neurons through 4–10 dpf (right). d, Average percentage change in synapse number and 68% CI calculated from the previous time point (left) and for each neuron (right). The percentage change in synapse number across time is close to zero between 6–9 dpf. n = 5 cells, 5 larvae. Scale bar: 15 μm (b). Source Data
Extended Data Fig. 3
Extended Data Fig. 3. Example of a single FoxP2.A:FingR(PSD95)+ neuron at ZT14 and ZT18.
a, A single FoxP2.A:FingR(PSD95)+ tectal neuron imaged at ZT14 and ZT18. Nuclei and synapses are FingR(PSD95)-GFP+ (green), and cellular morphology is labelled by mKate2f (magenta). b, Higher magnification of the primary dendrite segment (white box in a). Right panels show semi-automatic skeletonization (lines) of neurites and detection of FingR(PSD95)-GFP puncta (grey spheres, Methods). c, Higher magnification of a section of the distal arbour (white box in a). FingR(PSD95)-GFP+ puncta that appeared (blue circles and arrowheads) and disappeared (yellow circles and arrowheads) between ZT14 and ZT18 can be observed. d, Schematic showing imaging times (black arrows) at ZT14 and ZT18 on the night of 7 dpf. Scale bars: 10 μm (a) and 2.5 μm (b,c).
Extended Data Fig. 4
Extended Data Fig. 4. Extended tracking of single neurons over multiple days.
a, Larvae were raised on 14h–10h LD cycles (blue), on constant light (pink), or switched from LD to LL at 6 dpf (‘free running’, FR, green) and repeatedly imaged (arrows) at ZT0 and ZT10 for each day from 7–9 dpf. b-c, The average (68%CI) (b) and percentage change (c) for synapse counts at each timepoint in LD (blue), LL (pink), or FR (green) conditions from 7–9 dpf (left). Each n = neuron is plotted as a single line (right). d-e, Average synapse counts and percentage change (68%CI) for ZT0 and ZT10 combined across all tracked days for each lighting condition (LD, 13 independent experiments; LL, 4 experiments, and FR, 4 experiments). The ZT10 timepoint from 9 dpf was excluded to avoid interference from a new developmental round of synaptogenesis. f, Schematic of experiment to test whether repeated imaging affected synapse number and strength measurements. Larvae raised in LD (indicated by white and grey boxes) were either imaged six times between 7–9 dpf at ZT0 and ZT10 (Tracked, orange) or imaged at ZT0 on 7 dpf and ZT10 on 9 dpf (Control, green). g-h, Average (with 68%CI) synapse counts (g) and normalized average synapse intensity (h) at the first and last time point (7 dpf ZT0 and 9 dpf ZT10) for tracked and control larvae (left). The percentage changes in synapse number (g, right) and average synapse intensity (h, right) were not statistically different between tracked and control larvae. Controls: n = 6 neurons, 4 larvae; Tracked: n = 14 neurons, 14 larvae collected over 8 independent experiments. ns, P > 0.05 Student’s t-test, two tailed. Source Data
Extended Data Fig. 5
Extended Data Fig. 5. FoxP2.A tectal neurons have four morphological subtypes.
a, Principal component analysis using the subtype morphological features depicted in Fig. 2a. Four principal components (dotted line) account for >85% of the variance. b, The optimal number of clusters for k-means clustering was determined using the elbow method by plotting the within-cluster sum of squares. Four clusters were chosen (dotted line). c, The six features used to cluster FoxP2.A neurons (collected over 26 experiments) by morphological subtype. Boxes depict the median and interquartile range and the whiskers represent the distribution for each parameter. The slashed zero means the feature is absent. d-f (left), Synapse counts with 68%CI (d), average change (68%CI) in synapse counts (e), and percentage change (68%CI) in synapse counts (f) in different FoxP2.A tectal neuron subtypes of larvae raised in normal LD conditions. d-f (right), Each neuron is plotted, grouped by subtype. g, Average (68%CI) synapse counts of tectal subtypes (left) and for each n= neuron (right) across multiple days under clock-break (LL) conditions. Note the lack of Type 2 neurons in LL. h, Average (68%CI) synapse counts during the subjective day or night under clock-break conditions. i, Average change (68%CI) in synapse counts (left) and single neurons (right) across multiple days under clock-break conditions, sorted by tectal subtype. j, the average change (68%CI) in synapse counts for the subjective day and night under clock-break conditions. Data in g-j are from 4 independent experiments. Source Data
Extended Data Fig. 6
Extended Data Fig. 6. FingR(PSD95):GFP signal intensity increases during the day and decreases at night in some, but not all tectal subtypes.
a, Average and 68% CI of normalized synapse intensity on LD, LL, and FR conditions across one day and night for a subset of tectal neurons from Fig. 2 imaged under identical microscopy settings to enable intensity measurements. Note that the loss of the circadian clock alters the relative abundance of Type 1 and Type 2 neurons. b, Percentage change (mean and 68% CI) in normalized synapse intensity calculated as in Fig. 1. Compared to Type 2 neurons, Type 3 (p = 0.026; g = 1.777) and Type 4 (p = 0.026; g = 1.651) neurons have increased synapse intensities during the day (mixed ANOVA, interaction (subtype*time) p = 0.03, post-hoc Benjamini-Hochberg, one tailed). c, Both Type 3 (p = 0.026; g = 1.691) and Type 4 (p = 0.026; g = 1.408) neurons have significantly increased synapse intensities (with 68%CI) during the day relative to clock-break (LL) conditions (mixed ANOVA, interaction (condition*time) p = 0.006, post-hoc Benjamini-Hochberg, one tailed). Data are collected from 8 independent LD, 4 LL, and 4 FR experiments. Source Data
Extended Data Fig. 7
Extended Data Fig. 7. Tectal subtype labelling does not bias larval sleep amount and sleep-wake states have non-uniform effects on synapses within neuronal compartments.
a, Schematic of behavioural and synapse tracking experiment set up. Larval locomotor behaviour was tracked on a 14 h–10 h LD cycle from 6–8 dpf. The average activity ( ± 95% CI) of 10 example larvae are plotted across two days and nights. Larvae were removed from the tracking arena and imaged at lights on (ZT0) and again at ZT10 (dotted red bars). White and grey boxes indicate day and night periods, respectively. b, 7 dpf Larvae had similar levels of sleep and sleep bout lengths at night ( ± SEM) regardless of the FoxP2.A tectal neurons subtype labelled in each larva (ns, p > 0.05, Kruskal-Wallis; 5 independent experiments). c, For each neuron/larva, the average percentage change of synapse number is plotted versus the average 7 dpf night-time sleep. d, Type 2 tectal neurons were divided into four segments: the primary neurite, proximal arbour, inter-arbour area, and distal arbour. e, The average and 68% CI of synapse number and intensity dynamics within each of the four segments. Grey lines represent segments from individual neurons. *P = 0.037, repeated-measures ANOVA with Greenhouse-Geisser correction. f, Proximal and distal arbours synapse number dynamics are not correlated. The relationship between the absolute and relative (%) synapse number change of the proximal and distal arbours of individual Type 2 neurons during the day and night phase. Linear regressions in c and f are fitted with 95% CI. Source Data
Extended Data Fig. 8
Extended Data Fig. 8. Sleep deprivation affects synapse number in tectal neuron subtypes.
a, Percentage change of total sleep (left) and average sleep bout length (right) of each larva (dots) in the 6 hr post SD (ZT18-24, 7dpf), normalized to the circadian-matched time at 6 dpf. The black lines depict the average ± SEM. *P < 0.02, one-way ANOVA. b, The SD method did not alter circadian clock phase as measured by the bioluminescence driven by a Tg(per3-luc) reporter line for the clock gene per3 expression. The detrended per3 bioluminescence rhythms ( ± 95%CI) remained in phase for both SD (n = 14 larvae) and control (n = 12) larvae over multiple days of constant dark conditions. Circadian time (CT = 0 last lights ON transition). c, The percentage change in synapse number within each neuron between imaging sessions at ZT14 and ZT18, and between imaging at ZT18 and ZT24. d, Average (68%CI) for net synapse change per hour for FoxP2.A tectal subtypes in control or sleep deprived larvae. Type 3, but not Type 4 neurons significantly gain synapses after SD (Mixed ANOVA, post-hoc Benjamini-Hochberg, one tailed **p = 0.01, g = 1.266) and subsequently lose them (p = 0.014, g = −1.034) relative to controls. Type 2 lacks enough matched controls to assess. e, Sleep amount for early and late sleepers in the early (ZT14-18) and late (ZT18-24) phase of the night (5 independent experiments). The black lines depict the average ± SEM. f, For each neuron/larva, changes in synapse number during extended wakefulness did not correlate with either the subsequent total sleep or average sleep bout lengths (mean ± 95% CI). g, Changes in synapse numbers for each neuron/larva did not significantly correlate with the average sleep bout lengths during the early and late night of controls, or after SD (mean ± 95% CI). *P ≤ 0.05, **P ≤ 0.01, ***P ≤ 0.001, ****P ≤ 0.0001, Mixed ANOVA interaction (condition*time), post-hoc Benjamini-Hochberg, two tailed. Source Data
Extended Data Fig. 9
Extended Data Fig. 9. Examples of manipulated single FoxP2.A:FingR(PSD95)+ neurons and clonidine and evidence that daytime drug treatment reduced sleep the following night.
a, left Example FoxP2.A:FingR(PSD95)+ tectal neurons imaged before (ZT14), immediately after (ZT18), and 6 h after (ZT24) sleep deprivation and control. Nuclei and synapses are FingR(PSD95)-GFP+ (green), and cellular morphology is labelled by mKate2f (magenta). Right, Higher magnification (dotted white box) showing the same dendritic segments at each time point, with examples of synapses lost (yellow arrows and dotted circles) or gained (blue arrows and circles). Note that, for illustrative purposes, the dendrites are depicted at a different angle in these higher magnification images. b, An example neuron before (ZT5) or after (ZT10) exposure to clonidine and 2-chloroadenosine. Scale bars: 15 μm (a, b left) and 5 μm (a, b right). c, Larvae (n = 80) exposed to lights OFF at mid-day (ZT8, first arrow in schematic) took longer to sleep (mean ± SEM) compared to lights OFF at the end of day (ZT14, 2nd arrow). ****P = 2.27 × 10⁻¹⁵, Kruskal-Wallis. d, Average locomotor activity ( ± 95%CI) on a 14 hr:10 hr LD cycle before, during, and after a 5 hr midday (ZT5-10, 7 dpf, shaded purple panel) exposure to melatonin (n = 31 larvae), clonidine (n = 32), or DMSO (n = 32). Data from two independent experiments. e, Larvae treated with either melatonin or clonidine from ZT5-10 had reduced and delayed sleep ( ± SEM) in first hour of the night (ZT14-15) compared to controls. *P < 0.05, **P < 0.01, ****P < 0.0001 Dunnett’s Test. Source Data
Extended Data Fig. 10
Extended Data Fig. 10. Drug-evoked day time sleep induces synapse loss only when clonidine and 2-chloroadenosine are co-administered.
a-b, Clonidine-, 2-chloroadenosine-, and/or melatonin-treated larvae have a lower average activity ( ± SEM) and longer average sleep bout lengths ( ± SEM) during the 5 hr drug period compared to DMSO treated controls. c, The average percentage change in synapse number ( ± SEM) within each neuron of DMSO, clonidine-, 2-chloroadenosine-, and/or melatonin-treated larvae. *P < 0.05, **P < 0.01, ****P < 0.0001 Kruskal-Wallis with post-hoc Dunn’s test (b left and right; and c, left) or one-way ANOVA (a right, c right). d, The average activity of larvae before, during and after treatment with either 30 µM clonidine or DMSO from ZT5-10 (purple shaded area) at 7 dpf. 1-minute dark pulses were given every 30 min during the treatment period to test for responsiveness. e, Higher resolution time-course of average locomotor activity during the drug treatment and dark-pulse period (ZT5-10). f, Both clonidine and DMSO-treated larvae respond to dark pulse with an increase in locomotion, known as the visuomotor response or dark photokinesis. Shown is the average locomotor response to a single 1-minute dark pulse delivered at ZT7. g, Locomotor activity for each larva-treated with clonidine (1-minute bin) at the time of dark pulse (ZT7) shown in d. Of the 13 larvae that were inactive at the onset of the 1-minute dark pulse, 12 rapidly increased their locomotor activity within 1 min. Source Data
Extended Data Fig. 11
Extended Data Fig. 11. FoxP2.A+ neurons express adenosine and adrenergic receptors transcripts.
Examples of adrenergic and adenosine receptor transcripts that colocalize with labelled FoxP2.A+ neurons (middle and right panel) as detected by in situ Hybridization Chain Reaction (HCR, see Methods). a, A single labelled tectal neuron (green) colocalizes with a cocktail of HCR probes that detect adora1a-b (yellow, encoding for adenosine receptors A1a and A1b) and adora2aa, -ab, -b (magenta, encoding for adenosine receptors A2aa, A2ab, and A2b) transcripts. b, Single FoxP2.A+ neuron (green) also colocalize with an HCR probe cocktail that detects adra1 aa,-ab, -ba, -bb, -d (yellow, encoding zebrafish α1 adrenergic receptor orthologs) and adra2a, -c, -da (magenta, encoding zebrafish α2 adrenergic receptor orthologs) transcripts. Scale bar: 10 μm (a, b). Representative data from 5 larvae. Images of co-localized transcripts chosen from n = 11 neurons (a) and n = 10 neurons (b).

References

    1. Anafi RC, Kayser MS, Raizen DM. Exploring phylogeny to find the function of sleep. Nat. Rev. Neurosci. 2019;20:109–116. doi: 10.1038/s41583-018-0098-9. - DOI - PubMed
    1. Tononi G, Cirelli C. Sleep and the Price of Plasticity: From Synaptic and Cellular Homeostasis to Memory Consolidation and Integration. Neuron. 2014;81:12–34. doi: 10.1016/j.neuron.2013.12.025. - DOI - PMC - PubMed
    1. de Vivo L, et al. Ultrastructural evidence for synaptic scaling across the wake/sleep cycle. Science (80-.). 2017;355:507–510. doi: 10.1126/science.aah5982. - DOI - PMC - PubMed
    1. Maret S, Faraguna U, Nelson AB, Cirelli C, Tononi G. Sleep and waking modulate spine turnover in the adolescent mouse cortex. Nat. Neurosci. 2011;14:1418–1420. doi: 10.1038/nn.2934. - DOI - PMC - PubMed
    1. Van Dongen HPA, Maislin G, Mullington JM, Dinges DF. The cumulative cost of additional wakefulness: Dose-response effects on neurobehavioral functions and sleep physiology from chronic sleep restriction and total sleep deprivation. Sleep. 2003;26:117–126. doi: 10.1093/sleep/26.2.117. - DOI - PubMed