. 2024 May;629(8013):869-877.
doi: 10.1038/s41586-024-07377-1. Epub 2024 May 1.

Airway hillocks are injury-resistant reservoirs of unique plastic stem cells

Affiliations

Airway hillocks are injury-resistant reservoirs of unique plastic stem cells

Brian Lin et al. Nature. 2024 May.

Abstract

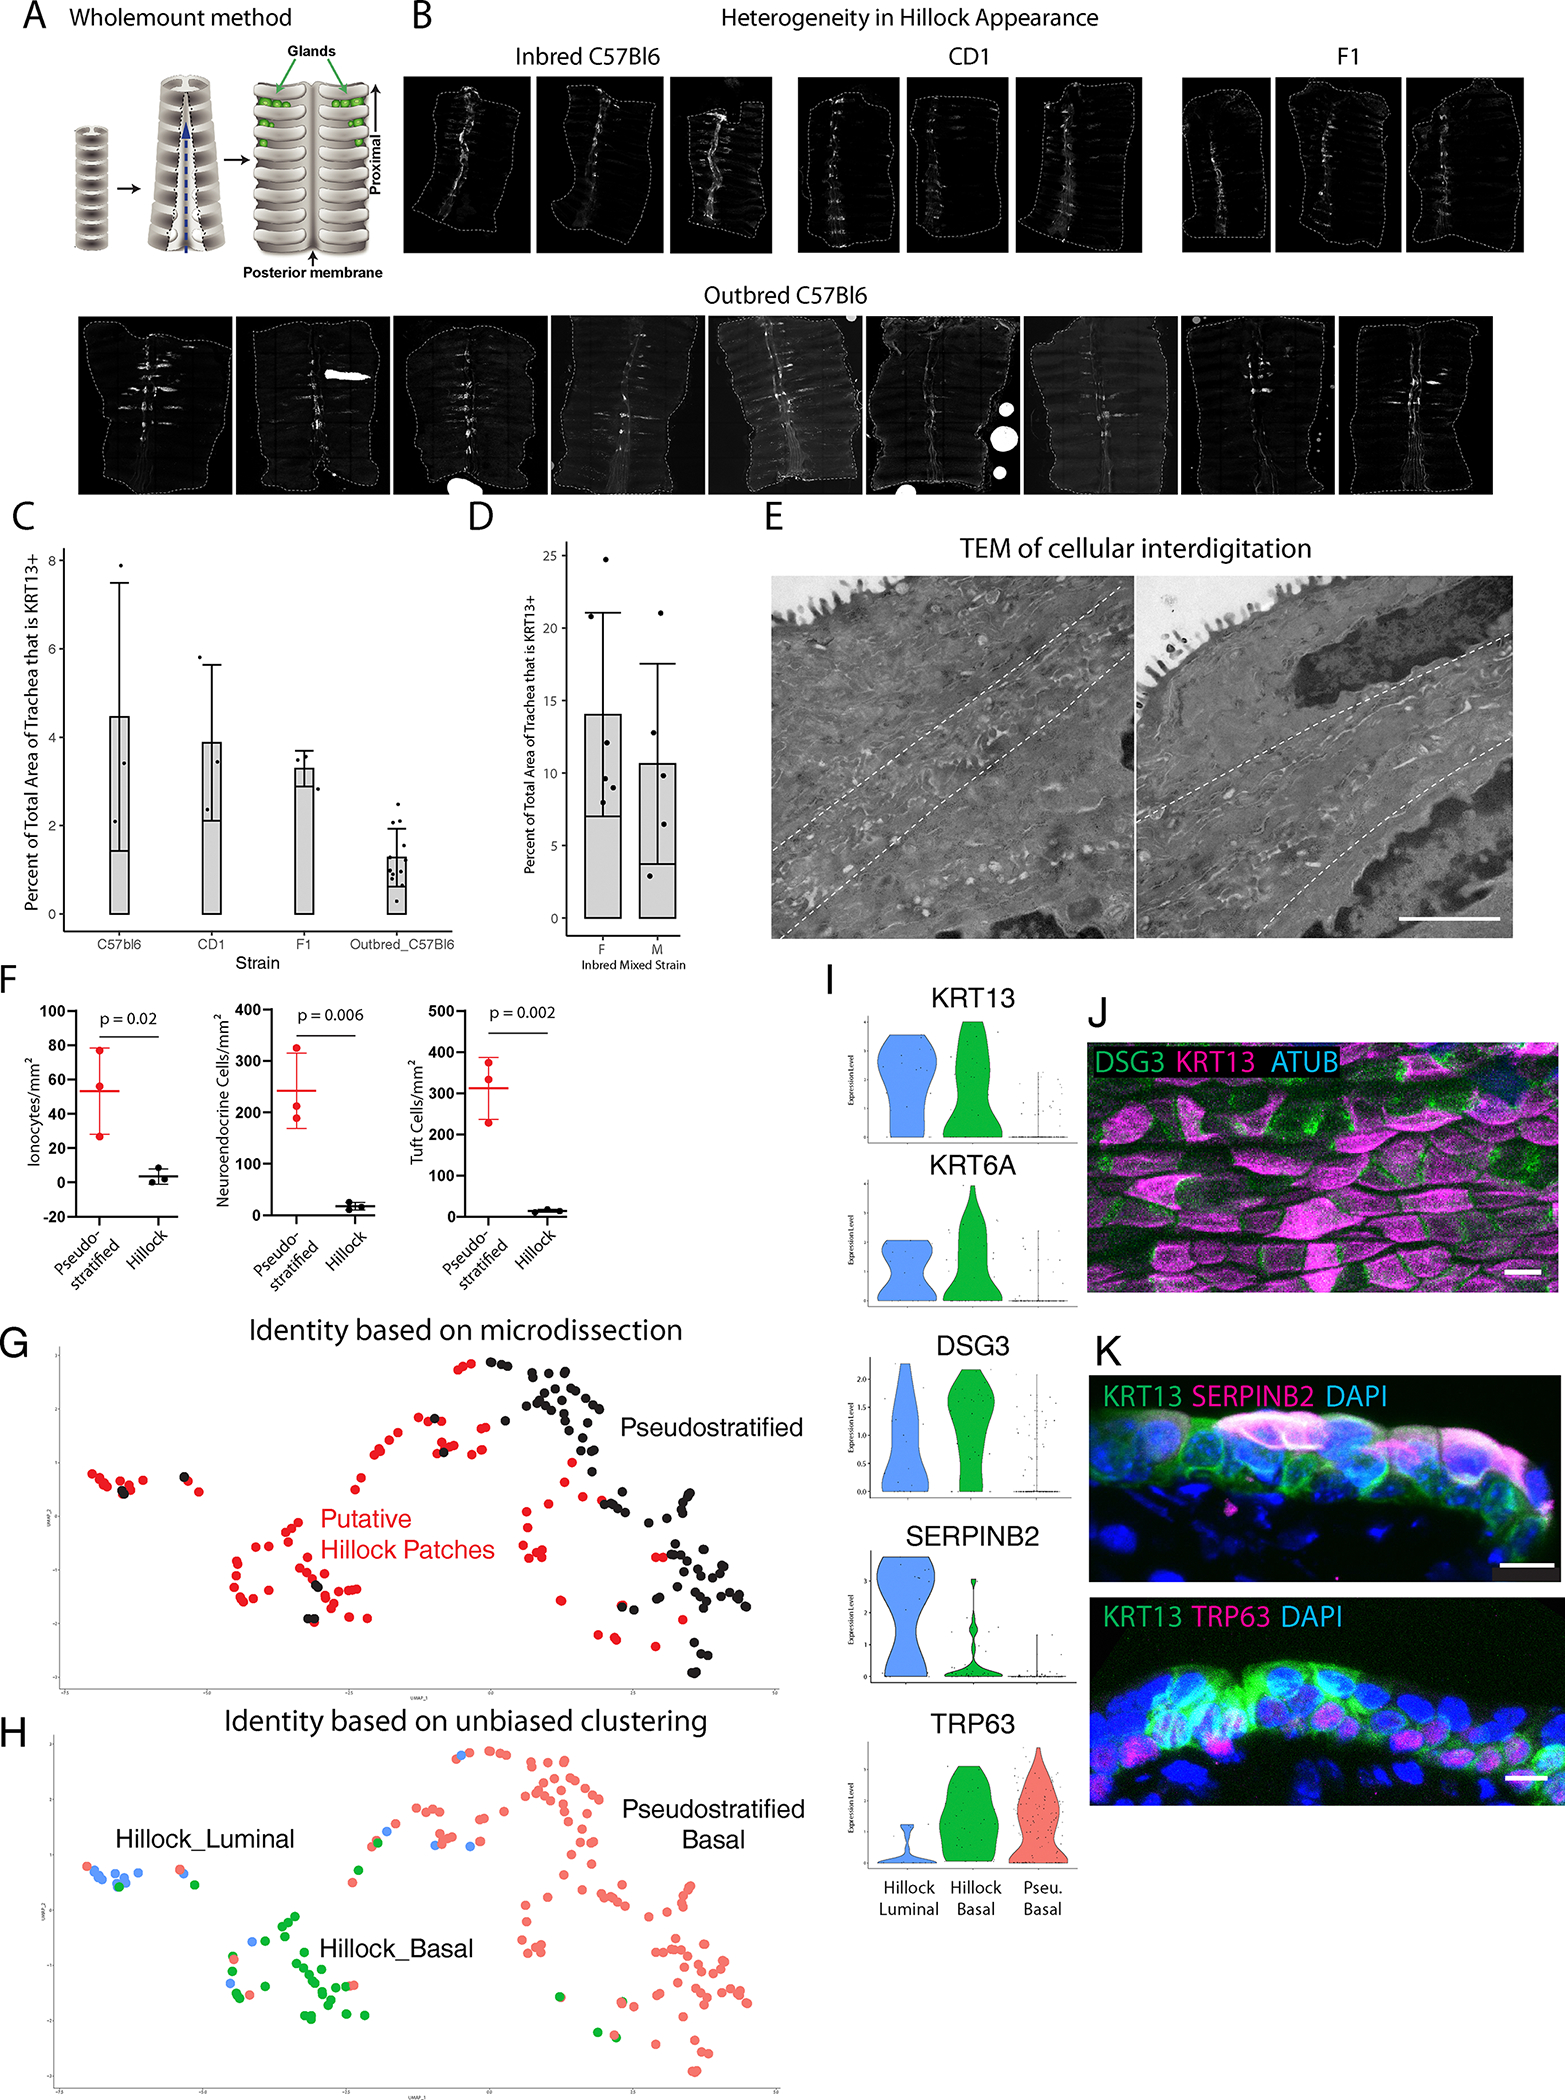
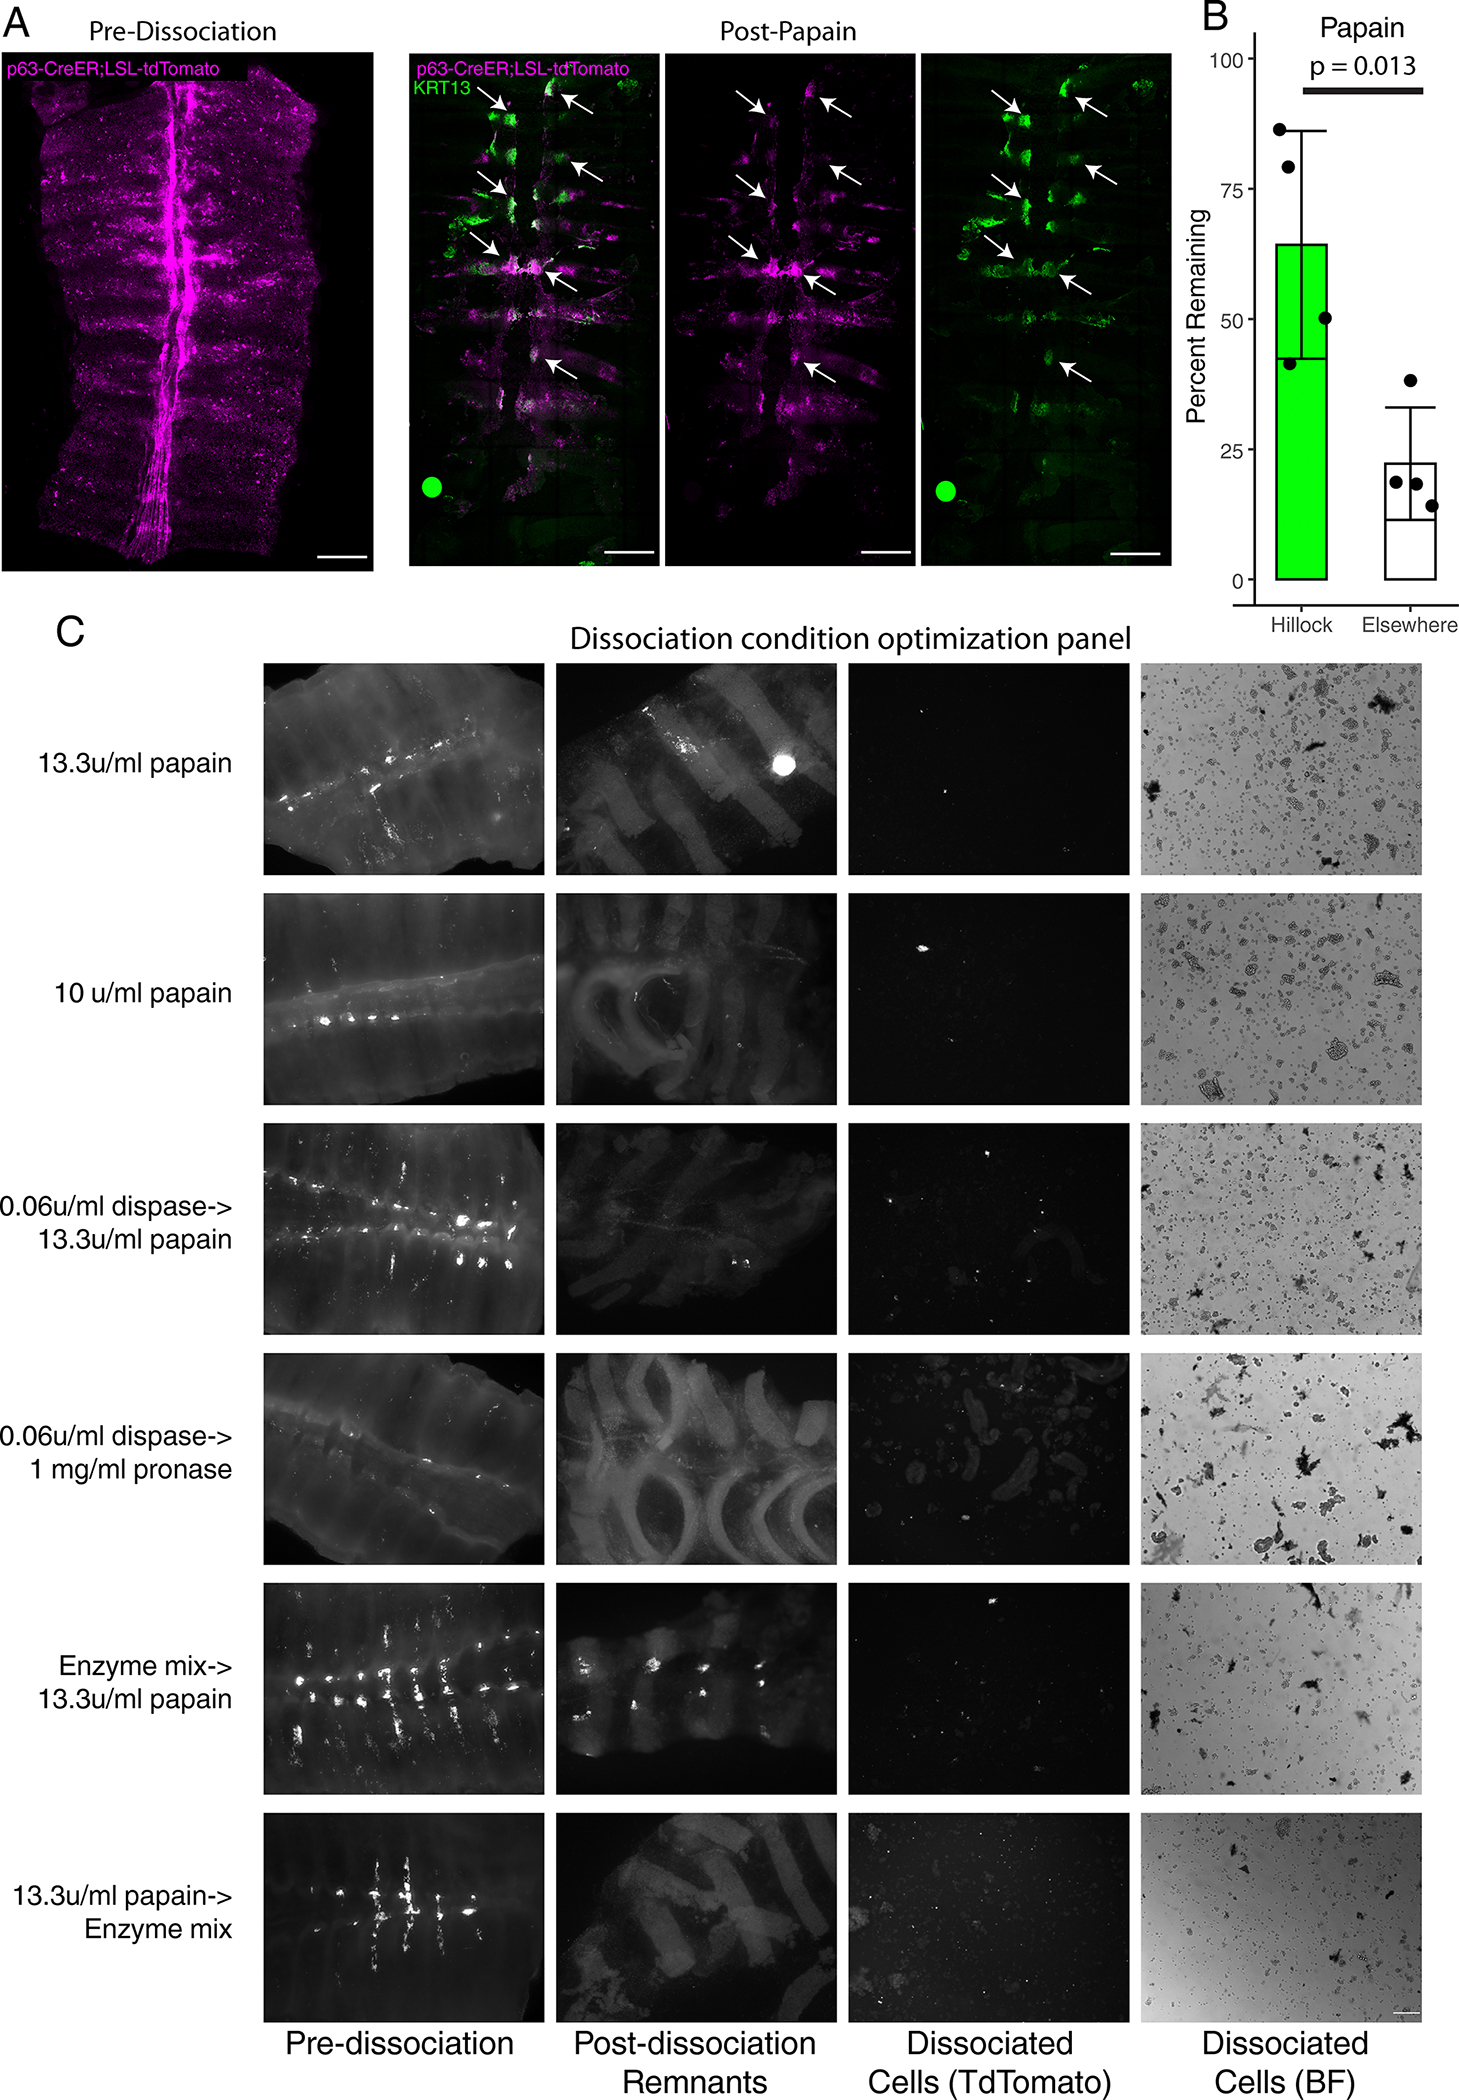
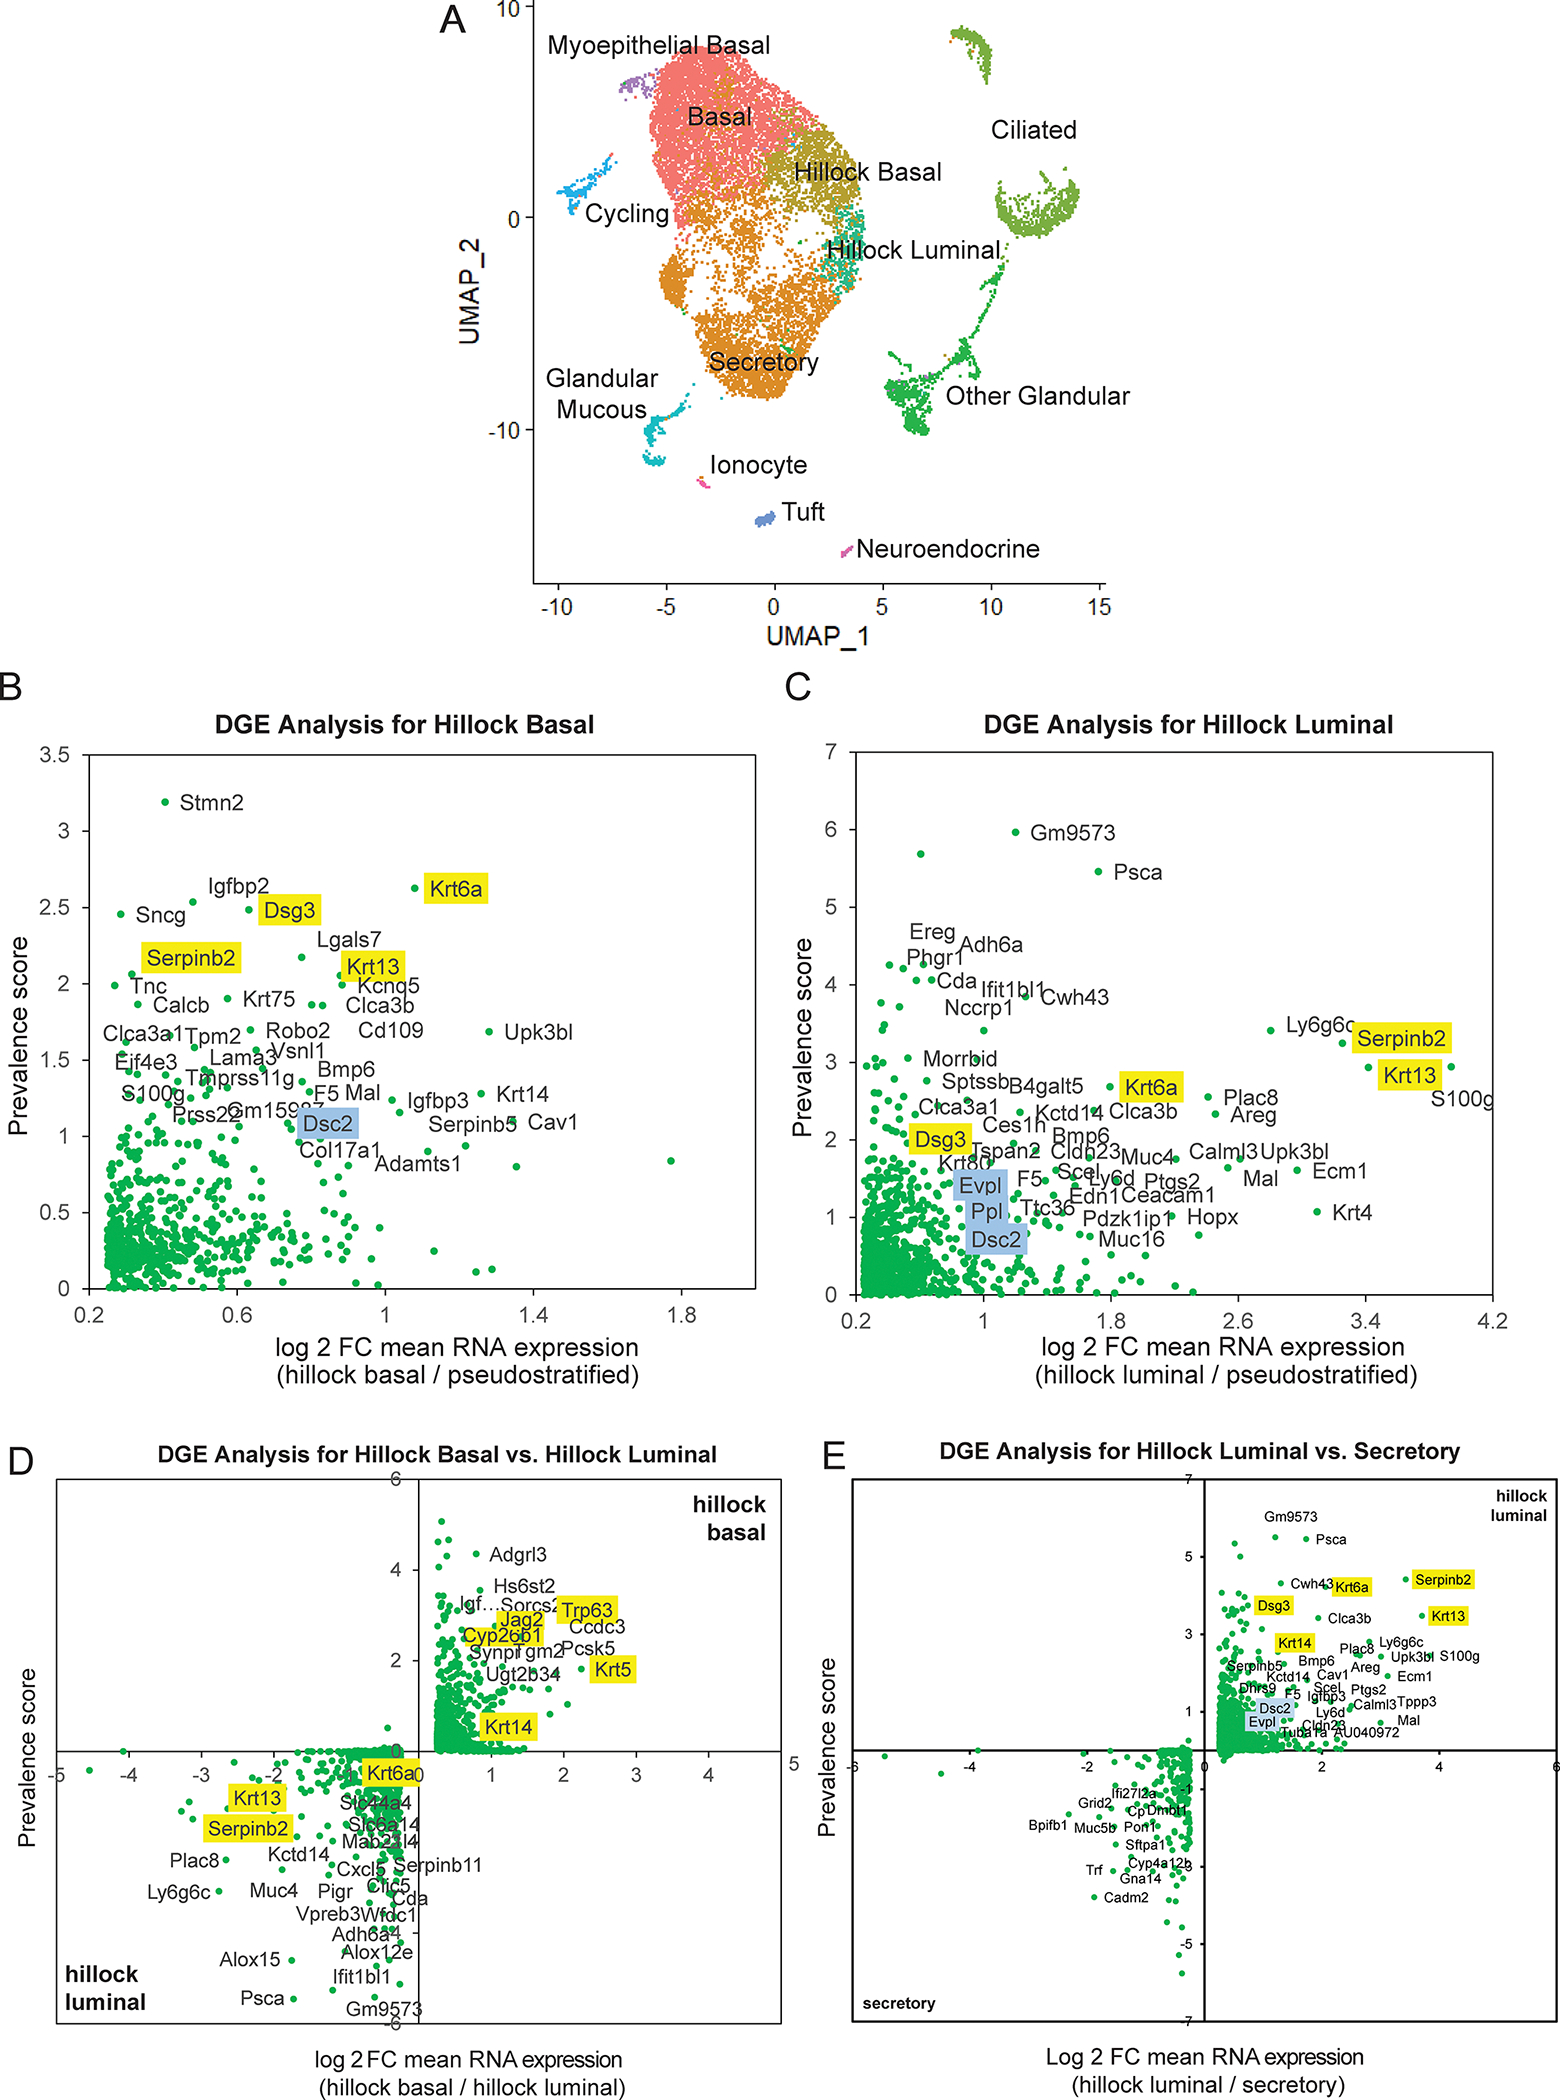
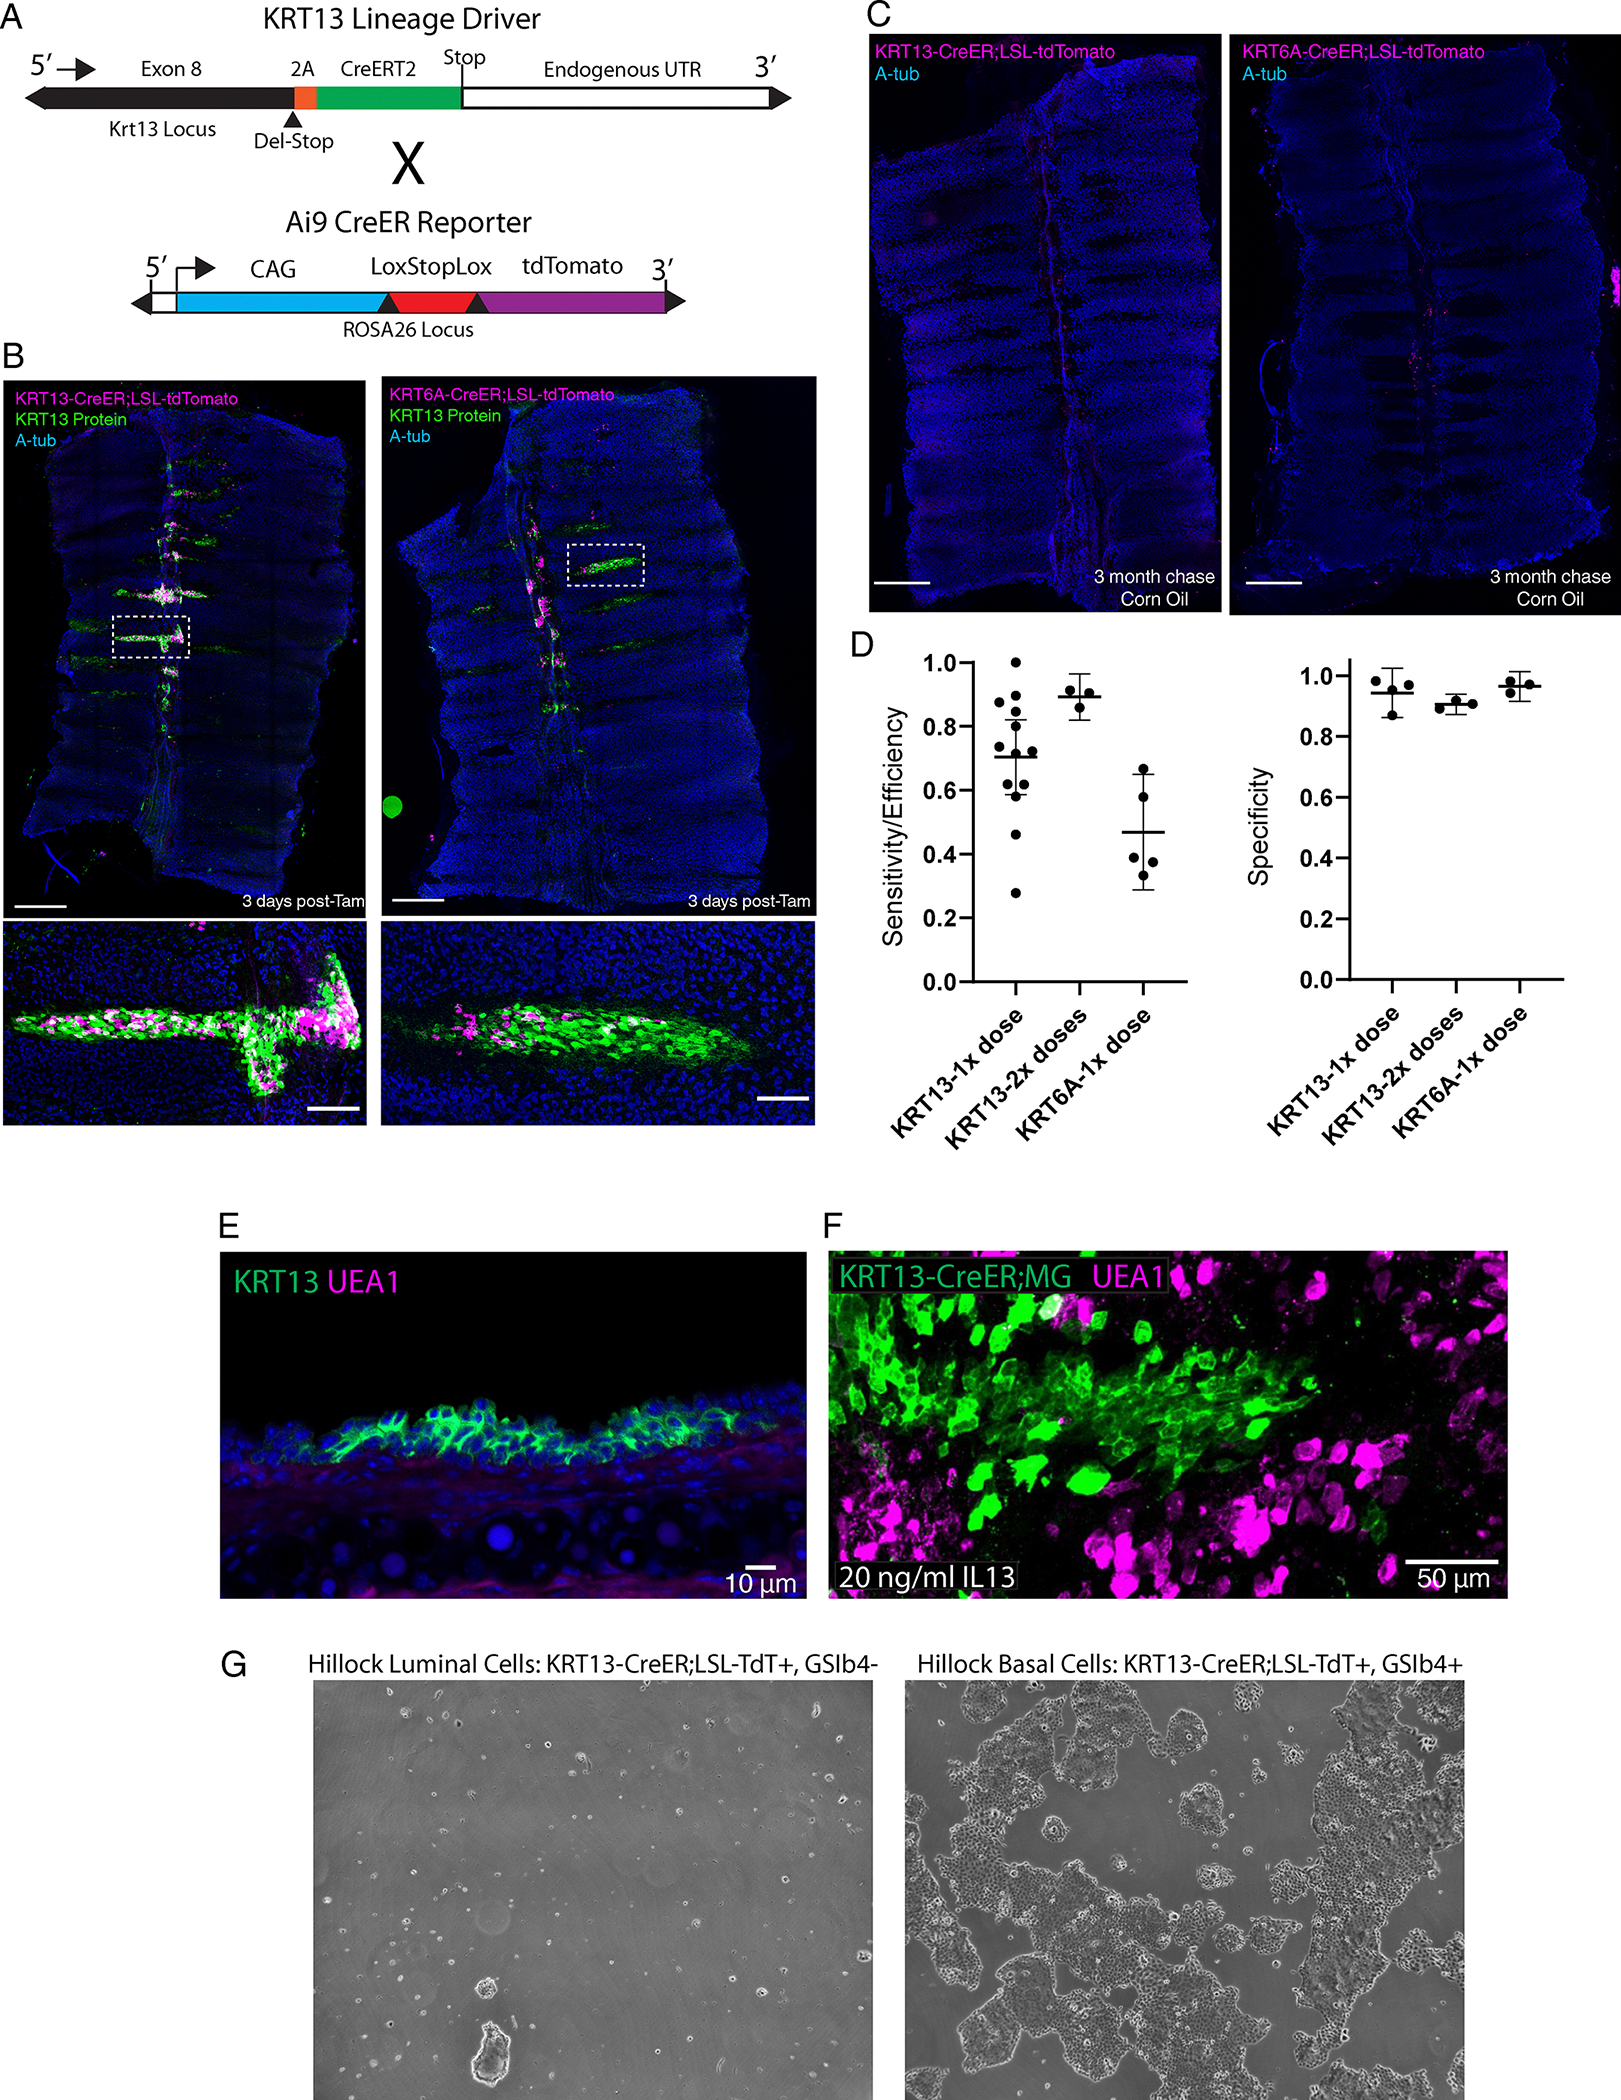
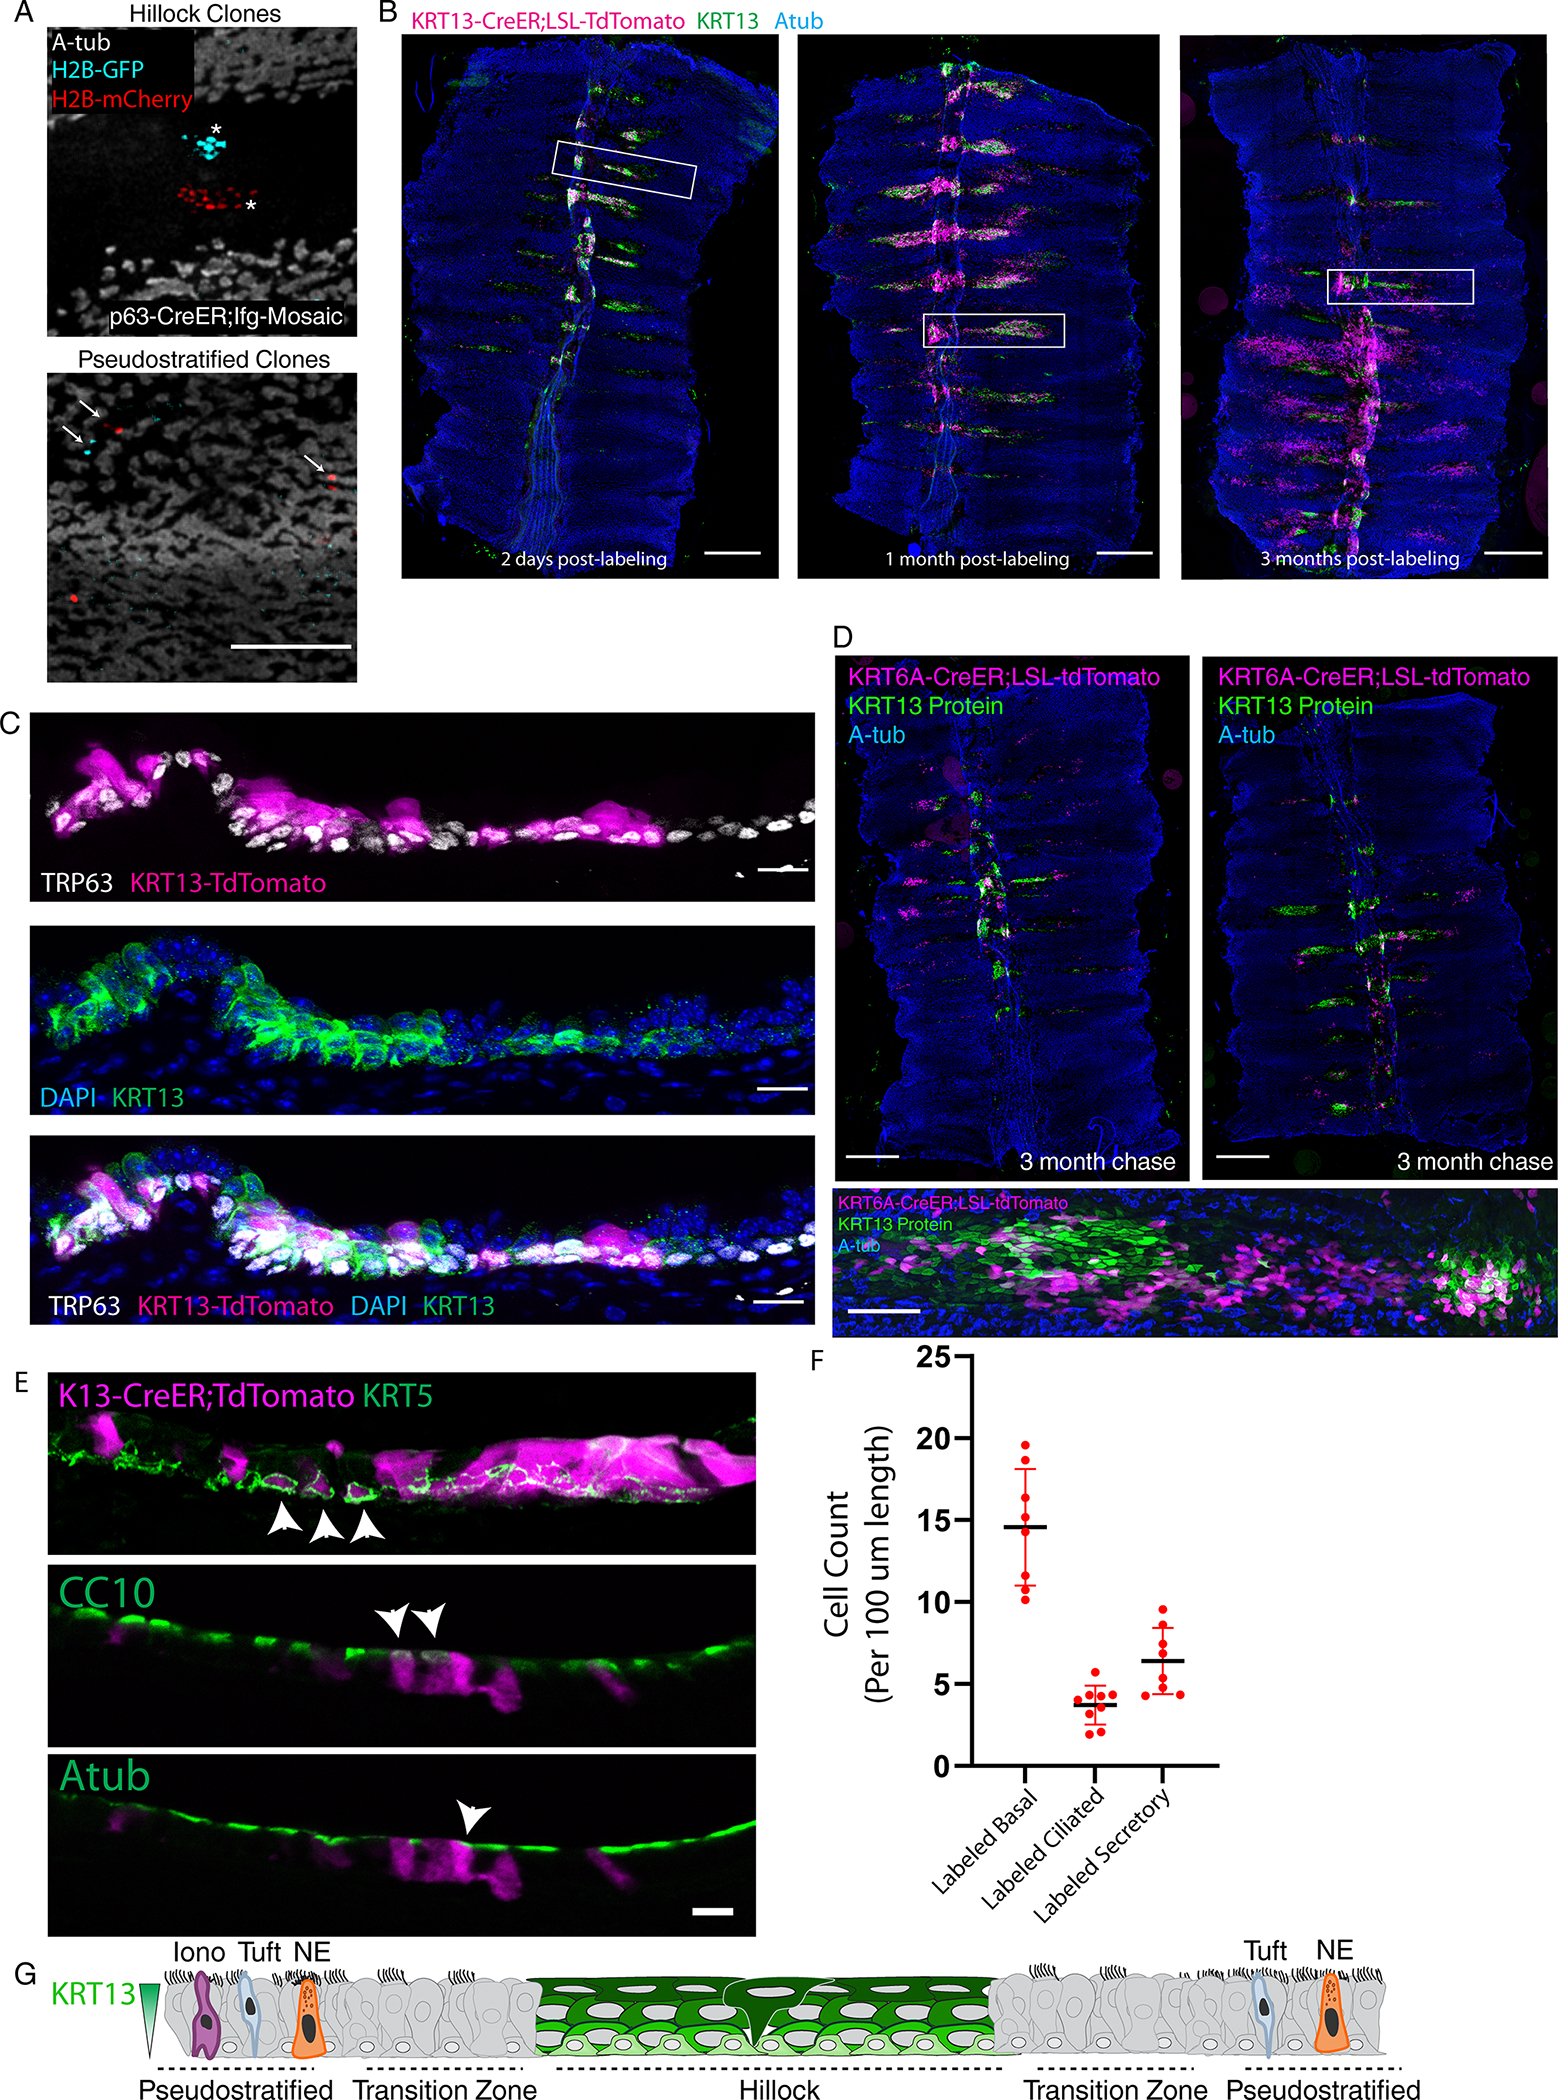
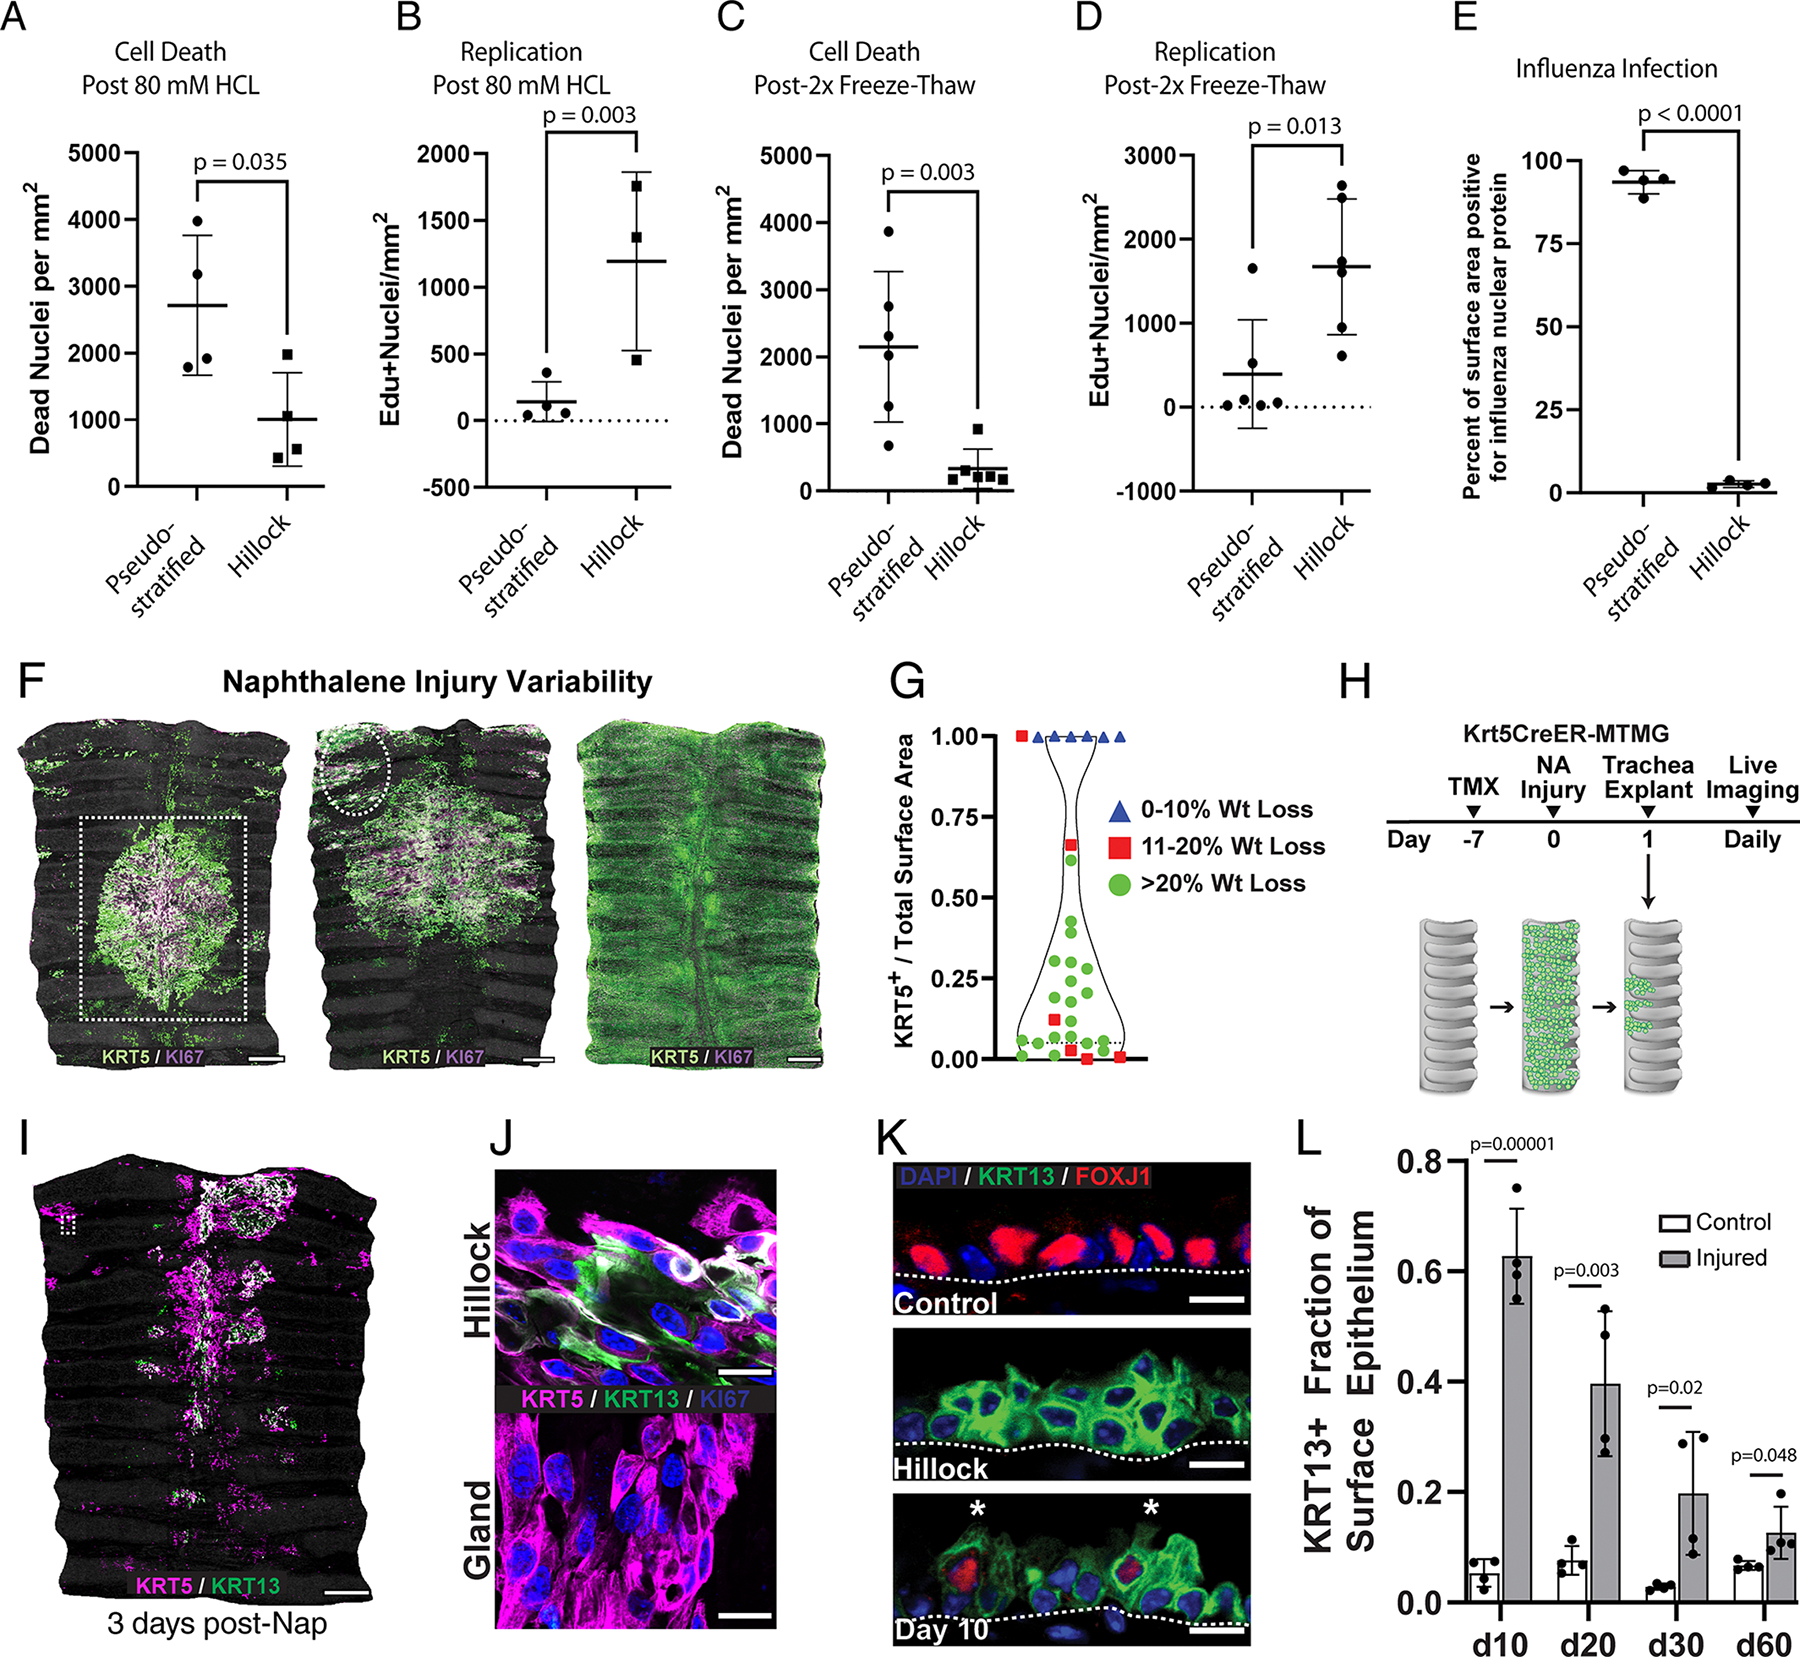
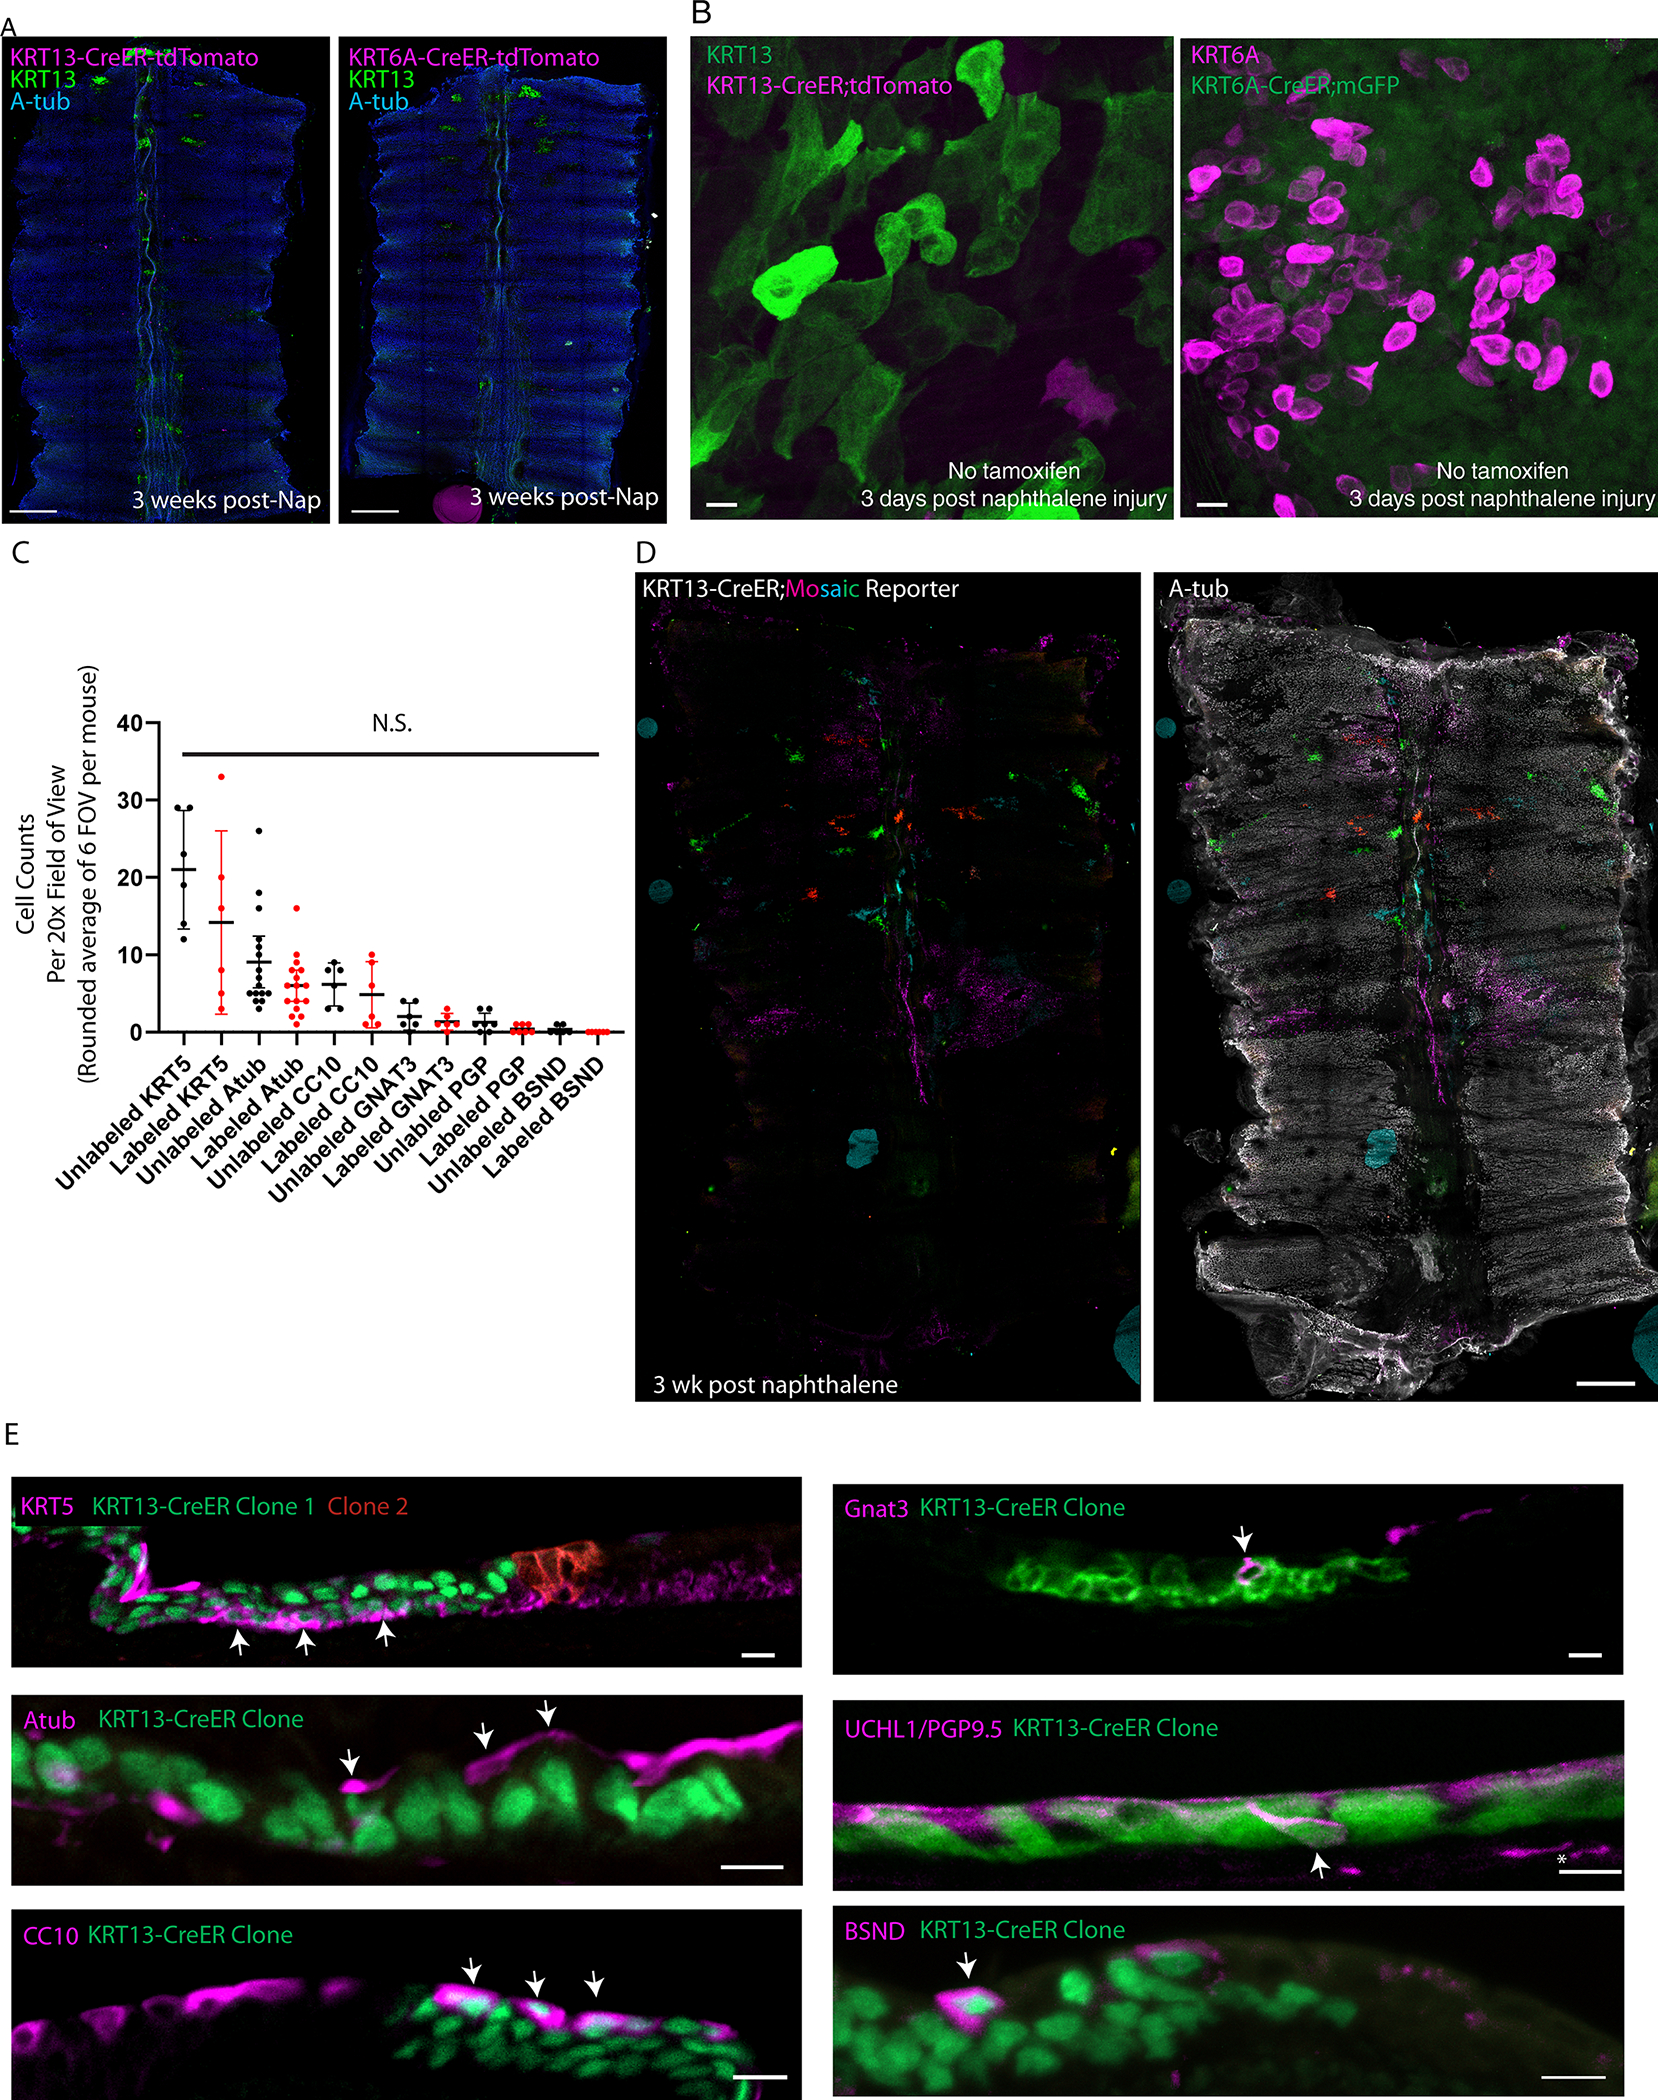
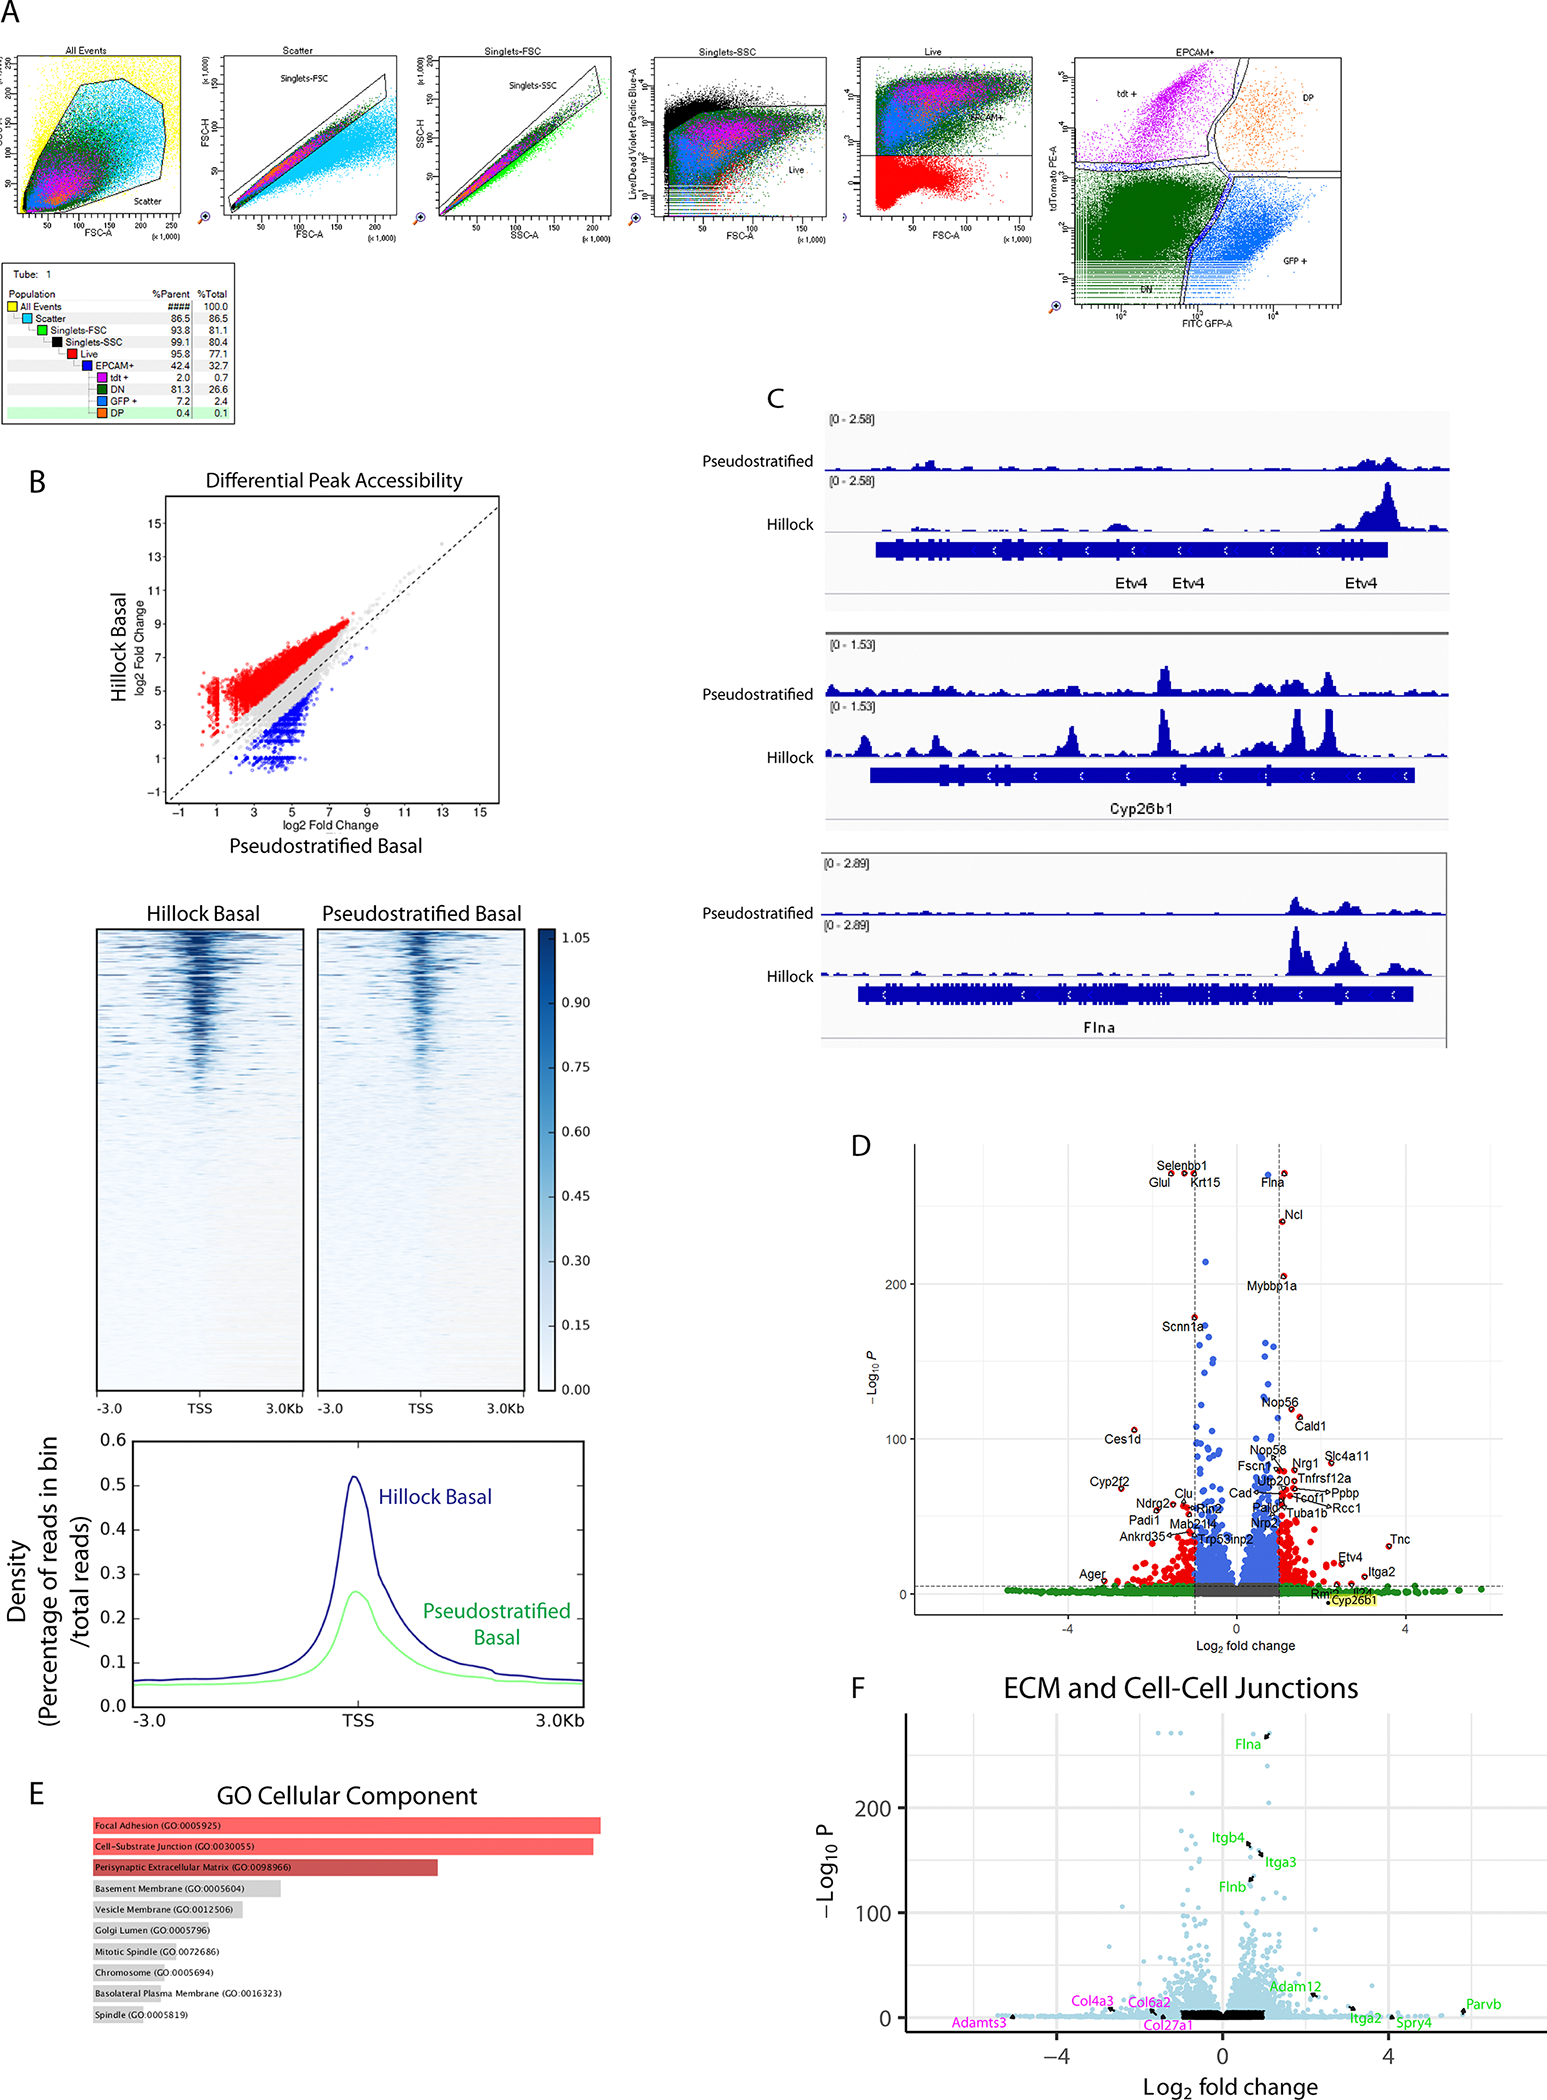
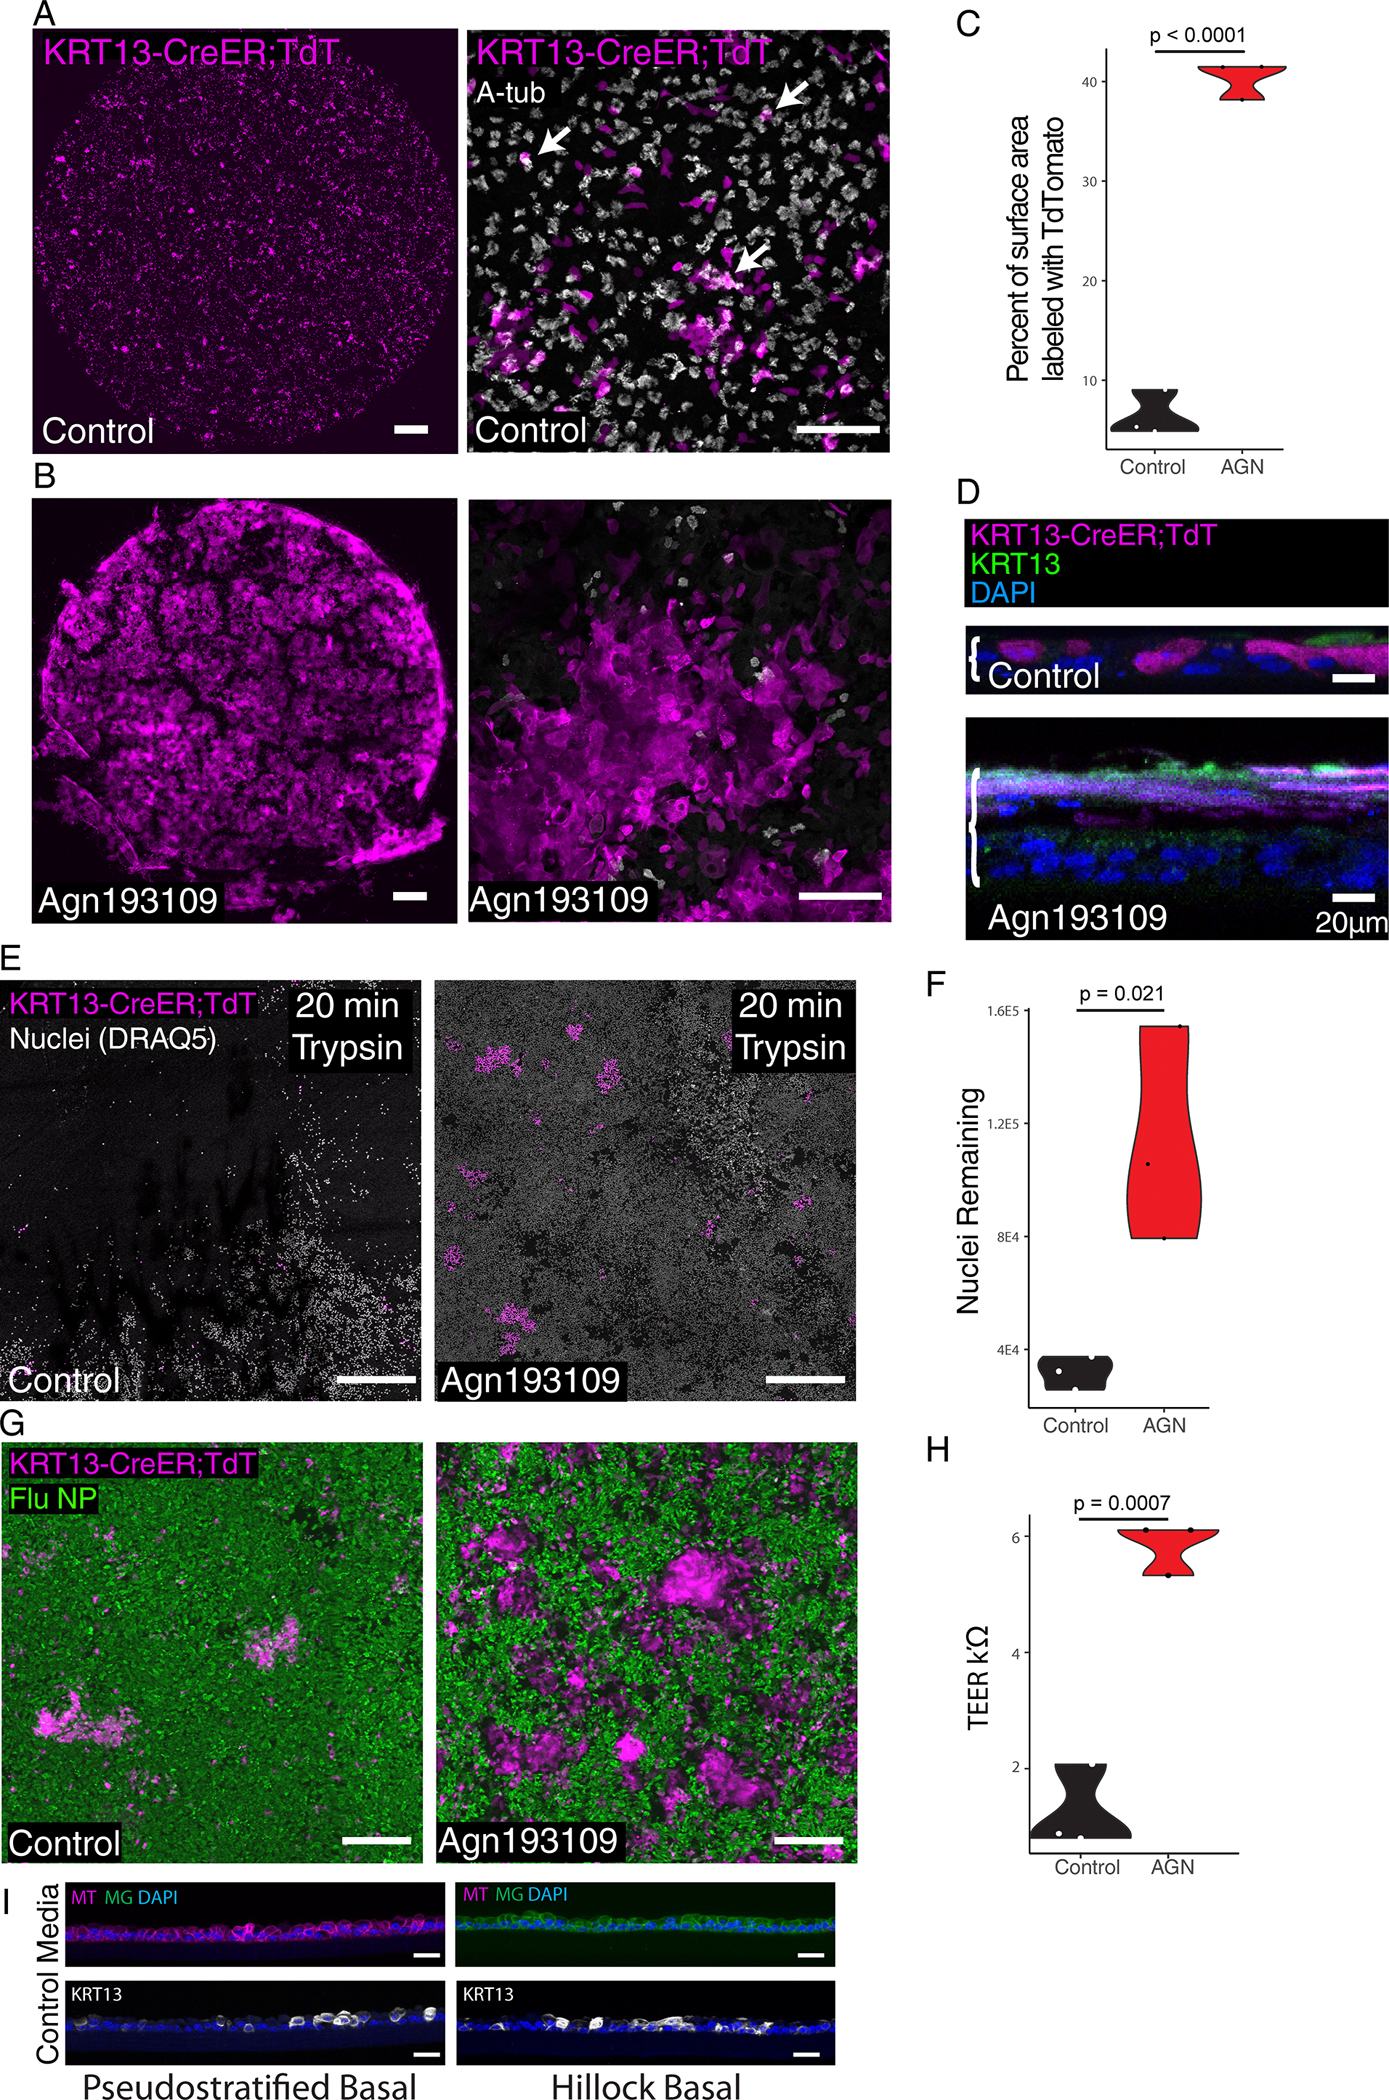
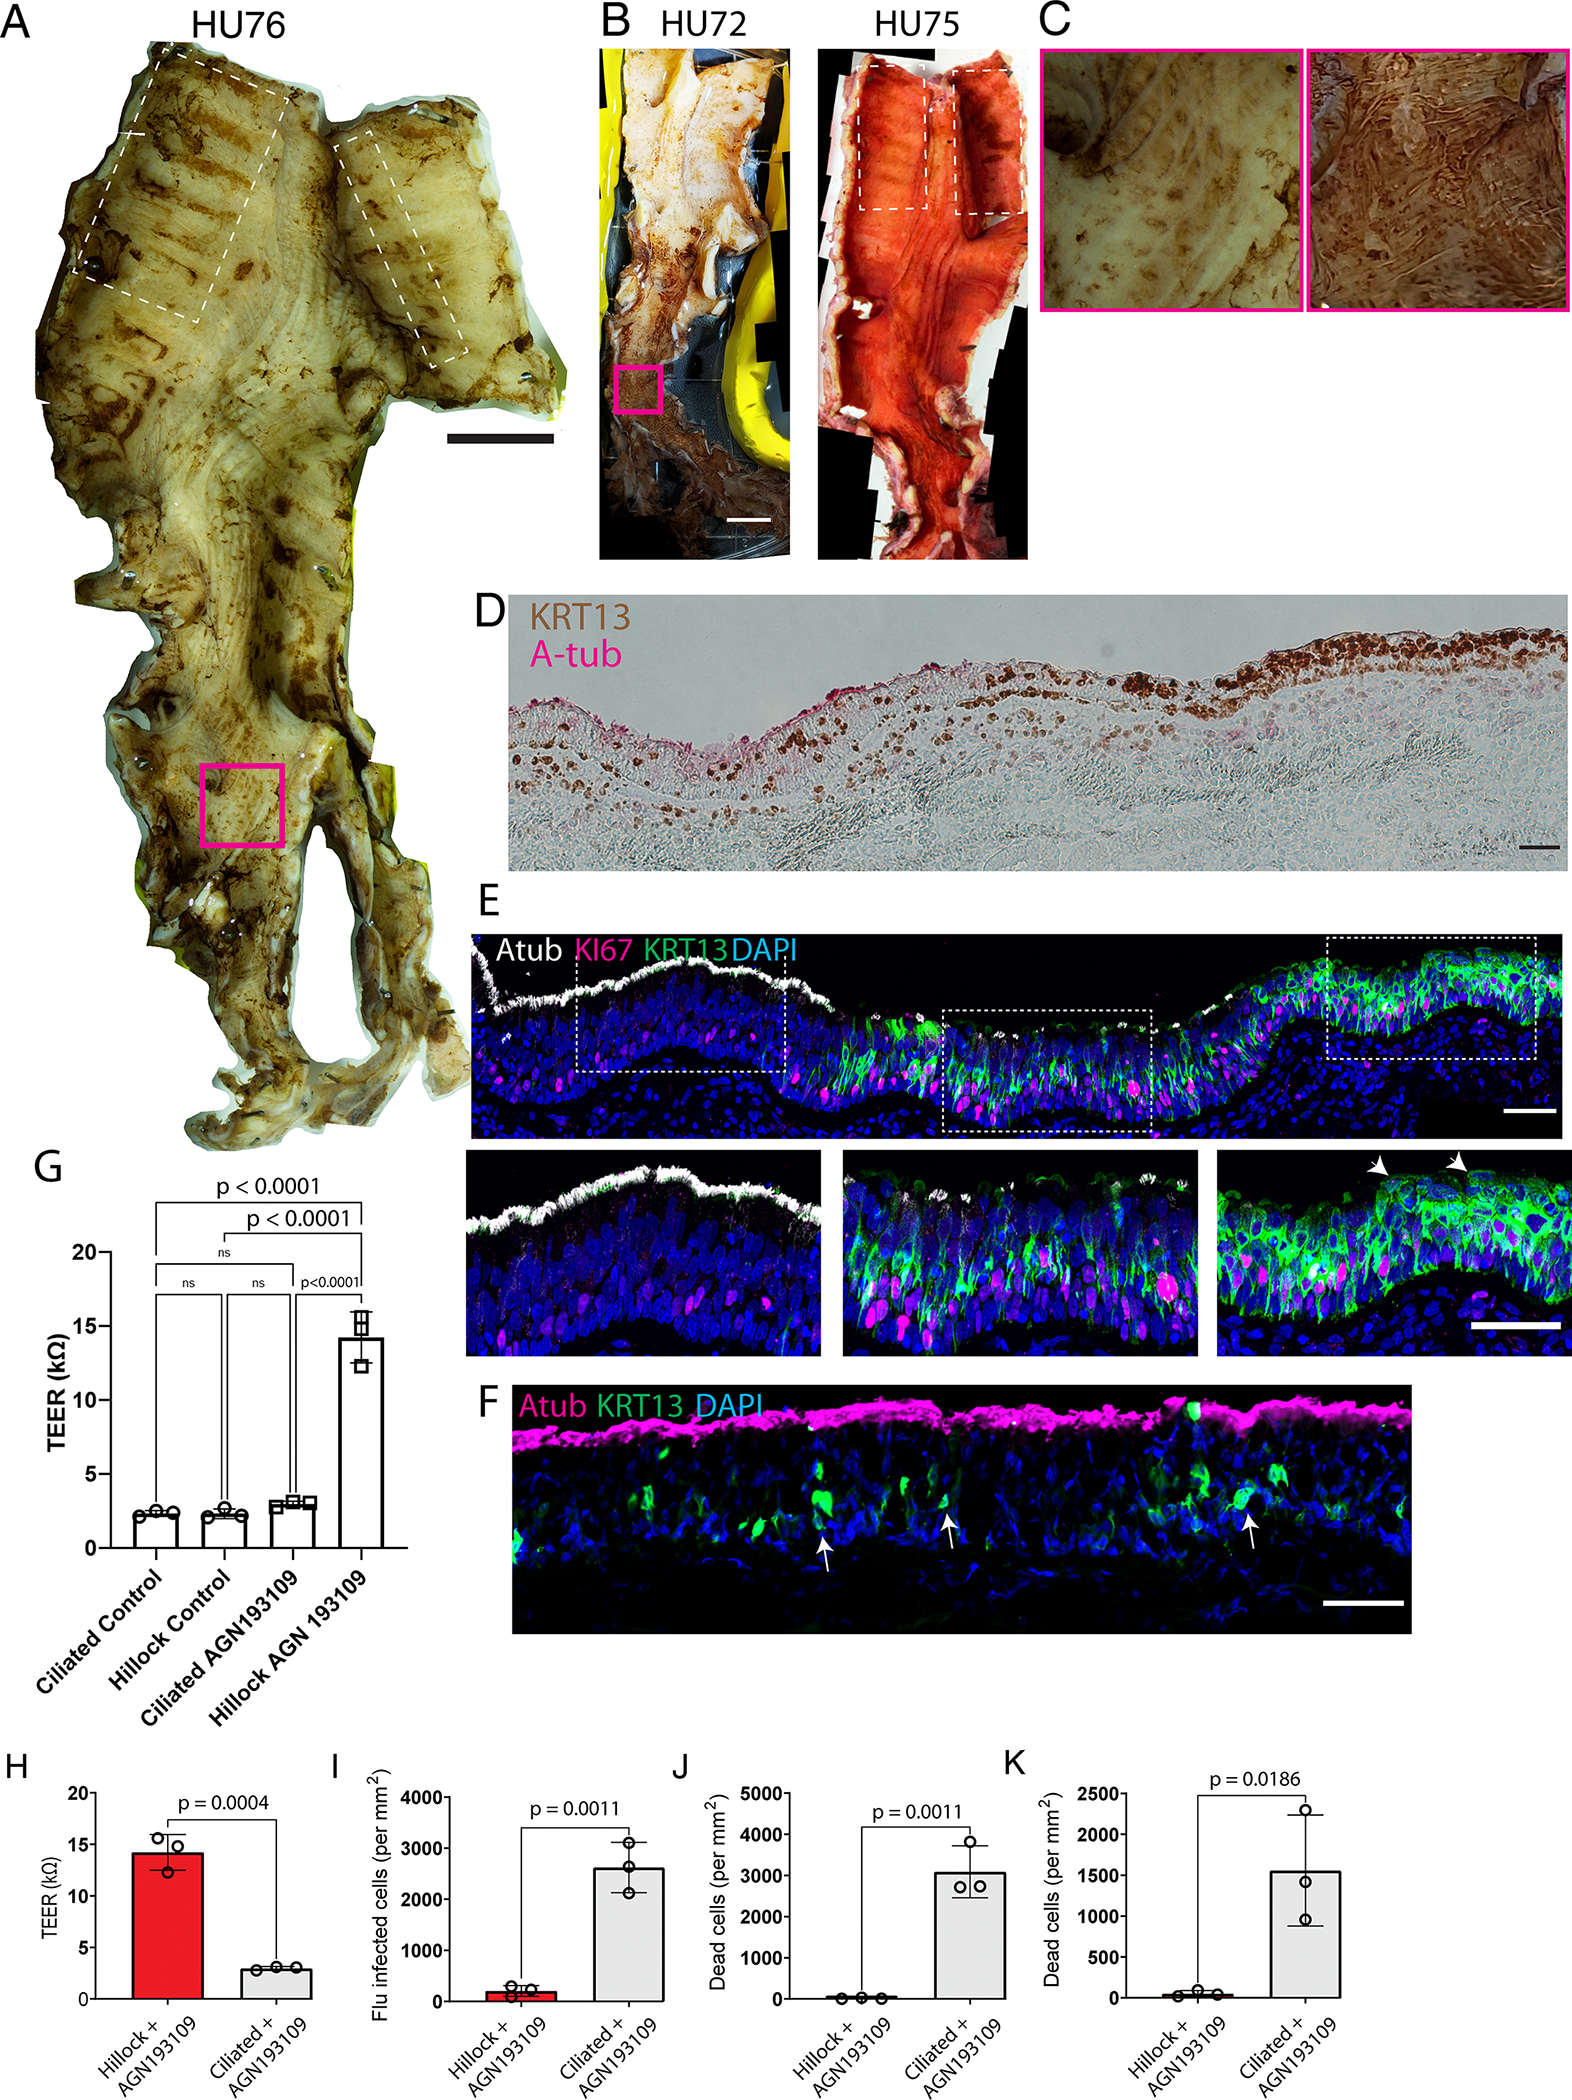
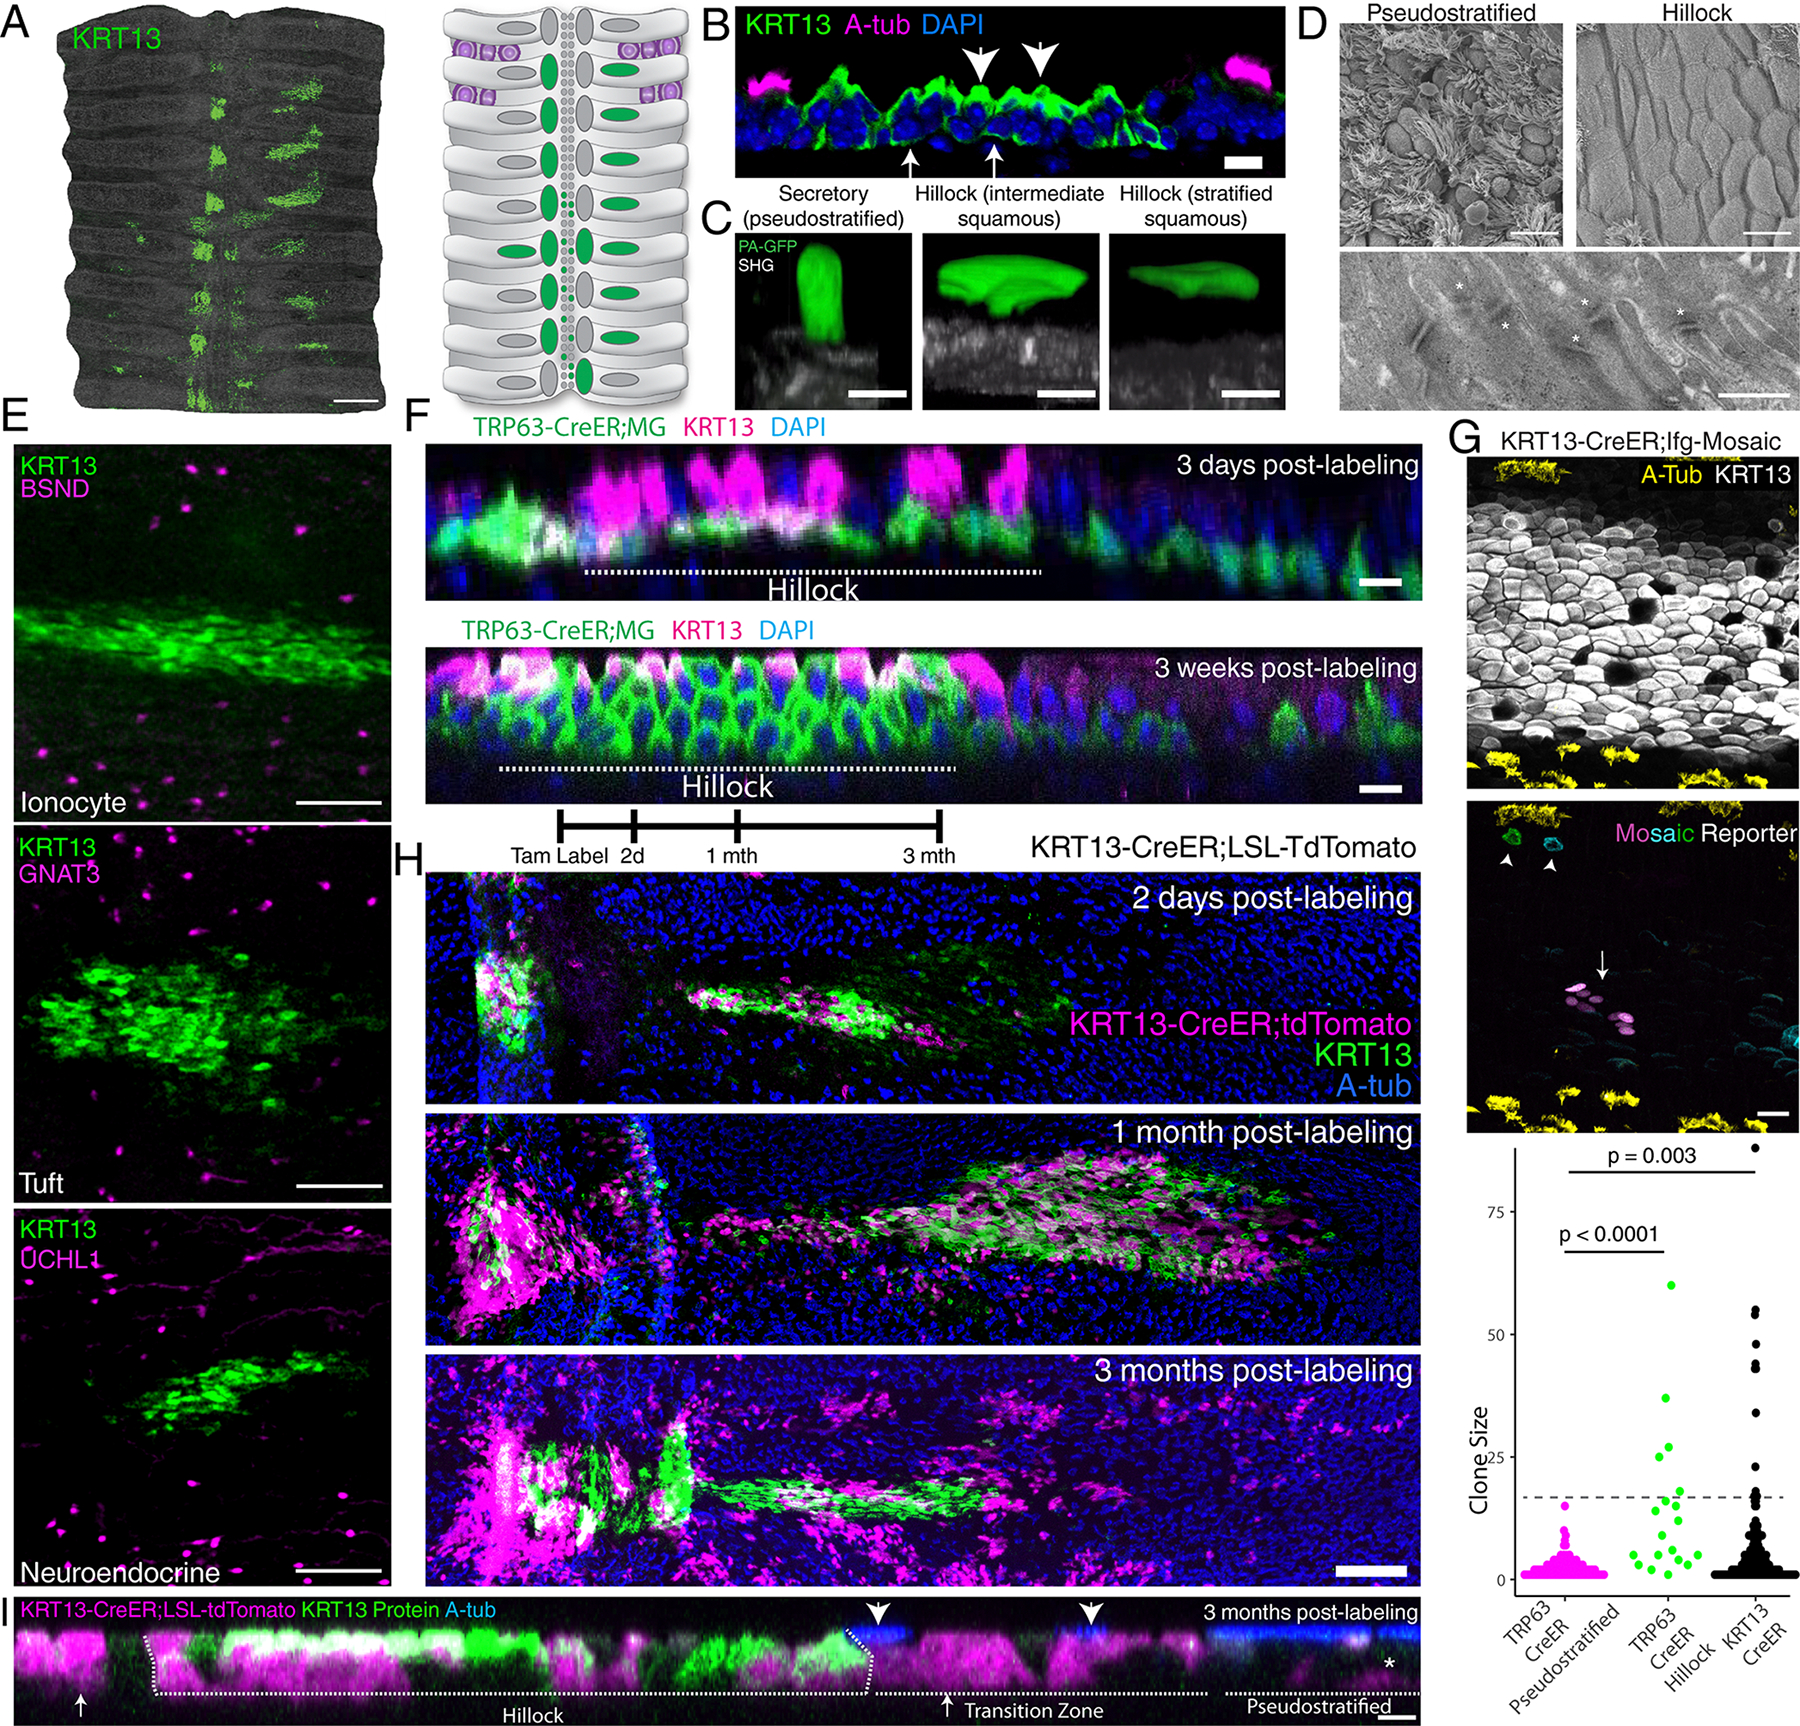
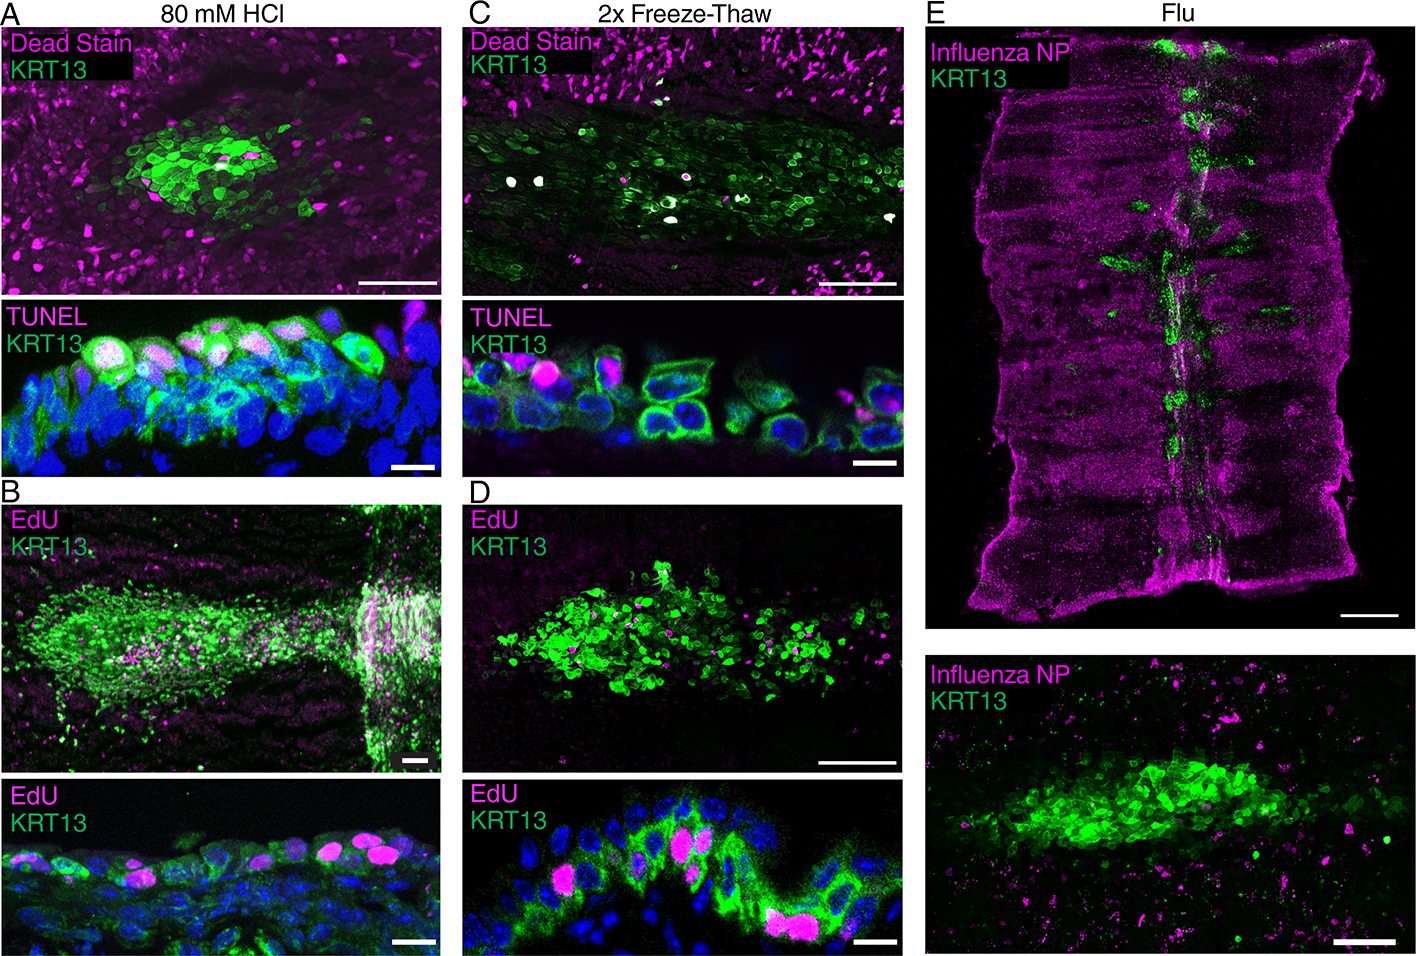
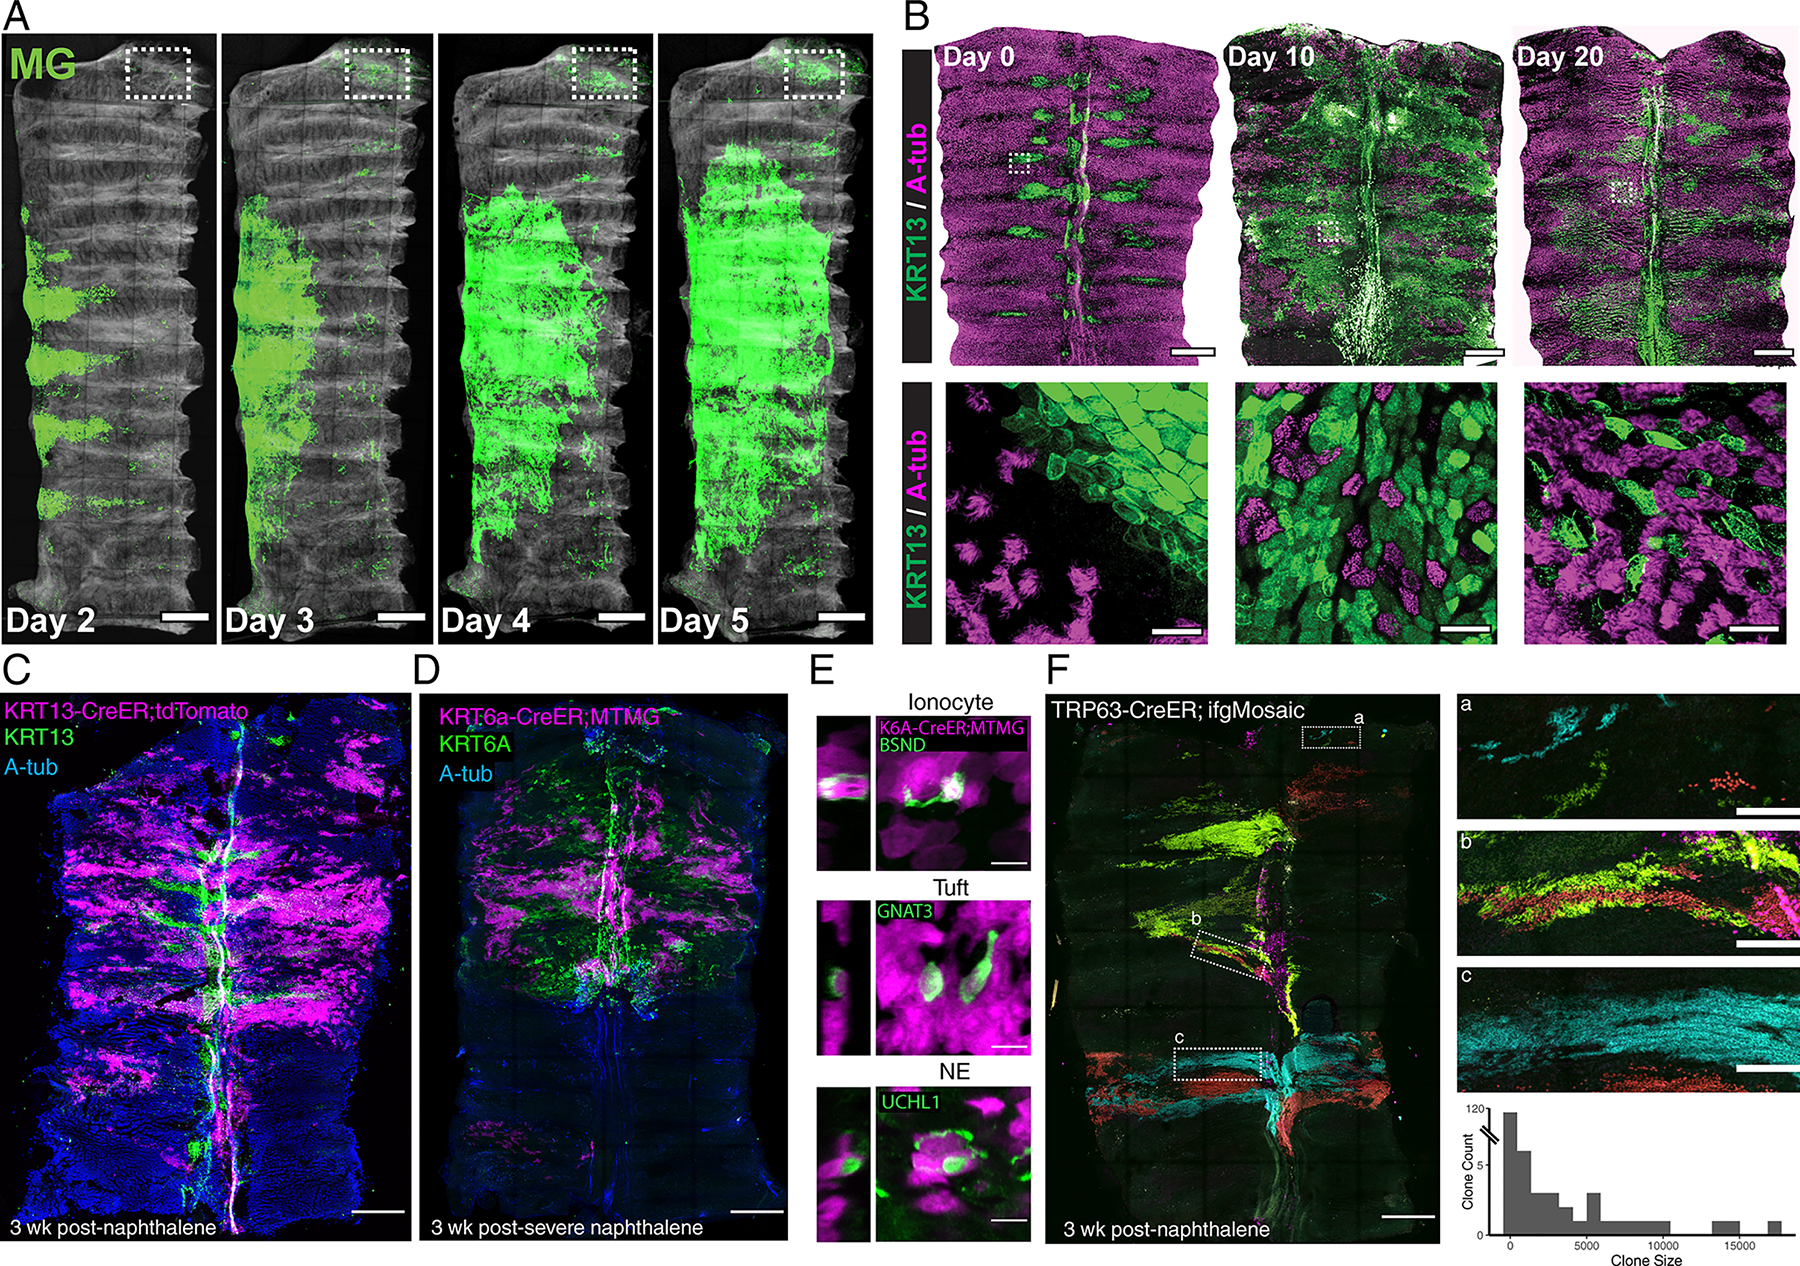
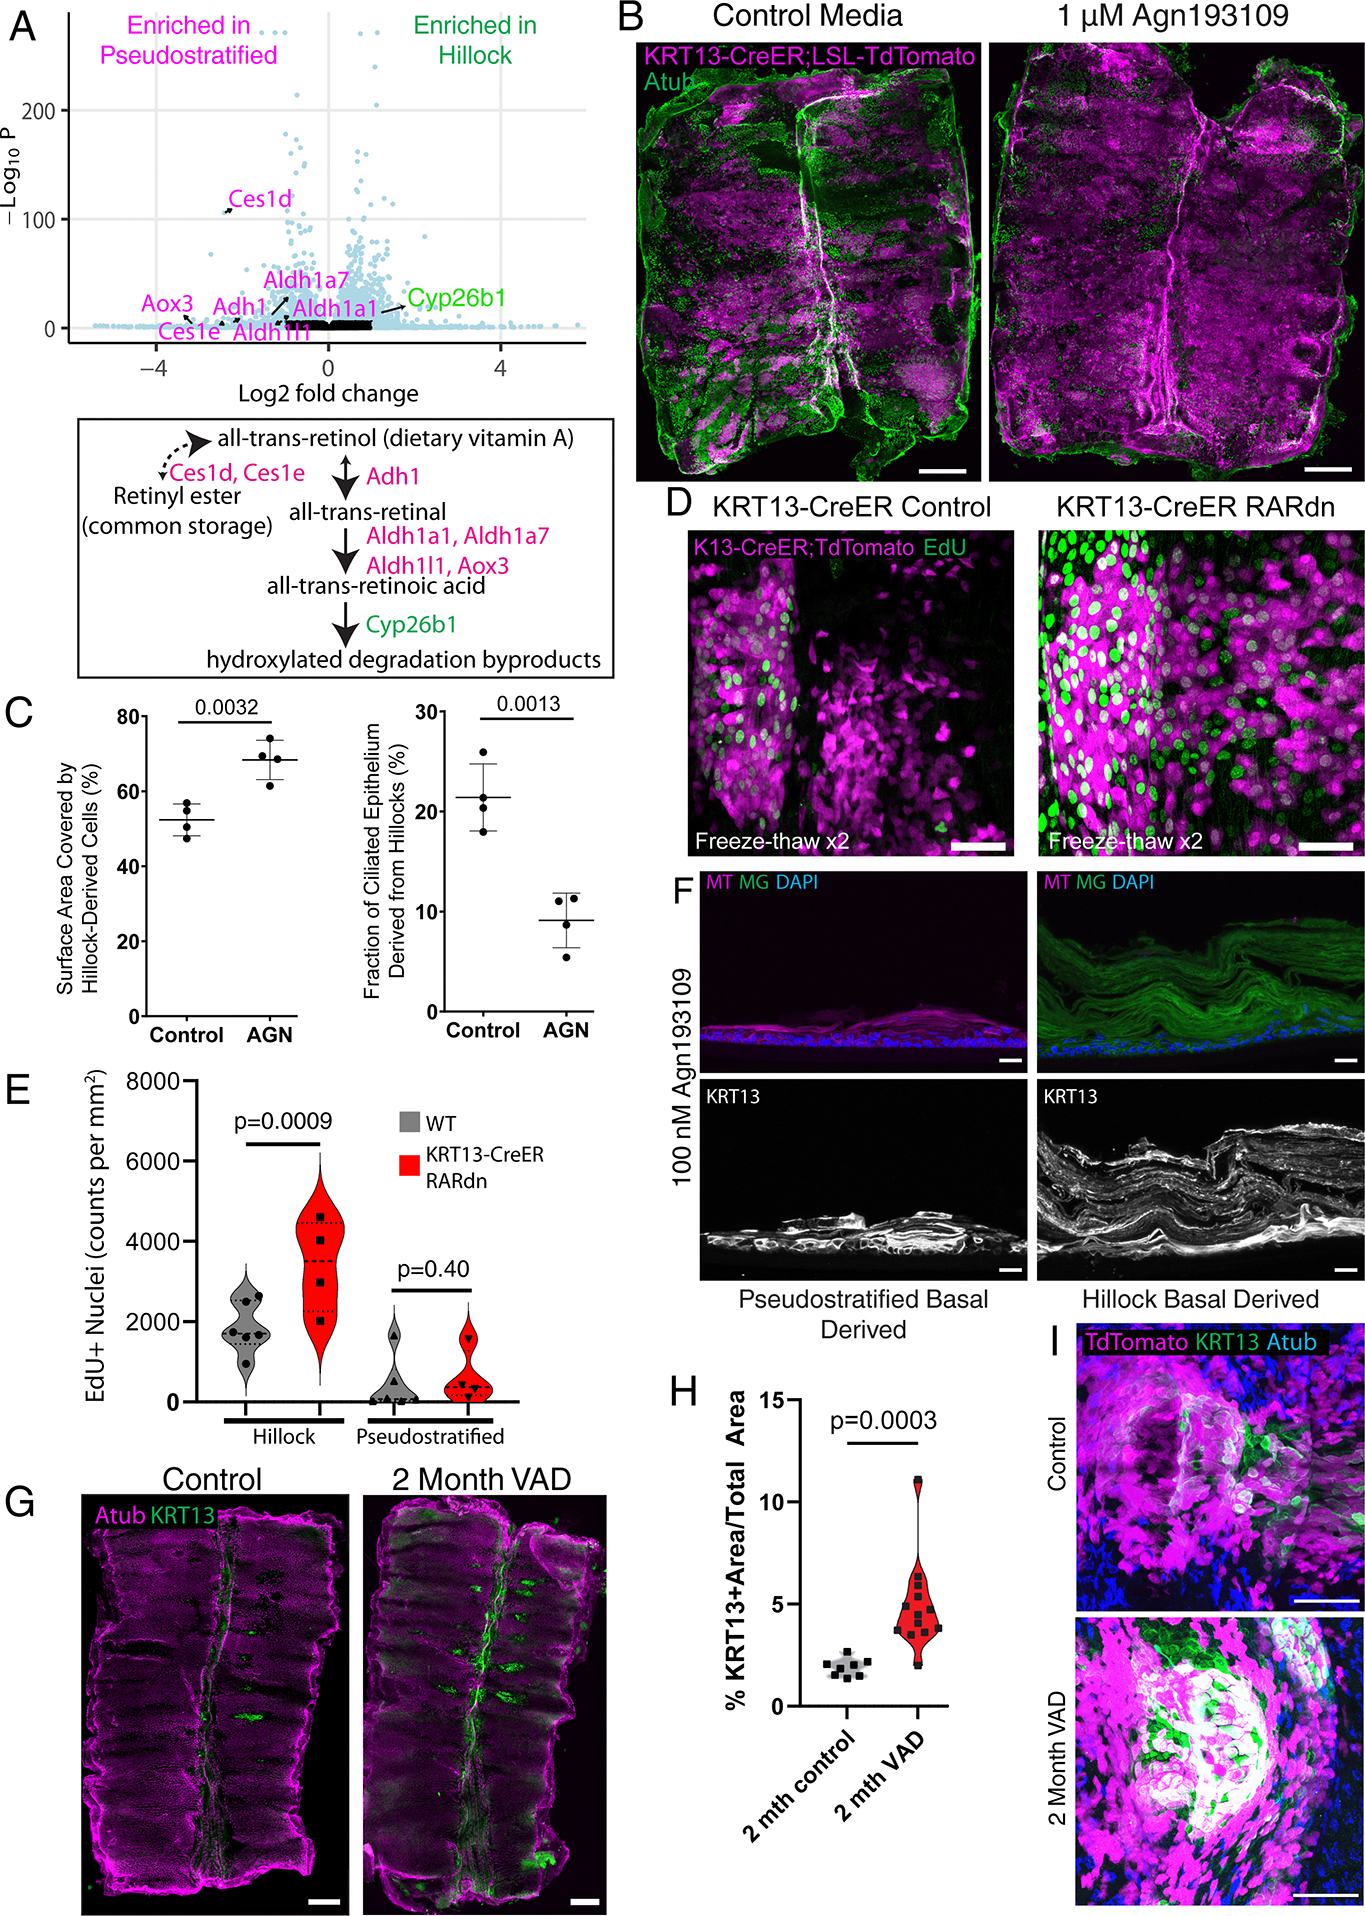
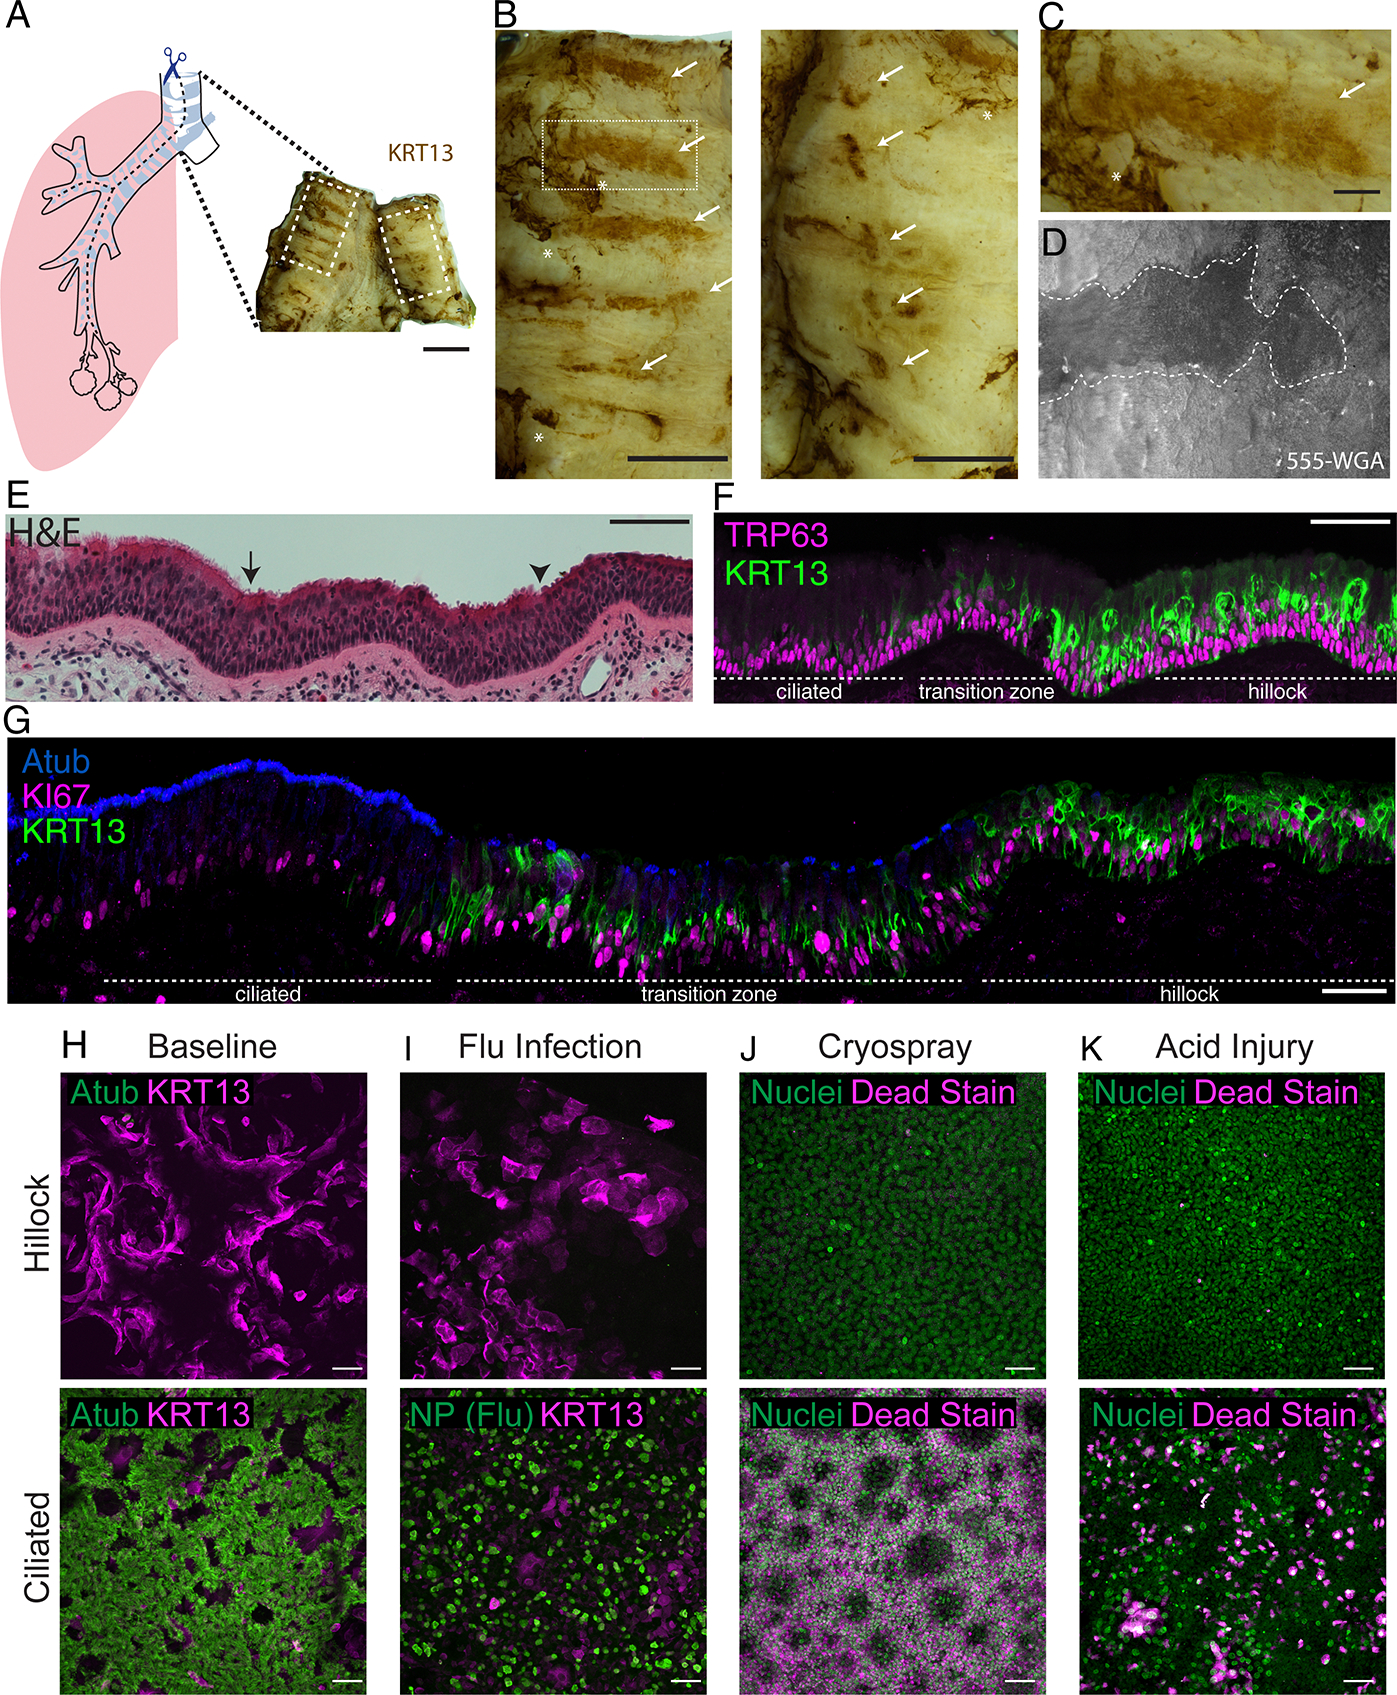
Airway hillocks are stratified epithelial structures of unknown function1. Hillocks persist for months and have a unique population of basal stem cells that express genes associated with barrier function and cell adhesion. Hillock basal stem cells continually replenish overlying squamous barrier cells. They exhibit dramatically higher turnover than the abundant, largely quiescent classic pseudostratified airway epithelium. Hillocks resist a remarkably broad spectrum of injuries, including toxins, infection, acid and physical injury because hillock squamous cells shield underlying hillock basal stem cells from injury. Hillock basal stem cells are capable of massive clonal expansion that is sufficient to resurface denuded airway, and eventually regenerate normal airway epithelium with each of its six component cell types. Hillock basal stem cells preferentially stratify and keratinize in the setting of retinoic acid signalling inhibition, a known cause of squamous metaplasia2,3. Here we show that mouse hillock expansion is the cause of vitamin A deficiency-induced squamous metaplasia. Finally, we identify human hillocks whose basal stem cells generate functional squamous barrier structures in culture. The existence of hillocks reframes our understanding of airway epithelial regeneration. Furthermore, we show that hillocks are one origin of 'squamous metaplasia', which is long thought to be a precursor of lung cancer.


Conflict of interest statement

Competing interests: Authors declare that they have no competing interests.

Figures

Extended Data Fig. 1:
Extended Data Fig. 1:. Phenotypic and molecular characterization of hillocks.
(A) Schematic of wholemount preparation. (B) Representative wholemount images of inbred C57Bl6, CD1, and outbred C57Bl6 mice (primary strain of mice used in this manuscript) showing variability of the characteristic pattern of hillock size and location. (C) Quantification of the percent tracheal surface area covered by hillocks in a variety of murine backgrounds at 10–12 weeks of age. Each dot represents a biologically independent mouse replicate. SD is marked. (D) Quantification of hillock size in 16 week old male and female mice on a mixed inbred background show no significant sex-dependent difference. Each dot represents a single wholemount trachea. (Female: n=6, male: n=5, Shapiro-Wilk normality test p=0.120, equal variance test p=0.774, two-tailed t-test p=0.441). Error bars are SD and mean is shown. (E) Representative transmission electron microscopy panels of the interface of two hillock cells showing interdigitation between the dotted lines. (F) Quantification of rare cells in hillocks (n=3 biologically independent animals). Mean is marked. (G) UMAP representation of single cell RNAseq profiles obtained using the SMART-seq protocol on microdissected regions of trachea. Black dots represent basal cells isolated from pseudostratified epithelium surrounding putative hillocks. Red dots represent cells isolated from microdissected putative hillock patches of tamoxifen induced TRP63-CreER;LSL-TdTomato mice. (H) Unbiased cluster assignment of single cell data, separates hillock luminal cells, hillock basal cells, and pseudostratified basal cells. Cells isolated from microdissected hillock patches are enriched for hillock luminal and basal cells. (I) Violin plots demonstrating that both hillock basal and luminal cell clusters specifically express Krt13, Krt6a, and Dsg3. Basal hillock cells additionally express Trp63 like their pseudostratified counterparts. Hillock luminal cells uniquely express Serpinb2. Basal cells of pseudostratified epithelium express Trp63 but not the hillock cytokeratins. (J) Wholemount immunostaining of DSG3 puncta. (K) Cryosection immunostaining of SERPINB2 and TRP63 within hillocks. Stain replicated on three trachea. Scale bar 20 μm (B), 300 nm (E), 50 μm (J), 10 μm (K)
Extended Data Fig. 2:
Extended Data Fig. 2:. Hillocks are resistant to papain dissociation.
(A) Representative wholemount image of a tamoxifen induced TRP63-CreER;LSL-TdTomato trachea before (left panel) and after papain dissociation (right panels). Arrows point to regions of the trachea that are KRT13+, which are the only regions of the epithelium that have resisted dissociation. (B) Quantification of the percent of TdTomato signal remaining within hillocks vs surrounding pseudostratified epithelium. Each dot represents a single, biologically independent wholemount trachea. SD and mean are marked. (C) Matrix of dissociation conditions and their efficacy in dissociating hillocks into a single cell suspension. Only papain followed sequentially by an enzyme mix effectively dissociates hillocks to yield single cell suspensions. Scale bar 250 μm (A, C)
Extended Data Fig. 3:
Extended Data Fig. 3:. Single-cell sequencing of hillock-optimized dissociated trachea
(A) UMAP representation of single-cell RNA-seq data from 4 trachea dissociated using an optimized enzymatic cocktail. (B) Differential gene expression (DGE) analysis of hillock basal cells compared to all pseudostratified cells. (C) DGE analysis of hillock luminal cells compared to all pseudostratified cells. (D) Direct DGE comparison of hillock basal vs hillock luminal cells. (E) Direct DGE comparison of hillock luminal cells vs secretory cells. In all DGE plots, yellow highlighted genes were identified in the previous SMART-seq based single-cell RNA-seq, and blue highlighted genes are unique adhesion-associated genes found using this new dataset.
Extended Data Fig. 4:
Extended Data Fig. 4:. Generation of a KRT13-CreER driver and demonstration that hillock luminal cells are not secretory cells
(A) Schematic of 2A-CreER cassette knocked into the native KRT13 locus via CRISPR-Cas9. (B) Representative wholemount stains with high-mag insets (below) of KRT13-CreER and KRT6-CreER lineage trace mice 3 days post-tamoxifen induction showing high hillock cell labeling specificity. (C) Representative wholemount stains of control KRT13-CreER and KRT6-CreER lineage trace trachea show no appreciable labeling in the absence of tamoxifen after 3 months. (D) Quantification of efficiency and specificity of the two hillock-specific drivers with either 1 or 2 doses of tamoxifen. (Left) Efficiency was measured using cryosections and manual counting of cells that were labeled using either KRT13-CreER or KRT6-CreER mice. 3 animals for each condition were sectioned, and each dot represents a single section (KRT13 1x dose: n=13, KRT13 2x dose: n=3, KRT6: n=5). (Right) Specificity was measured using confocal Z-slices through the entire airway. Each dot represents a single animal wholemount (KRT13 1x dose: n=4, KRT13 2x dose: n=3, KRT6: n=3) (E) A representative cryosection of a hillock in an unperturbed wildtype animal shows no UEA1+ goblet cells within the hillock. (F) A representative image of a cultured wholemount explant treated with 20 ng/ml of IL13 and dual-SMAD (10uM A8301 and 10uM DMH1) inhibition. Secretory cells outside of the hillock are now UEA1+, while hillocks remain UEA1 negative. (G) Hillock luminal cells sorted on the basis of KRT13-CreER;TdT+ and GSib4- do not dedifferentiate and expand following dual-SMAD inhibition. Experiment replicated on three trachea. SD and mean are shown. Scale bar 250 μm (top of B, C), 50 μm (bottom of B) and F, 10 μm (E)
Extended Data Fig. 5:
Extended Data Fig. 5:. Hillocks harbor a pool of active stem cells that continually generate pseudostratified epithelium during homeostasis.
(A) Clones of basal cells following a 3 month chase using the pan-basal TRP63-CreER driver. Asterisks mark two large clones in the hillock (left). Arrows mark single or two cell clones in pseudostratified ciliated epithelium (right). (B) Representative wholemount images of KRT13-CreER mice 2 days, 1 month, and 3 months after lineage labeling of homeostatic trachea. Boxes represent the insets in main Figure 1H. (C) Representative confocal images of cryosectioned trachea 2 days post-labeling shown in (B), stained for the basal cell marker TRP63 and the hillock marker KRT13. (D) Representative wholemount images of KRT6A-CreER mice 3 months after lineage labeling along with a high-mag image below. (E) Representative cryosections of the 3 month-long chase trachea shown in Figure 1H that was initially stained as a wholemount for basal stem cells (KRT5), secretory cells (CC10), and ciliated cells (Atub). Arrowheads mark lineage traced basal, secretory, and ciliated cells. (F) Quantification of the number of basal, secretory, and ciliated cells that are KRT13-CreER lineage labeled following a 3 month chase. Each dot represents data from a single sagittal section of the trachea counted in its entirety, evenly sampling 3 different animals. SD and mean are marked. (G) Summary schematic of a hillock flanked by sparsely ciliated transition zones and surrounded by pseudostratified epithelium. Scale bars 100 μm (A, bottom of D), 250 μm (B, top of D), 20 μm (C), 10 μm (E)
Extended Data Fig. 6:
Extended Data Fig. 6:. Characterization of naphthalene injury.
(A) Quantification of cell death after 80 mM HCl demonstrates decreased hillock cell death. (B) Quantification of EdU+ nuclei after 80 mM HCl reveals increased hillock cell proliferation. (C) Quantification of cell death after freeze-thaw with less death in the hillock. (D) Quantification of EdU+ replicating cells after freeze-thaw with more replication in the hillock. (E) Quantification of the percent area expressing influenza nuclear protein in pseudostratified vs hillock regions showing hillock resistance to flu infection. Each individual point represents a separate mouse trachea. Unpaired two-tailed t-tests were performed. Error bars represent SD, and mean is shown. Each dot represents an individual biological animal replicate. (F) Naphthalene injury results in variable injury, representative images shown here. (G) Quantification of the correlation of epithelial denudation with percent weight loss. Each dot represents a quantification based on a single wholemount trachea. (H) Experimental schematic for Fig. 2D. (I) Representative wholemount image of a trachea 3 days after naphthalene injury showing survival of KRT5/KRT13 double positive hillock regions. White box in top left demarcates KRT13- glands. (J) Representative image of a hillock region (top) vs gland region (bottom) showing that glands do not express KRT13 after injury. (K) Representative confocal image of a section of the trachea showing KRT13+ Foxj1+ double positive cells. (L) Quantification of the percent total surface area of the trachea that is KRT13+ after naphthalene injury. Each dot represents a biologically independent mouse replicate. SD and mean are marked. Two-tailed unpaired t-tests were performed. Scale bars 250 μm (F,I), 20 μm (J), 10 μm (K)
Extended Data Fig. 7:
Extended Data Fig. 7:. Hillocks regenerate the tissue after naphthalene injury
(A) Representative wholemount images of control trachea subjected to naphthalene injury in the absence of tamoxifen induction show minimal lineage labeling. (B) High-mag images showing lack of leakiness following naphthalene exposure when tamoxifen is not administered despite high levels of KRT13 or KRT6A expression. Exceedingly rare labeled cell is shown as evidence of label detection. (C) Quantification of labeled and unlabeled basal, ciliated, secretory, tuft, neuroendocrine, and ionocyte cells in KRT13-CreER;LSL-TdTomato lineage traced animals after naphthalene. No pairwise comparisons were statistically different from each other (1-way ANOVA). Each dot represents a cryosection quantified in a 20x FOV, spread across three distinct biologically independent replicates. SD and mean are marked. (D) Representative KRT13-CreER ifgMosaic clonal lineage trace wholemounts after naphthalene injury showing large, single-clones contributing to tracheal regeneration. (E) Representative immunostaining of sections taken from clonal KRT13-CreER trachea after naphthalene injury, showing all cell lineages are represented and that clones contain multiple lineages. Scale bars 250 μm (A), 10 μm (B, E), 500 μm (D)
Extended Data Figure 8:
Extended Data Figure 8:. Bulk RNA and ATAC-seq analysis of cultured mouse hillock and pseudostratified basal stem cells.
(A) Gating strategy and representative FACS plot for hillock basal cell vs pseudostratified basal cell sort from murine trachea. Hillock basal cells: EpCAM-APCCy7+, p63GFP+,tdTomato+; pseudostratified basal cells: EpCAM-APCCy7+, p63GFP+, tdTomato-. Percentages of each gate with respect to that panel and of the parent population are shown. Live cells were initially sorted on epithelial marker EpCAM, then p63 and hillock lineage reporter. (B) Analysis of ATAC-seq data showing that cultured hillock basal cells exhibit greater chromatin accessibility throughout the genome (top) and specifically at transcription start sites (middle and bottom). (C) Representative tracks of ATAC reads surrounding the Etv4, Cyp26b1 and Flna gene loci showing increased accessibility in hillock basal cells. (D) Volcano plot of all differentially expressed genes, cultured mouse hillock basal stem cells (right) vs pseudostratified basal stem cells (left). (E) GO analysis of DEGs (C) highlights an enrichment of pathways associated with focal adhesions and cell junctions. (F) Volcano plot of ECM and cell-cell junction genes demonstrates a selective enrichment of integrins and junctional proteins in hillock basal cells (green) vs pseudostratified basal cells (magenta).
Extended Data Fig. 9:
Extended Data Fig. 9:. Hillock basal cells respond to retinoic acid signaling inhibition by generating injury-resistant hillock structures that display features of keratinizing squamous metaplasia.
(A) 10X low mag (left) and 25x high mag (right) image of an air-liquid interface (ALI) epithelial culture derived from KRT13-CreER labeled hillock basal cells and lineage negative pseudostratified basal cells cultured in standard ALI conditions. Arrows mark lineage-labeled ciliated cells. (B) 10X low mag (left) and 25x high mag (right) image of an ALI culture derived from KRT13-CreER labeled hillock basal cells and lineage negative pseudostratified basal cells cultured with Agn193109 showing that hillock-derived epithelium is aciliate while unlabeled pseudostratified basal cells develop ciliated cells. (C) Quantification of area covered by hillock basal cell-derived cells shows that Agn193109 treatment induces significantly higher coverage of the ALI by hillock-lineage traced cells. (D) Optical slice reconstruction (60X) of ALIs seen in (B). Brackets demarcate the thickness of the epithelium. (E) Low magnification image of ALI cultures subjected to 20 minutes of trypsin dissociation condition. (F) Quantification of nuclei remaining after trypsin dissociation shows Agn193109 treated cultures resist dissociation. (G) Microscopy of ALI cultures infected with influenza and stained for influenza nucleoprotein (NP) shows that KRT13+ patches that expand after Agn193109 treatment selectively resist infection. (H) Transepithelial electrical resistance (TEER) measurements of ALI cultures shows significantly higher TEER after Agn193109 treatment. (I) Representative cryosections of purified pseudostratified vs hillock basal cells-derived ALI cultures in standard differentiation media. Scale bars 500 μm (left panels of A and B, E), 100 μm (right panels of A, and B), 20 μm (D, I), 250 μm (G)
Extended Data Fig. 10:
Extended Data Fig. 10:. Human hillocks exist.
(A) Image of an entire airway tree (donor HU76) stained for KRT13 using horseradish peroxidase and DAB substrate demonstrates the presence of KRT13+ patches of epithelium. (B) Images of the airway trees of donor HU72 and HU75 demonstrating aciliate, KRT13+ patches of epithelium marked by brown DAB stain. On HU75, Atub is additionally identified using alkaline phosphatase (red). (C) Insets of the magenta-boxed regions in A and B representing patchy KRT13 expression found outside of the characteristic locations of hillocks which do not possess the characteristic morphology associated with murine hillocks. (D) Section of a prospectively-identified and subsequently microdissected KRT13+ hillock patch demonstrates the characteristic histologic pattern associated with murine hillocks. (E) The same immunofluorescent image shown in Fig. 5G, counterstained with DAPI. Expanded insets in the lower panels highlighting the ciliated, transition, and hillock zones. Arrowheads mark squamous flat cells. (F) Representative cryosection of a normal human ciliated epithelium exhibiting scattered suprabasal KRT13+ cells marked by arrows. (G) TEER of human ALIs derived from ciliated vs hillock basal stem cells, with and without AGN193109 treatment. 1-way ANOVA was performed, followed by Tukey’s multiple comparisons test. (H) Increased TEER in hillock derived cultures. (I-K) Quantification of ALI cultures of hillock and pseudostratified epithelium after (I) influenza infection, (J) cryospray injury, (K) acid injury, demonstrating human hillock injury resistance. Unpaired two-tailed t-tests were performed. Each dot represents a distinct ALI membrane. SD and mean are marked. Scale bars, 1 cm (A,B), 50 μm (D-F)
Fig.1
Fig.1. Hillocks are stratified structures with squamous luminal cells present in the homeostatic airway with dedicated basal stem cells.
(A) KRT13 staining of mouse wholemount trachea and schematic. (B) Immunostaining of a hillock cryosection. Arrows: KRT13 (low) hillock basal cells. Arrowheads:KRT13 (high) luminal cells. (C) Single cell GFP photoactivation of a secretory cell, a hillock cell with basal foot process, and a fully stratified luminal hillock cell. Basement membrane as second harmonic generation (SHG). (D) Scanning electron microscopy of the surface of pseudostratified vs hillock epithelia (top) and transmission electron microscopy of the hillock junction, desmosomes marked by asterisk (bottom). (E) Immunostaining of hillocks and markers for rare ionocyte, tuft, and neuroendocrine cells. (F) Optical projection of TRP63-CreER lineage traces demonstrating rapid turnover of basal cells in hillock within 3 weeks. Replicated on three trachea. Dotted line: hillock region, adjacent pseudostratified epithelium. (G) 3 month chase of hillock basal cell clones. Immunostaining of KRT13 and acetylated tubulin delineate the hillock boundary (top). Arrow:large hillock clone; Arrowhead: single-cell clones found at the edge of the hillock (middle). Quantification of clone sizes from basal cell specific TRP63-CreER driver and hillock specific KRT13-CreER driver (bottom) (n=3 mice each, 125 TRP63 clones in pseudostratified epithelium (magenta), 96 TRP63 clones within hillocks(green), 226 KRT13 clones (black). Unpaired two-tailed t-test (H) KRT13-CreER hillock lineage tracing schema (top). Wholemount of hillocks 2 days, 1 month, and 3 months after labeling, showing persistence of lineage label within hillocks and new pools of circumferentially and laterally localized pseudostratified epithelium. (I) Optical projections at 3 month KRT13-CreER pulse-chase experiment showing hillock-derived cells differentiate into pseudostratified cells. Arrows:labeled secretory cells, arrowheads:labeled ciliated cells, asterisk:labeled basal cells. Scale bars 500 μm (A), 10μm (B, D top panels, F), 5 μm (C, I), 400 nm (D bottom), 100 μm (E), 20 μm (G)
Fig. 2
Fig. 2. Hillocks are resistant to a very broad range of insults.
(A) Wholemount image of a hillock with a dead-cell stain following a 2 min exposure to 80 mM HCl demonstrating hillock resistance to acid (top). Cryosection of 80 mM HCl-treated hillock stained for TUNEL (dead) and KRT13 showing luminal cell death (bottom). (B) Wholemount image of a tracheal explant after exposure to 80mM HCl showing replication occurs preferentially in hillocks (top). Cryosection showing proliferation (EdU staining) in a surviving hillock (bottom). (C) Wholemount image of a hillock with a dead-cell stain following freeze-thaw demonstrating hillock resistance to freezing (top). Cryosection of freeze-thaw injured hillock with TUNEL staining showing preferential luminal cell death (bottom). (D) Wholemount image after 2x freeze-thaw injury showing proliferation (EdU staining) in the hillock (top). Cryosection of freeze-thaw injured hillock with EdU staining showing proliferation in a surviving hillock structure (bottom). (E) Wholemount image (top) and high-mag image (bottom) of influenza nuclear protein (NP) stain showing no appreciable infection in hillock regions. Scale bars 100 μm (top of A-D and bottom of E), 5 μm (bottom of A-D), 250 μm (top of E).
Fig. 3
Fig. 3. Hillocks generate a normal pseudostratified airway epithelium after injury.
(A) 5 day timelapse images of a KRT5-CreER;MTMG tracheal explant following naphthalene injury showing massive hillock expansion and resurfacing. Boxed region indicates location of glands. (B) Wholemount (top) and high-mag (bottom) images of tracheal resurfacing after naphthalene injury demonstrate an expansion of KRT13-positive domains and the subsequent appearance of ciliated cells within these domains. (C) Wholemount image of a trachea from a KRT13-CreER;LSL-TdTomato lineage trace 3 weeks post-naphthalene injury demonstrates widespread contribution of hillock-derived cells to the fully resurfaced and regenerated ciliated epithelium, accompanied by a regression of the KRT13 expression pattern to a characteristic hillock pattern. (D) Wholemount image of KRT6A-CreER;LSL-MTMG lineage trace 3 weeks after severe naphthalene injury that has permanently denuded the distal trachea (bottom of wholemount image in center panel) demonstrates that hillock-derived cells survived even this severe injury and resurfaced the proximal trachea. (E) High-mag representative images showing that KRT6A lineage labeled hillock cells can differentiate into all three rare cell types. (F) Wholemount of TRP63-CreER;dual-ifg-Mosaic trachea 3 weeks after naphthalene demonstrates massive clonal expansion (left). High-mag insets of the regions in dotted white boxes (right). Quantification of the size of clones found after naphthalene injury (average 956 cells, 143 clones across 3 animals). Scale bars 250 μm (A, top panels of B, C, D, left panel of F), 20 μm (bottom panels of B), 10 μm (E), 50 μm (right panels of F)
Fig. 4
Fig. 4. Hillock basal stem cells are distinct from pseudostratified basal stem cells and represent a source of squamous metaplasia.
(A) Volcano plot of differentially expressed genes in cultured hillock basal cells vs cultured pseudostratified basal cells. Magenta-labeled genes are enriched in pseudostratified basal cells, while green-labeled gene is enriched in hillock basal cells (top). Gating in Extended Figure 8. A simplified retinoic acid synthesis pathway with above genes (bottom). (B) Wholemount trachea from KRT13-CreER;lsl-TdTomato mice, tamoxifen labeled in vivo prior to cryospray injury and cultured with and without Agn193109. (C) Quantification of percent surface covered by hillock-derived KRT13-CreER;lsl-TdTomato+ cells (left) and quantification of fraction of ciliated epithelium derived from hillocks (right) showing increased resurfacing and reduced ciliogenesis following Agn193109. SD is marked. (D) Wholemount trachea of hillocks from KRT13-CreER;lsl-TdTomato animal vs from KRT13-CreER;dominant negative RAR (RARdn) animal after freeze-thaw injury. (E) Quantification of EdU+ nuclei within hillocks and in surrounding pseudostratified epithelium demonstrating increased proliferation following RARdn in hillocks. (F) Cryosections of air-liquid interface cultures in the presence of 100 nM Agn193109, grown from either purified pseudostratified basal (membrane-TdTomato) vs hillock basal stem cells (membrane-GFP) isolated from KRT13-CreER;MTMG mice. FACS Gating: hillock basal cells: EpCAM-BV421+, GSIβ4-AF647+, EGFP+, pseudostratified basal cells: EpCAM-BV421+, GSIβ4-AF647+, tdTomato+. (G) Wholemount trachea of C57Bl6 animals on control diet vs vitamin A deficient (VAD) diet for 2 months. (H) Quantification of total area covered by KRT13+ hillocks in control vs VAD animals. (I) Wholemount trachea of a single hillock in KRT13-CreER;lsl-TdTomato mice on control vs VAD for 2 months showing increased hillocks (KRT13, green) are derived from pre-existing hillock cells (TdTomato, magenta). Each dot in this figure represents a biologically independent mouse trachea replicate, unpaired two-tailed t-tests were performed. Scale bars 500 μm (B, G), 50 μm (D,I), 20 μm (F)
Fig. 5
Fig. 5. Human hillocks.
(A) Schematic for human wholemount staining. (B) High-mag images of areas marked by dotted lines in A. Arrows mark hillocks, while asterisks indicate background associated with mucous. (C) Further magnification of a hillock stripe from (B, left panel). (D) 555-WGA live staining of human trachea, dotted white line encircles a WGA low region that was then microdissected for subsequent staining in E-G. (E) H&E staining of the region dissected in (D). Arrow marks the boundary between ciliated and transition zones marked by intermittent ciliation. Arrowhead marks the boundary between the transition zone and hillock. (F) Immunostaining of the same region for KRT13 and TRP63. (G) Immunostaining for Atub, KI67, and KRT13 in the same area demonstrates a hillock epithelium with the cytologic and architectural features of a mouse hillock. (H) Representative air-liquid interface (ALI) cultures generated from either hillock basal stem cells or pseudostratified basal stem cells. (I) ALI culture immunostaining of hillock and pseudostratified epithelium after influenza infection, (J) cryospray injury, and (K) acid injury, demonstrating human hillock injury resistance. Scale bars 1 cm (A), 5 mm (B), 100 μm (C), 50 μm (E-K)

Similar articles

Cited by

References

    1. Montoro DT et al. A revised airway epithelial hierarchy includes CFTR-expressing ionocytes. Nature 560, 319–324 (2018). - PMC - PubMed
    1. Lancillotti F, Darwiche N, Celli G & De Luca LM Retinoid status and the control of keratin expression and adhesion during the histogenesis of squamous metaplasia of tracheal epithelium. Cancer Res. 52, 6144–6152 (1992). - PubMed
    1. Chopra DP Retinoid reversal of squamous metaplasia in organ cultures of tracheas derived from hamsters fed on vitamin A-deficient diet. Eur. J. Cancer Clin. Oncol. 19, 847–857 (1983). - PubMed
    1. Peter M et al. Transgenic mouse models enabling photolabeling of individual neurons in vivo. PLoS One 8, e62132 (2013). - PMC - PubMed
    1. Feldman MB, Wood M, Lapey A & Mou H SMAD Signaling Restricts Mucous Cell Differentiation in Human Airway Epithelium. Am. J. Respir. Cell Mol. Biol. 61, 322–331 (2019). - PMC - PubMed

MeSH terms