. 2024 Jun;630(8015):158-165.
doi: 10.1038/s41586-024-07376-2. Epub 2024 May 1.

Multimodal decoding of human liver regeneration

Affiliations

Multimodal decoding of human liver regeneration

K P Matchett et al. Nature. 2024 Jun.

Abstract

The liver has a unique ability to regenerate1,2; however, in the setting of acute liver failure (ALF), this regenerative capacity is often overwhelmed, leaving emergency liver transplantation as the only curative option3-5. Here, to advance understanding of human liver regeneration, we use paired single-nucleus RNA sequencing combined with spatial profiling of healthy and ALF explant human livers to generate a single-cell, pan-lineage atlas of human liver regeneration. We uncover a novel ANXA2+ migratory hepatocyte subpopulation, which emerges during human liver regeneration, and a corollary subpopulation in a mouse model of acetaminophen (APAP)-induced liver regeneration. Interrogation of necrotic wound closure and hepatocyte proliferation across multiple timepoints following APAP-induced liver injury in mice demonstrates that wound closure precedes hepatocyte proliferation. Four-dimensional intravital imaging of APAP-induced mouse liver injury identifies motile hepatocytes at the edge of the necrotic area, enabling collective migration of the hepatocyte sheet to effect wound closure. Depletion of hepatocyte ANXA2 reduces hepatocyte growth factor-induced human and mouse hepatocyte migration in vitro, and abrogates necrotic wound closure following APAP-induced mouse liver injury. Together, our work dissects unanticipated aspects of liver regeneration, demonstrating an uncoupling of wound closure and hepatocyte proliferation and uncovering a novel migratory hepatocyte subpopulation that mediates wound closure following liver injury. Therapies designed to promote rapid reconstitution of normal hepatic microarchitecture and reparation of the gut-liver barrier may advance new areas of therapeutic discovery in regenerative medicine.


Conflict of interest statement

N.C.H. has received research funding from AbbVie, Pfizer, Gilead, Boehringer-Ingelheim and Galecto, and is an advisor or consultant for AstraZeneca, GSK, MSD, Galecto and Pliant Therapeutics. R.J. is an inventor of OPA (licensed to Mallinckrodt Pharma) and founder of Yaqrit Discovery, Hepyx Limited and Cyberliver. All other authors declare no competing interests.

Figures

Fig. 1
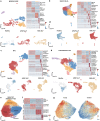
Fig. 1. Deconstructing human liver regeneration.
a, Representative immunofluorescence images of HNF4α (hepatocytes, red), Ki67 (green), CK19 (cholangiocytes, white) and DAPI (nuclear stain, blue) in human healthy and APAP-ALF liver tissue (left). Scale bars, 100 µm. Hepatocyte proliferation in human healthy and diseased explant livers across multiple aetiologies (healthy n = 9, APAP-ALF n = 22, NAE-ALF n = 22, metabolic dysfunction-associated steatotic liver disease (MASLD) n = 10, alcohol-induced liver disease (ALD) n = 9, primary biliary cholangitis (PBC) n = 10 and primary sclerosing cholangitis (PSC) n = 7 (right). One-way ANOVA, F = 11.46, d.f. = 6.82. Data are mean ± s.e.m. PV, portal vein. b, Schematic of the healthy liver lobule (top). APAP poisoning, left untreated, can result in massive, confluent necrosis of hepatocytes in the peri-central vein region of the liver lobule (bottom). PNR, peri-necrotic region; RVR, remnant viable region. c, Schematic of human liver explant tissue processing for snRNA-seq, spatial transcriptomics (ST) and multiplex smFISH (MsmFISH). Part c adapted from ref. , Springer Nature. d, Representative immunofluorescence image of HAL (portal hepatocytes, red), CYP3A4 (central hepatocytes, green) and DAPI (blue) in healthy human liver tissue. n = 3. Scale bar, 100 µm. e, Spatial expression (MsmFISH) of hepatocyte zonation gene modules (Supplementary Table 2) in healthy human liver tissue. n = 2. f, Representative spatial trajectory analysis, identifying differentially expressed gene modules across the healthy human liver lobule. g, Spatial expression (ST) of healthy human liver-derived zonation gene modules in healthy and APAP-ALF liver tissue (left). Distribution of zonation specificity score in healthy and APAP-ALF liver tissue (right). h, Spatial expression (MsmFISH) of known hepatocyte zonation gene modules (Supplementary Table 2) in human APAP-ALF liver tissue. n = 2. i, Representative immunofluorescence image of HAL (portal hepatocytes, red), CYP3A4 (central hepatocytes, green) and DAPI (blue) in human APAP-ALF liver tissue. n = 3. Scale bar, 100 µm. j, Representative spatial trajectory analysis (left) and differential GO terms (Supplementary Table 4) across the human APAP-ALF liver lobule (right). ECM, extracellular matrix; NR, necrotic region. k, UMAP of cell lineage inferred using signatures of known lineage markers (Supplementary Table 2). ILC, innate lymphoid cell.
Fig. 2
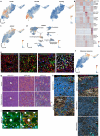
Fig. 2. Migratory hepatocytes in regeneration.
a, UMAP of hepatocyte nuclei from healthy, APAP-ALF and NAE-ALF human liver explants, coloured by cluster. DAH1, disease-associated hepatocytes 1. b, UMAPs (top) and barplots (bottom) displaying relative contribution of healthy, APAP-ALF and NAE-ALF samples across hepatocyte clusters. c, GO terms enriched in human ANXA2+ hepatocytes (Supplementary Table 4). d, MsmFISH showing migratory hepatocytes in the APAP-ALF human liver in relation to other cell lineages. HSC, hepatic stellate cell; MP, mononuclear phagocytes; VSMC, vascular smooth muscle cell. e, Representative immunofluorescence images of ANXA2 (red), HNF4α (hepatocytes, white) and DAPI (nuclear stain, blue) in healthy, APAP-ALF and NAE-ALF human liver tissue (left; scale bars, 50 µm). Yellow arrowheads denote ANXA2+ hepatocytes. Percentage of ANXA2+ hepatocytes in healthy (n = 7), APAP-ALF (n = 22) and NAE-ALF (n = 9) human livers (right). Two-tailed unpaired Student’s t-test: APAP-ALF t = 3.39, d.f. = 27; NAE-ALF t = 2.33, d.f. = 14. Data are mean ± s.e.m. f, Representative immunofluorescence images of ANXA2 (red), HNF4α (hepatocytes, white) and DAPI (blue) in the APAP-ALF human liver (left). Yellow arrowheads denote ANXA2+ hepatocytes. Scale bar, 50 µm. Percentage of ANXA2+ hepatocytes present in the PNR and the RVR of the APAP-ALF human liver (right, n = 9). Two-tailed paired Student’s t-test: t = 3.86, d.f. = 8. Data are mean ± s.e.m. g, Representative immunofluorescence images of ANXA2 (red), HNF4α (hepatocytes, white) and DAPI (blue) in the APAP-ALF human liver (n = 4). Yellow arrowheads denote ANXA2+ hepatocytes with migratory morphology. Scale bars, 20 µm. h, Schematic of the timepoints processed for snRNA-seq post-APAP-induced liver injury in mice. i, UMAP of mouse hepatocyte nuclei from all timepoints post-APAP-induced liver injury, coloured by cluster (left). Application of human migratory hepatocyte gene module to mouse hepatocytes, showing corresponding region enriched in migratory gene signature (right). j, Representative immunofluorescence images of ANXA2 (red), HNF4α (hepatocytes, white) and DAPI (blue) in the mouse liver post-APAP-induced liver injury (left). Yellow arrowheads denote ANXA2+ hepatocytes. Scale bars, 50 µm. Percentage of ANXA2+ hepatocytes across timepoints post-APAP-induced liver injury in the PNR (right). Two-way ANOVA, n = 3 (0 h and 18 h), n = 6 (24–96 h), F = 44.60, d.f. = 8,34. Data are mean ± s.e.m. Source Data
Fig. 3
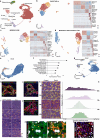
Fig. 3. Wound closure precedes proliferation.
a, Representative haematoxylin and eosin (H+E) staining across select timepoints following APAP-induced mouse liver injury (left). Representative immunofluorescence staining: Ki67 (green), HNF4α (hepatocytes, red) and DAPI (nuclear stain, blue) across select timepoints following APAP-induced liver injury (middle). Yellow arrowheads denote Ki67+ hepatocytes. Scale bars, 50 µm. Quantification of the necrotic area (red) and hepatocyte proliferation (Ki67, green) following APAP-induced liver injury (right). Two-way ANOVA, n = 3 (0–18 h), n = 8 (24–96 h), F = 40.4, d.f. = 12.58. Data are mean ± s.e.m. b, Schematic depicting BrdU dosing of mice post-APAP-induced liver injury. c, Representative immunofluorescence staining (left) and quantification (right) of the percentage of BrdU-negative/glutamine synthetase-positive (GS+) hepatocytes adjacent to the CV: GS (green), BrdU (white) and DAPI (blue). Scale bar, 50 µm. n = 4. Data are mean ± s.e.m. d, Schematic depicting IVM experimental protocol (top) and the IVM setup (bottom). e, Representative IVM images of Cellpose-segmented hepatocytes (top) and binning of hepatocytes into the PNR (green) or the RVR (blue) (right). Scale bars, 40 µm. f, Quantification of cell mobility, mean track length (left; t = 7.52, d.f. = 2), mean displacement length (middle; t = 6.34, d.f. = 2) and mean speed (right; t = 47.20, d.f. = 2) in the PNR (green) and the RVR (blue) of hepatocytes. n = 3 mice. g, Quantification of cell shape changes over time: ellipticity prolate (left; t = 16.79, d.f. = 2), ellipticity oblate (middle; t = 8.21, d.f. = 2) and sphericity (right; t = 4.45, d.f. = 2). s.d., standard deviation. n = 3 mice. In parts f,g, all data are mean ± s.e.m, and two-tailed paired Student’s t-test was used for statistical analysis. Source Data
Fig. 4
Fig. 4. Hepatocyte ANXA2 regulates wound closure.
a, Schematic depicting the experimental protocol for in vivo hepatocyte Anxa2 knockdown and APAP-induced mouse liver injury. b, Representative immunofluorescence staining of the mouse liver from AAV8-shScrmb-treated or AAV8-shAnxa2-treated mice at 48 h post-APAP-induced liver injury (left). ANXA2 (red), HNF4α (hepatocytes, white) and DAPI (nuclear stain, blue) are shown. Yellow arrowheads denote ANXA2+ hepatocytes. Scale bars, 20 µm. Percentage of ANXA2+ hepatocytes post-APAP-induced liver injury in the PNR of AAV8-shScrmb-treated or AAV8-shAnxa2-treated mice (right). Two-way ANOVA, n = 11 (48 h), n = 9 (72 h), F = 20.64, d.f. = 1. Data are mean ± s.e.m. c, Representative H+E staining of mouse livers from AAV8-shScrmb-treated or AAV8-shAnxa2-treated mice across timepoints post-APAP-induced liver injury. Scale bars, 50 µm. d, Quantification of the necrotic area following APAP-induced liver injury in AAV8-shScrmb-treated or AAV8-shAnxa2-treated mice. Two-tailed unpaired Student’s t-test, n = 4 (0 h), n = 8 (24 h), n = 11 (48 h) and n = 8 (72–168 h). Data are mean ± s.e.m. e, Quantification of Ki67+ hepatocytes following APAP-induced liver injury in AAV8-shScrmb-treated or AAV8-shAnxa2-treated mice. Two-tailed unpaired Student’s t-test, n = 4 (0 h), n = 8 (24 h), n = 11 (48 h) and n = 8 (72–168 h). Data are mean ± s.e.m. f, Schematic depicting the temporal disconnect between wound closure and hepatocyte proliferation during APAP-induced liver regeneration. Source Data
Extended Data Fig. 1
Extended Data Fig. 1. Disruption of zonation and annotation of lineages in human acute liver failure.
a, Pearson’s correlation analysis of patient age and hepatocyte proliferation in APAP-ALF (top) and NAE-ALF (bottom). b, Quantification of necrotic area in human healthy (n = 9) and APAP-ALF (n = 22) liver tissue. Two-tailed unpaired Student’s t-test, t = 8.76, df = 30. Data are mean ± SEM. c, Representative immunofluorescence image of HNF4α (hepatocytes, red), Ki67 (green), CK19 (cholangiocytes, white), and DAPI (blue) in human APAP-ALF liver tissue (left). Scale bar 50 µm. Hepatocyte proliferation in the PNR and RVR of human APAP-induced ALF liver tissue (n = 9, right). Two-tailed paired Student’s t-test, t = 6.20, df = 8. Data are mean ± SEM. d, Spatial expression (ST) of hepatocyte, myofibroblast, and cell cycle signatures across healthy and APAP-ALF liver. n = 3 (healthy), n = 2 (APAP-ALF). e, Differential GO terms (Supplementary Table 4) across spatial trajectory analysis from peri-central to peri-portal to peri-central regions in healthy human liver, with exemplar terms labelled (right). f, Spatial expression (MsmFISH) of known human zonation gene modules in healthy and APAP-ALF liver tissue. n = 2 (healthy), n = 2 (APAP-ALF). g, Distribution of zonation specificity score in healthy (n = 2) and APAP-ALF (n = 2) human liver tissue (MsmFISH). h, Quality control metrics (mitochondrial percentage, number of features) across the human snRNA-seq dataset. i, UMAP visualisation of 72,262 nuclei from healthy (n = 9), APAP-ALF (n = 10), and NAE-ALF (n = 12) human liver explants. j, UMAP visualisation of 72,262 nuclei from healthy (n = 9), APAP-ALF (n = 10), and NAE-ALF (n = 12) human liver explants, annotated by clustering. k, Heatmap of marker genes (Supplementary Table 3; colour-coded by cluster) with exemplar genes labelled (right). Columns denote cells, rows denote genes. l, Dotplot annotating clusters by lineage signature expression. Circle size indicates cell fraction expressing signature greater than mean; colour indicates mean signature expression. m, Stacked barplot denoting relative contribution of human liver samples to each cluster. n, Stacked barplot denoting relative contribution of healthy, APAP-ALF, and NAE-ALF samples to each cluster.
Extended Data Fig. 2
Extended Data Fig. 2. Lineage analysis of human liver regeneration atlas.
UMAPs of (a) mesenchyme, (b) endothelia, (c) mononuclear phagocytes, and (d) cholangiocytes derived from human liver single nuclei RNA sequencing, coloured by clustering (top left) and aetiology (bottom); heatmap (right) of marker genes (Supplementary Table 3; colour-coded by cluster) with exemplar genes labelled (right). Columns denote cells, rows denote genes. e, UMAP of healthy human hepatocyte nuclei, coloured by cluster. f, Heatmap of marker genes in healthy hepatocyte clusters (Supplementary Table 3; colour-coded by cluster) with exemplar genes labelled (right). Columns denote cells, rows denote genes. g, Human SPATA-derived portal and central region gene modules (Supplementary Table 2) applied to healthy hepatocytes.
Extended Data Fig. 3
Extended Data Fig. 3. Migratory hepatocytes in human acute liver failure.
a, UMAP of human hepatocyte nuclei, all aetiologies, showing portal, central and cycling gene module (Supplementary Table 2) scores. b, Heatmap of marker genes in hepatocyte clusters (Supplementary Table 3; colour-coded by cluster) with exemplar genes labelled (right). Columns denote cells, rows denote genes. c, UMAP of human hepatocyte nuclei, all aetiologies, showing ANXA2 gene expression. d, UMAP of human nuclei, all aetiologies, showing ANXA2 gene expression. e, Representative immunofluorescence images of leucocytes (CD45, green; scale bar 50 µm), mesenchyme (PDGFRβ, green), endothelia (CD31, green), or cholangiocytes (CK19, green), along ANXA2 (red), HNF4α (hepatocytes, white), and DAPI (nuclear stain, blue) in human APAP-ALF. n = 3. Scale bar 20 µm. f, UMAP of human hepatocyte nuclei, all aetiologies, showing migratory gene module (Supplementary Table 2) signature. g, Spatial expression (MsmFISH) of migratory signature (Supplementary Table 2) and ANXA2 in healthy, APAP-ALF, and NAE-ALF human liver tissue. h, Multiplex smFISH showing cell lineages in healthy (top) and APAP-ALF (bottom) human liver tissue. Gene modules in Supplementary Table 2. i, Spatial expression (MsmFISH) of migratory hepatocytes in healthy and APAP-ALF human liver in relation to other cell lineages. Gene modules in Supplementary Table 2. j, Representative immunofluorescence images of F-actin (green), ANXA2 (red), HNF4α (hepatocytes, white), and DAPI (blue) in human APAP-ALF liver tissue. NR, necrotic region. n = 3. Scale bar 10 µm.
Extended Data Fig. 4
Extended Data Fig. 4. Patient age and sex does not influence human hepatocyte snRNA-seq data.
a, Heatmap showing absolute values of Pearson correlation between age and the harmony components of the human hepatocyte dataset. b, UMAP (top) of human hepatocyte nuclei, all aetiologies, split by sex. Barplot (bottom) displaying relative contribution of female and male to each hepatocyte cluster. c, Heatmap showing absolute values of point-biserial correlation between sex and the harmony components of the human hepatocyte dataset.
Extended Data Fig. 5
Extended Data Fig. 5. Interactome of human ANXA2+ hepatocytes and identification of ANXA2+ hepatocytes in multiple aetiologies of human and mouse liver injury.
a, Circle plot showing the interacting partners of the human migratory hepatocytes (top 20% of interactions). Arrows denote direction from ligand to receptor. Line widths denote scaled interaction strength, dot sizes represent cell number proportions. b, Spatial expression (MsmFISH) in APAP-ALF human liver showing lineage interacting partners from (a) in relation to migratory hepatocytes. Gene modules in Supplementary Table 2. MFB, myofibroblasts (mes1); HSC, hepatic stellate cells (mes2). c, Bubble plots showing TGFβ and BMP ligand-receptor pairs for those interacting partners displayed in (a). Dot colour denotes communication probability, dot size denotes significance. Empty spaces show a communication probability of zero. d, Quantification of necrotic area (left) and hepatocyte proliferation (right), and representative immunofluorescence of transjugular biopsies from patients with acute, severe liver injury (n = 10) liver tissue. Data are mean ± SEM. HNF4α (hepatocytes, red), Ki67 (green), and DAPI (nuclear stain, blue). Scale bar 50 µm. e, Hepatocyte ANXA2 expression in the peri-necrotic region (PNR) and remnant viable region (RVR) of transjugular biopsies from acute, severe liver injury (n = 10, left). Representative immunofluorescence of HNF4α (hepatocytes, white), ANXA2 (red), and DAPI (blue) in transjugular biopsies from acute, severe liver injury (right). Scale bar 20 µm. Two tailed paired Student’s t-test, t = 6.4, df = 9. Data are mean ± SEM. f, Representative immunofluorescence images of ANXA2 (red), HNF4α (hepatocytes, white) and DAPI (blue) in hepatitis A-induced ALF (n = 1), hepatitis B-induced ALF, (n = 5) and drug-induced ALF (n = 2). Yellow arrowheads denote ANXA2+ hepatocytes with migratory phenotype. Scale bar 20 µm. g, Representative immunofluorescence of ANXA2 (red), HNF4α (hepatocytes, white), CK19 (cholangiocytes, green), and DAPI (blue) in MASLD (metabolic dysfunction-associated steatotic liver disease, n = 5), PBC (primary biliary cholangitis, n = 2), PSC (primary sclerosing cholangitis, n = 5), and ALD (alcohol-induced liver disease, n = 2). Scale bar 50 µm. h, Representative immunofluorescence of ANXA2 (red), HNF4α (hepatocytes, white), TROMAIII (cholangiocytes, green), and DAPI (blue) in DDC (3,5-diethoxycarbonyl-1,4-dihydrocollidine) diet-induced (n = 5) and BDL (bile duct ligation) surgical mouse liver injury (n = 3). Scale bar 50 µm. i, Representative immunofluorescence images of ANXA2 (red), HNF4α (hepatocytes, white), and DAPI (blue) in acute (aCCl4, 42hrs post-injection, n = 3) and chronic (chCCl4) carbon tetrachloride (6 weeks, n = 3) injury. Yellow arrowheads denote ANXA2+ hepatocytes. Scale bar 20 µm.
Extended Data Fig. 6
Extended Data Fig. 6. Atlas of mouse APAP-induced acute liver injury.
a, UMAP visualisation of mouse liver nuclei, annotated by lineage inferred using signatures of known lineage markers (Supplementary Table 2). UMAPs of (b) of mouse endothelia, (c) mesenchyme and (d) mononuclear phagocytes derived from mouse liver single nuclei, annotated by clustering (left); heatmap (right) of marker genes (Supplementary Table 3; colour-coded by cluster) with exemplar genes labelled (right). Columns denote cells, rows denote genes. e, UMAP of mouse hepatocyte nuclei, all time points, showing Anxa2 gene expression. f, GO terms enriched in mouse migratory hepatocyte cluster (Supplementary Table 4). g, UMAP of mouse nuclei, all time points, showing Anxa2 gene expression. h, Representative immunofluorescence image of ANXA2 (red), CD45 (leucocytes, green), and DAPI (nuclear marker, blue) at 48hrs post APAP-induced liver injury. n = 6. Scale bar 50 µm. i, Representative immunofluorescence image of ANXA2 (red), PDGFRβ (mesenchyme, green), and DAPI (blue) at 48hrs post APAP-induced liver injury. n = 6. Scale bar 50 µm. j, Representative immunofluorescence image of ANXA2 (red), CD31 (endothelia, green), and DAPI (blue) at 48hrs post APAP-induced liver injury. n = 6. Scale bar 50 µm. k, Spatial expression (ST) in selected timepoints post APAP-induced liver injury (left) of mouse liver-derived zonation gene modules (Supplementary Table 2). Distribution of zonation scores across selected timepoints post APAP-induced liver injury (right). l, Spatial transcriptomic expression of Anxa2 (top) and migratory gene signature (bottom; Supplementary Table 2) in mouse liver post APAP-induced liver injury. m, Representative immunofluorescence images of F-actin (green), ANXA2 (red), HNF4α (hepatocytes, white), and DAPI (blue) at 42hrs post APAP-induced liver injury. NR, necrotic region. n = 3. Scale bar 5 µm. n, Representative immunofluorescence images of ANXA2 (red), HNF4α (hepatocytes, white), and DAPI (blue) in mouse liver at 42hrs post APAP-induced liver injury (left). Yellow arrowheads denote ANXA2+ hepatocytes. n = 6. Scale bar 50 µm.
Extended Data Fig. 7
Extended Data Fig. 7. Characterisation of mouse ANXA2+ hepatocytes and maintenance of epithelial sheet connections and hepatocyte polarity during wound closure.
a, Percentage ANXA2-positive hepatocytes in the peri-necrotic region (PNR) post APAP-induced liver injury in female mouse liver injury. Two-way ANOVA, n = 4 (0 h), n = 8 (24–72 h), df = 45. Data are mean ± SEM. b, Percentage ANXA2+ hepatocytes in male APAP-induced mouse liver injury. PP, peri-portal; RVR, remnant viable region. Two-way ANOVA, n = 6, F = 15.85, df = 2,15. Data are mean ± SEM. c, Percentage ANXA2-positive hepatocytes in female APAP-induced liver injury. Two-way ANOVA, n = 8, df = 7. Data are mean ± SEM. d, Circularity of ANXA2-positive and ANXA2-negative hepatocytes in the PNR post APAP-induced liver injury. Two-way ANOVA, n = 8 (36–42 h), df = 42. Data are centred, mean ± SEM. e, Quantification (left) of ZO-1 expression in the peri-portal and peri-central regions in uninjured mouse liver. Two-tailed paired Student’s t-test, t = 0.73, df = 2. Data are mean ± SEM. Representative immunofluorescence image (right) of ZO-1 (green), HNF4α (hepatocytes, white), and DAPI (nuclear stain, blue) expression in uninjured mouse liver. PV, portal vein, CV, central vein. Scale bar 50 µm. f, Quantification of ZO-1 expression in the PNR post APAP-induced liver injury. n = 8 (24–48 h), df = 28. Data are mean ± SEM. g, Representative immunofluorescence image of ZO-1 (green), ANXA2 (red), HNF4α (hepatocytes, white), and DAPI (blue) expression across select timepoints following APAP-induced liver injury. Yellow arrowheads denote ANXA2+ hepatocytes expressing ZO-1. NR, necrotic region. Scale bar 20 µm. h, Circle plot showing the interacting partners of the mouse migratory hepatocytes (top 20% of interactions). Arrows denote direction from ligand to receptor. Line widths denote scaled interaction strength, dot sizes represent cell number proportions. i, Bubble plot showing TGFβ and BMP ligand-receptor pairs for those interacting partners displayed in (h). Dot colour denotes communication probability, dot size denotes significance. Empty spaces show a communication probability of zero. j, Schematic depicting experimental protocol for lineage tracing of hepatocytes in AAV8.TBG.Cre-activated R26LSLtdTomato mice post APAP-induced liver injury (top). Representative immunofluorescence images of hepatocytes (tdTomato, red), HNF4α (hepatocytes, white), and DAPI (blue) in select timepoints post APAP-induced liver injury (left, scale bar 50 µm). TdTomato+ hepatocytes (HNF4α+) as a percentage of all hepatocytes post APAP-induced liver injury (right). One-way ANOVA, n = 5 (0 h), n = 3 (24 h, 72 h, 168 h), n = 4 (48 h), F = 1.61, df = 4,13. Data are mean ± SEM. k, Representative immunofluorescence images of hepatocytes (tdTomato, red), ANXA2 (green), HNF4α (hepatocytes, white), and DAPI (blue) in AAV8.TBG.Cre-activated R26LSLtdTomato mice 42hrs post APAP-induced liver injury (left). Yellow arrowheads denote ANXA2+TdTomato+ hepatocytes. Scale bar 20 µm. ANXA2+TdTomato+ hepatocytes (HNF4α+) as a percentage of all TdTomato+ hepatocytes at peak (ANXA2+ hepatocyte) timepoints post APAP-induced liver injury (right). n = 3 (36 h, 42 h), n = 4 (48 h). Data are mean ± SEM. l, Visualisation by UMAP (top), diffusion map (DC, bottom left), and force-directed graph (FDG, bottom right) of human hepatocytes and cholangiocytes from healthy, APAP-ALF, and NAE-ALF human liver explants. Source Data
Extended Data Fig. 8
Extended Data Fig. 8. Hepatocytes immediately adjacent to the central vein do not arise from hepatocyte proliferation.
a, Quantification of necrotic area (red) and hepatocyte proliferation (green) following APAP-induced liver injury in female mice. One-way ANOVA, n = 4 (0 h), n = 8, df = 45. Data are mean ± SEM. b, Quantification of hepatocyte proliferation (left) and necrotic area (right) following APAP-induced liver injury in male mice. Two-way ANOVA, n = 3 (0 h), n = (30 h), n = (72 h), n = 4 (336 h), df = 11. Data are mean ± SEM. c, Quantification of percentage BrdU-negative/glutamine synthetase (GS)+ hepatocytes adjacent to the central vein following APAP-induced liver injury in female mice. n = 4 (uninjured), n = 6 (APAP). Data are mean ± SEM. Quantification of necrotic area (d), Ki67+ hepatocytes (e), and ANXA2+ hepatocytes in the PNR (f), following APAP-induced liver injury in IVM and non-IVM (42 h) mice. Two tailed unpaired Student’s t-test, n = 3. Data are mean ± SEM. g, Representative IVM snapshot of APAP-induced liver injury with volume rendering of wound area (left). Scale bar 50 µm. Quantification of change in wound volume at start and end of IVM imaging session (right). Two-tailed paired Student’s t-test, n = 5, t = 6.82, df = 4. Data are mean ± SEM. h, Representative IVM snapshots of motile hepatocytes, white arrowheads marking areas of membrane ruffling/lamellipodia formation. Supplementary Videos 6–14. n = 16, three independent experiments. Scale bar 5 µm. i, Quantification of hepatocyte volume at start and end of IVM, for each mouse. Two-tailed paired Student’s t-test, n = 2 (mouse 1), n = 3 (mouse 2,3) regions per mouse. Data are mean ± SEM. Source Data
Extended Data Fig. 9
Extended Data Fig. 9. Hepatocyte ANXA2 regulates wound closure.
a, ANXA2 gene expression (RT-qPCR analysis) in Huh7 cells treated with Scrmb (control) or ANXA2 siRNA. Data are mean ± SEM, two independent experiments. b, Percent coverage of scratch wound area 72hrs post-wounding in Huh7 cells (human hepatocyte cell line), treated with Scrmb (control) or ANXA2-siRNA. Data are mean ± SEM, two independent experiments. c, Timecourse of Anxa2 gene expression (RT-qPCR analysis) in plated primary mouse hepatocytes. Two-tailed unpaired Student’s t-test, t = 4.62, df = 4, three independent experiments. Data are mean ± SEM. d, Anxa2 gene expression (RT-qPCR) in primary mouse hepatocytes treated with Scrmb (control) or Anxa2 siRNA. Two-tailed unpaired Student’s t-test, t = 45.63, df = 4. Data are mean ± SEM, three independent experiments. e, Percent coverage of scratch wound area 72hrs post-wounding of primary mouse hepatocytes, treated with Scrmb (control) or Anxa2-siRNA. Two-tailed unpaired Student’s t-test, t = 7.04, df = 4, three independent experiments. Data are mean ± SEM. f, Percent EdU+ hepatocytes 72hrs post-wounding of primary mouse hepatocytes, treated with Scrmb (control) or Anxa2-siRNA. Two-tailed unpaired Student’s t-test, t = 1.48, df = 4, three independent experiments. Data are mean ± SEM. g, Met gene expression (RT-qPCR analysis) in primary mouse hepatocytes, treated with Scrmb (control) or Anxa2-siRNA. Two-tailed unpaired Student’s t-test, t = 1.39, df = 4, three independent experiments. Data are mean ± SEM. h, Alanine transaminase (ALT) following APAP-induced liver injury in AAV8-shScrmb or AAV8-shAnxa2 treated mice. Two-tailed unpaired Student’s t-test, n = 4 (0 h), n = 8 (24–168 h). Data are mean ± SEM. i, Representative immunofluorescence images (left) of F-actin (green), HNF4α (hepatocytes, white), and DAPI (nuclear stain, blue) at 48hrs post APAP-induced liver injury in AAV8-shScrmb or AAV8-shAnxa2 treated male mice. CV, central vein. Scale bar 20 µm. Quantification of membrane F-actin+ hepatocytes in the PNR at 48hrs post APAP-induced liver injury in AAV8-shScrmb or AAV8-shAnxa2 treated male mice (right). Two-tailed unpaired Student’s t-test, n = 9 (shScrmb), n = 11 (shAnxa2), t = 29.84, df = 18. Data are mean ± SEM. j, Circularity of hepatocytes in the peri-necrotic region (PNR) at 48hrs following APAP-induced liver injury in AAV8-shScrmb or AAV8-shAnxa2 treated male mice. Two-tailed unpaired Student’s t-test, n = 9 (shScrmb), n = 11 (shAnxa2), t = 3.29, df = 18. Data are mean ± SEM. k, Quantification of ZO-1 expression in the PNR post APAP-induced liver injury in AAV8-shScrmb or AAV8-shAnxa2 treated male mice. Two-tailed unpaired Student’s t-test. n = 8 (24 hr,72 hr), n = 11 (48 hr). Data are mean ± SEM. l, Percentage of bone marrow-derived macrophages (BMDM) that have phagocytosed control (Scrmb) compared to Anxa2-siRNA treated primary mouse hepatocytes. Data are mean ± SEM, two independent experiments. Source Data
Extended Data Fig. 10
Extended Data Fig. 10. AAV8-shRNA-Anxa2 does not affect ANXA2 expression in non-hepatocyte lineages.
a, Representative immunofluorescence images of CD45 (leucocytes, green), ANXA2 (red), and DAPI (blue) in AAV8-shRNA-Scrmb or AAV8-shRNA-Anxa2 treated mice 48hrs post APAP-induced liver injury (left). Scale bar 20 µm. Quantification of CD45+/ANXA2+ cells following APAP-induced liver injury in AAV8-shScrmb or AAV8-shAnxa2 treated mice (right). Two-way ANOVA, n = 4 (0 h), n = 8 (24 h), n = 11 (48 h), n = 8 (72 h). Data are mean ± SEM. b, Representative immunofluorescence staining of PDGFRβ (mesenchyme, green), ANXA2 (red), and DAPI (blue) in AAV8-shRNA-Scrmb or AAV8-shRNA-Anxa2 treated mice 48hrs post APAP-induced liver injury (left). Scale bar 20 µm. Quantification of PDGFRβ+/ANXA2+ cells following APAP-induced liver injury in AAV8-shScrmb or AAV8-shAnxa2 treated mice (right). Two-way ANOVA, n = 4 (0 h), n = 8 (24 h), n = 11 (48 h), n = 8 (72 h). Data are mean ± SEM. c, Representative immunofluorescence staining of CD31 (endothelia, green), ANXA2 (red), and DAPI (blue) in AAV8-shRNA-Scrmb or AAV8-shRNA-Anxa2 treated mice 48 hrs post APAP-induced liver injury (left). Scale bar 20 µm. Quantification of CD31+/ANXA2+ cells following APAP-induced liver injury in AAV8-shScrmb or AAV8-shAnxa2 treated mice (right). Two-way ANOVA, n = 4 (0 h), n = 8 (24 h), n = 11 (48 h), n = 8 (72 h). Data are mean ± SEM. d, Quantification of PDGFRβ+, CD45+,and CD31+ cells/mm2 following APAP-induced liver injury in AAV8-shScrmb or AAV8-shAnxa2 treated mice. Two-way ANOVA, n = 4 (0 h), n = 8 (24 h), n = 11 (48 h), n = 8 (72 h). Data are mean ± SEM. Source Data

References

    1. Michalopoulos GK, Bhushan B. Liver regeneration: biological and pathological mechanisms and implications. Nat. Rev. Gastroenterol. Hepatol. 2021;18:40–55. doi: 10.1038/s41575-020-0342-4. - DOI - PubMed
    1. Bhushan B, Apte U. Liver regeneration after acetaminophen hepatotoxicity: mechanisms and therapeutic opportunities. Am. J. Pathol. 2019;189:719–729. doi: 10.1016/j.ajpath.2018.12.006. - DOI - PMC - PubMed
    1. Stravitz RT, Lee WM. Acute liver failure. Lancet. 2019;394:869–881. doi: 10.1016/S0140-6736(19)31894-X. - DOI - PMC - PubMed
    1. Bernal W, Wendon J. Acute liver failure. N. Engl. J. Med. 2013;369:2525–2534. doi: 10.1056/NEJMra1208937. - DOI - PubMed
    1. Tujios S, Todd Stravitz R, Lee WM. Management of acute liver failure: update 2022. Semin. Liver Dis. 2022;42:362–378. doi: 10.1055/s-0042-1755274. - DOI - PMC - PubMed

MeSH terms