. 2024 May;6(5):963-979.
doi: 10.1038/s42255-023-00959-9. Epub 2024 May 1.

Sexual dimorphism and the multi-omic response to exercise training in rat subcutaneous white adipose tissue

Collaborators, Affiliations

Sexual dimorphism and the multi-omic response to exercise training in rat subcutaneous white adipose tissue

Gina M Many et al. Nat Metab. 2024 May.

Abstract

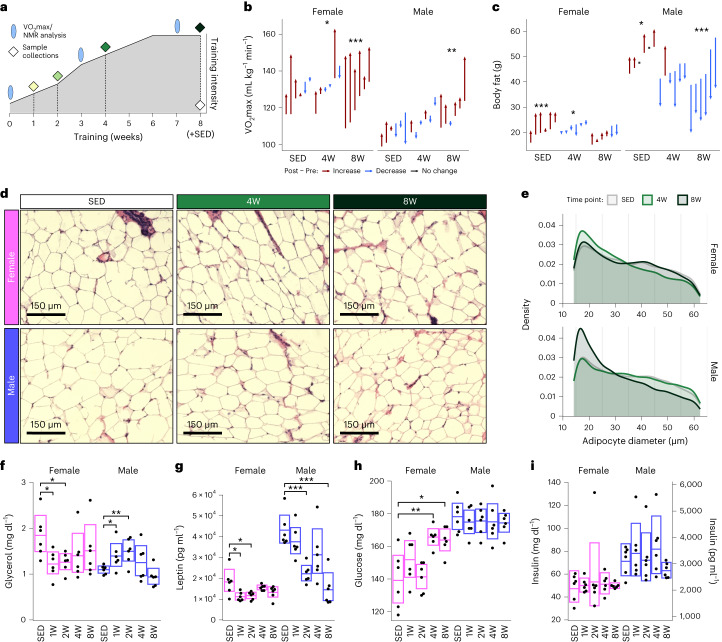
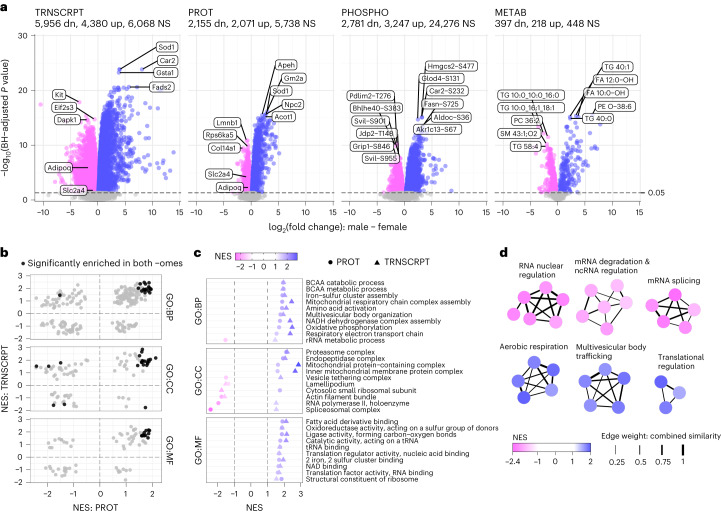
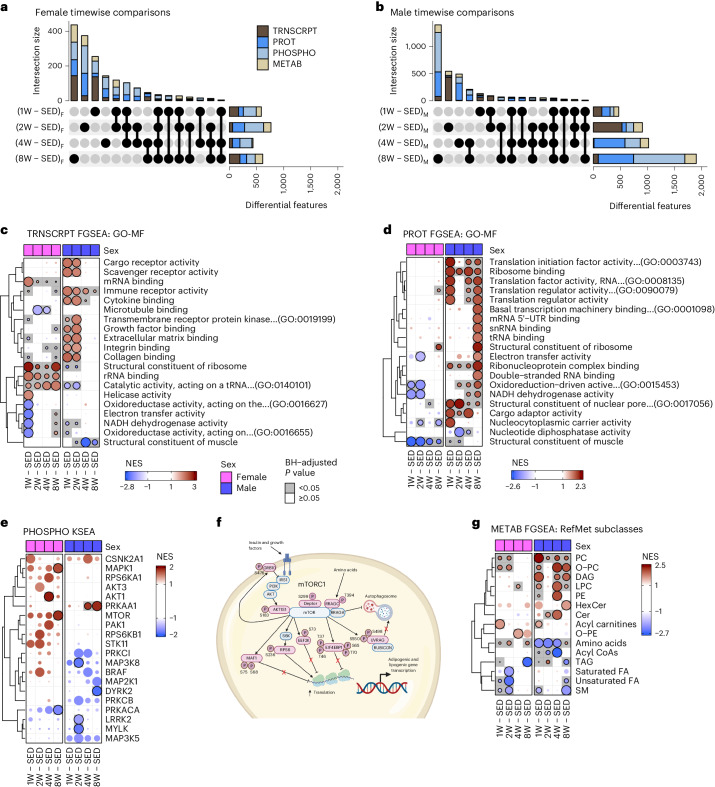
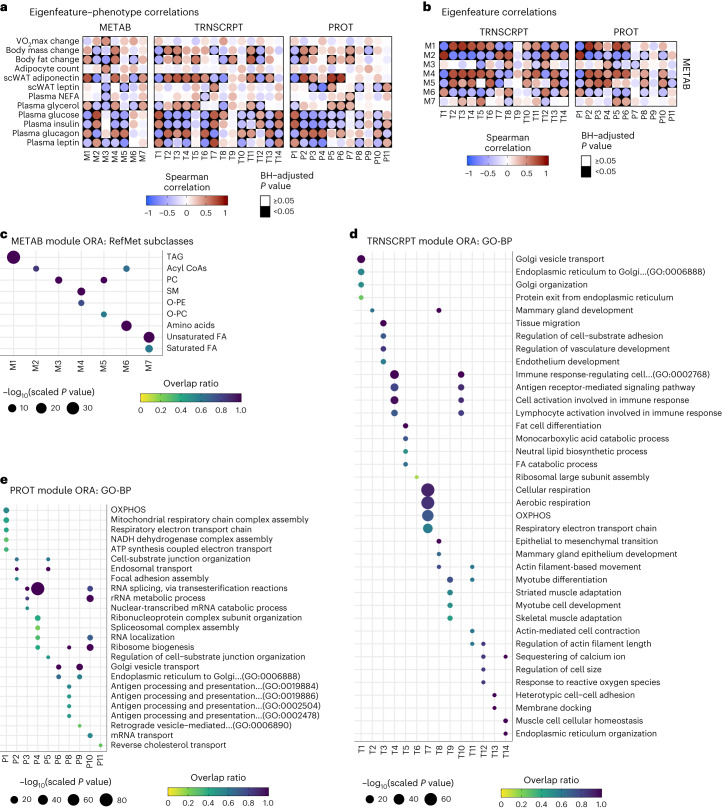
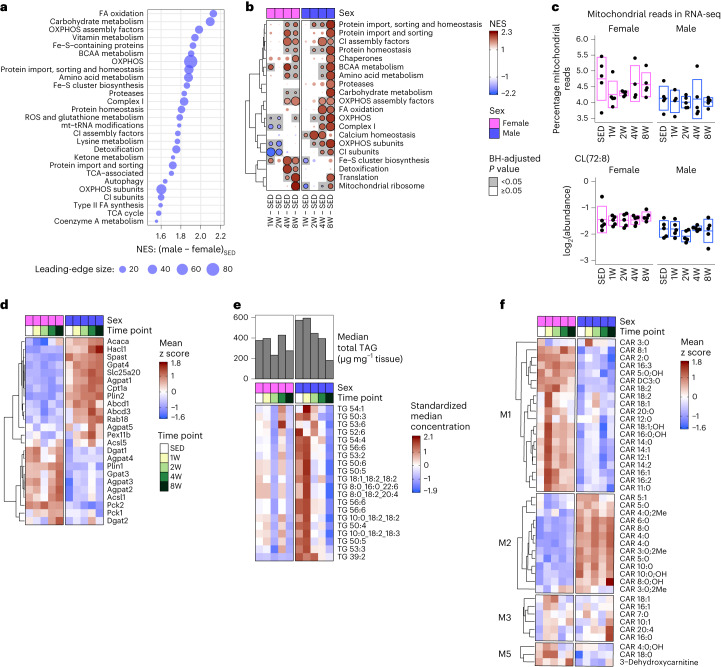
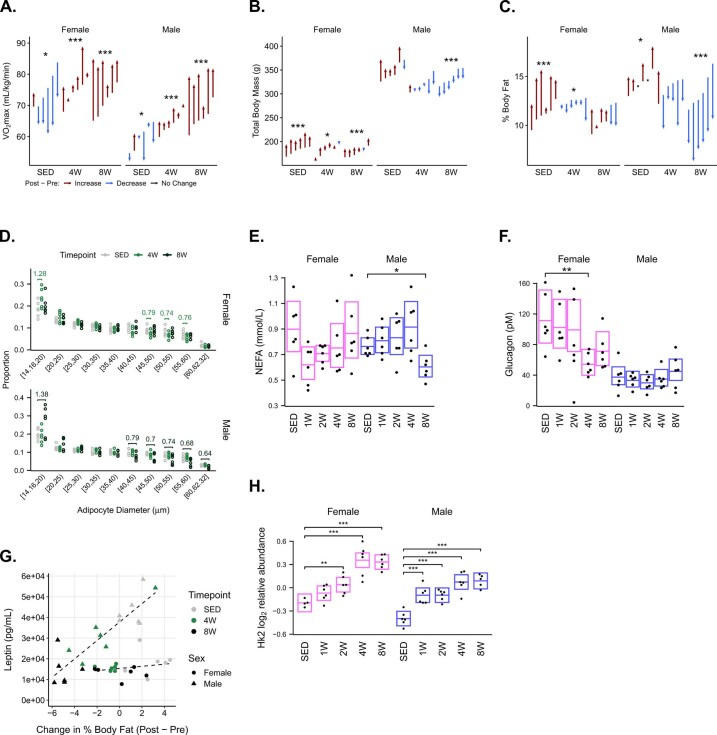
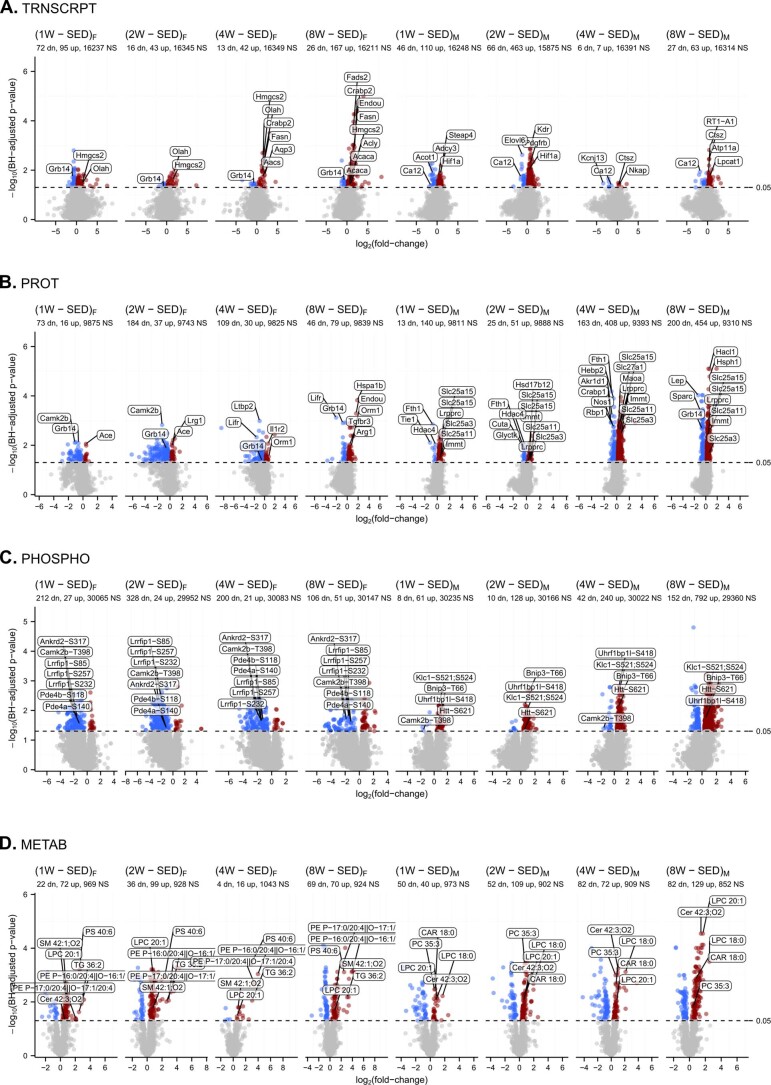
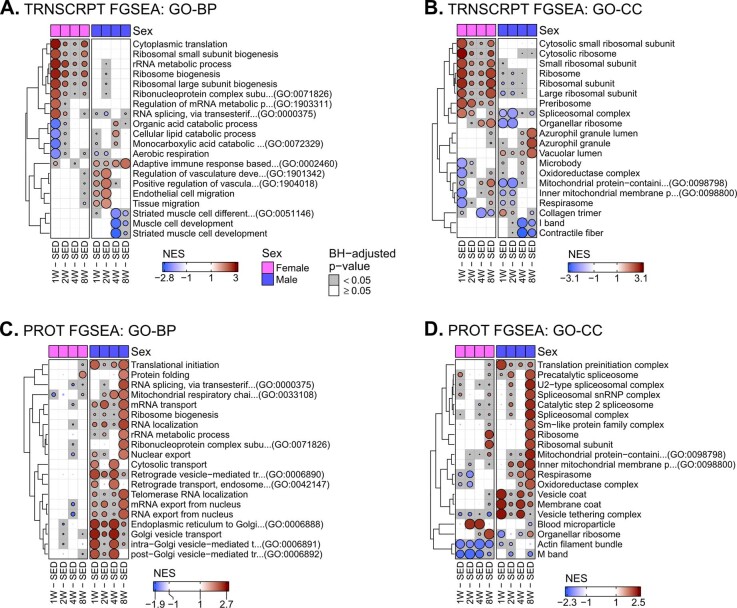
Subcutaneous white adipose tissue (scWAT) is a dynamic storage and secretory organ that regulates systemic homeostasis, yet the impact of endurance exercise training (ExT) and sex on its molecular landscape is not fully established. Utilizing an integrative multi-omics approach, and leveraging data generated by the Molecular Transducers of Physical Activity Consortium (MoTrPAC), we show profound sexual dimorphism in the scWAT of sedentary rats and in the dynamic response of this tissue to ExT. Specifically, the scWAT of sedentary females displays -omic signatures related to insulin signaling and adipogenesis, whereas the scWAT of sedentary males is enriched in terms related to aerobic metabolism. These sex-specific -omic signatures are preserved or amplified with ExT. Integration of multi-omic analyses with phenotypic measures identifies molecular hubs predicted to drive sexually distinct responses to training. Overall, this study underscores the powerful impact of sex on adipose tissue biology and provides a rich resource to investigate the scWAT response to ExT.


Conflict of interest statement

S.C.B. has equity in Emmyon. G.R.C. sits on data and safety monitoring boards for AI Therapeutics, AMO Pharma, AstraZeneca, Avexis Pharmaceuticals, BioLineRx, Brainstorm Cell Therapeutics, Bristol Myers Squibb/Celgene, CSL Behring, Galmed Pharmaceuticals, Green Valley Pharma, Horizon Pharmaceuticals, Immunic, Mapi Pharmaceuticals, Merck, Mitsubishi Tanabe Pharma Holdings, Opko Biologics, Prothena Biosciences, Novartis, Regeneron, Sanofi-Aventis, Reata Pharmaceuticals, NHLBI (Protocol Review Committee), University of Texas Southwestern, University of Pennsylvania, Visioneering Technologies, serves on Consulting or Advisory Boards for Alexion, Antisense Therapeutics, Biogen, Clinical Trial Solutions, Genzyme, Genentech, GW Pharmaceuticals, Immunic, Klein-Buendel Incorporated, Merck/Serono, Novartis, Osmotica Pharmaceuticals, Perception Neurosciences, Protalix Biotherapeutics, Recursion/CereXis Pharmaceuticals, Regeneron, Roche, SAB Biotherapeutics and is the President of Pythagoras, a private consulting company located in Birmingham. S.A.C. is a member of the scientific advisory boards of Kymera, PrognomiQ, PTM BioLabs and Seer. M.P.S. is a cofounder and scientific advisor of Personalis, Qbio, January AI, Filtricine, SensOmics, Protos, Fodsel, Rthm, Marble and is a scientific advisor for Genapsys, Swaz and Jupiter. S.B.M. is a consultant for BioMarin, MyOme and Tenaya Therapeutics. S.S. is a consultant for Terns Pharmaceuticals. All other authors declare no competing interests.

Figures

Fig. 1
Fig. 1. Sexually dimorphic phenotypic responses to endurance training.
a, Diagram of training protocol. F344 male and female rats underwent a progressive treadmill training protocol. Tissues were collected from animals that completed 1, 2, 4 or 8 weeks of training as well as SED. VO2max and NMR body composition analysis was performed as indicated. b, Relative VO2max values (normalized to NMR lean body mass) recorded pre- and post-training from the animals selected for multi-omics analysis in SED, 4W and 8W time points. 4W, 4-week-trained; 8W, 8-week-trained. c, Total fat mass pre- and post-training in SED, 4W and 8W-trained animals, as measured by NMR. Each arrow in b,c represents a different rat and they span from pre- to post-training values. The rats within each group are arranged in ascending order by their pre-training measure. Paired t-tests (n = 6 per group) were performed to test for (post − pre) training differences. d, Representative histological images (20X magnification) of scWAT from sedentary, 4W and 8W female and male rats. e, Adipocyte diameter distributions of histological sections (n = 6 rats per group). Tissue sections from each rat were automatically quantified using CellProfiler, with ten fields captured per section for analyses. Dunnett’s test was used to compare each trained group to their sex-matched sedentary controls. fi, Measurements and Dunnett’s test results for circulating plasma levels of glycerol (f), leptin (g), glucose (h) and insulin (i) from rats selected for multi-omic analysis from each group (n = 6). Boxes show the 95% confidence intervals of the group means. The confidence intervals for insulin are just for consistency; time point was not a significant predictor, so timewise comparisons were not performed. In all plots, asterisks indicate statistical significance (*P < 0.05; **P < 0.01; ***P < 0.001); statistical models and tests are described in detail in the Methods. Source data
Fig. 2
Fig. 2. Sexual dimorphism in the molecular landscape of rat scWAT.
a, Volcano plots displaying the magnitude and significance of changes in transcripts (TRNSCRPT), proteins (PROT), phosphosites (PHOSPHO) and metabolites (METAB) from the differential analysis results comparing male and female SED. Select features are labeled. Blue indicates that a feature was upregulated in males relative to females, pink indicates upregulation in females relative to males and grey indicates no significant change in regulation (BH-adjusted P value ≥ 0.05). dn, downregulated; up, upregulated; NS, not significant. b, Scatter-plots of the normalized enrichment scores (NES) for gene sets that were tested in both proteomics and transcriptomics separated by GO. The black points indicate significant (BH-adjusted P value < 0.05) enrichment in both -omes. c, Scatter-plots of terms that were identified in b as being significantly enriched in both -omes in either males (blue) or females (pink). tRNA, transfer RNA; rRNA, ribosomal RNA. d, Clusters of top significantly enriched GO-BP terms from the proteomics FGSEA comparison of SED male versus female scWAT. Nodes represent individual GO-BP terms and are colored by the NES; thickness of the edges connecting nodes relates to the proportion of genes in common between the gene sets (see ‘Gene Set Network Diagram’ in Supplementary Methods). ncRNA, noncoding RNA.
Fig. 3
Fig. 3. Sex-specific multi-omic scWAT adaptations to ExT.
a,b, UpSet plots of statistically significant (FDR < 0.05) transcripts, proteins, phosphosites and metabolites from each comparison between trained and sex-matched sedentary control female (a) and male (b) rats. c,d, Top MF from the GO database that are most significantly enriched in any of the eight comparisons from the transcriptomics (c) or proteomics (d) FGSEA results. Circles are colored by the NES and scaled by row so that the most significant comparison is of maximum area (‘Fast Gene Set Enrichment Analysis’ Supplementary Methods). UTR, untranslated region. e, Inferred activity of the indicated kinases in each of the trained groups versus sex-matched sedentary controls from KSEA of the phosphoproteomics differential analysis results. f, Schematic of phosphosites (in pink) driving mTOR enrichment in 8W-trained females (diagram created with BioRender.com). g, RefMet chemical subclasses that are significantly enriched in at least one of the eight comparisons according to the metabolomics FGSEA results.
Fig. 4
Fig. 4. Integrative phenotypic–omic responses to ExT.
a, Heat maps of Spearman correlations between MEs and clinical measurements. Change in phenotypic measures represents post − pre differences. b, Heat maps of Spearman correlations between the metabolomics MEs and the MEs of the other -omes. In both a and b, statistical significance was determined by two-sided Student’s t-tests of the transformed correlations and P values were adjusted to control the FDR using the BH procedure. c, All over-represented RefMet chemical subclasses in each metabolomics WGCNA module. d,e, Top over-represented GO-BP terms in each transcriptomics (d) or proteomics (e) WGCNA module.
Fig. 5
Fig. 5. Integrative -omics reveals sexual dimorphism in scWAT mitochondrial metabolism and lipid recycling with ExT.
a, Top significantly enriched (FDR < 0.05) MitoCarta terms from the proteomics sedentary male versus sedentary female FGSEA results. Points are scaled according to the number of genes in the leading-edge subset (the set of genes from each term that contributed to the enrichment score). Terms were only significantly enriched in males relative to females, so all points are colored blue. b, Heat map of the top MitoCarta terms that were most significantly enriched in any of the eight trained versus sedentary control comparisons from the proteomics FGSEA results. c, Percentage of reads from mitochondrial genes calculated from the raw transcriptomics data before any filtering (top) and the log2-transformed sample-level values of cardiolipin CL(72:8) (bottom). Both panels display 5 (or 4, following outlier removal as described in the ‘Differential analysis’ section in the Methods) biologically independent samples (rats) per group with boxes representing the mean ± s.d. d, Proteins involved in lipid metabolism. Values shown are the group means of the standardized sample-level protein values. e, Bar plot of the median total TAG concentration (μg mg−1 tissue) in scWAT samples of male and female rats at each time point. The heat map displays the standardized median concentration (peak area normalized by internal standard) of the top 20 most-abundant TAG species. f, Heat map of acylcarnitine species grouped according to their metabolomics WGCNA module. Values shown are the group means of the standardized sample-level values for each species.
Extended Data Fig. 1
Extended Data Fig. 1. Additional phenotypic data.
a) Relative VO2max values normalized to total body mass from the animals selected for multi-omics analysis. b–c) Body mass and percent body fat measurements of animals selected for multi-omics analysis. Arrows represent rats and span from pre- to post-training values. Within each group, they are arranged in ascending order by their pre-training measure. d) Proportions of adipocytes from histological analysis with diameters in the indicated ranges for both female and male animals after 4 or 8 weeks of training, or sedentary controls. For comparisons between trained and sedentary groups where statistical significance was reached, the ratio between the group means (trained/sedentary) is specified above the appropriate bin. e–f) Additional measures of plasma clinical analytes: non-esterified fatty acids (NEFA) (e) and glucagon (f). g) Correlation between plasma leptin measurements and changes in percent body fat (post vs. pre-training) in each SED, 4 W, and 8 W animal selected for -omics analysis. h) Hexokinase 2 protein measures from the gastrocnemius. For (d–f, h), trained groups were compared to their sex-matched sedentary controls using Dunnett’s test after fitting a multiple regression model with sex, time point, and their interaction as predictors. Where applicable, the boxes are 95% confidence intervals for the mean of each group, and asterisks indicate a statistically significant difference (*, p < 0.05; **, p < 0.01; ***, p < 0.001) between pre- and post-training measures (a–c) or trained and SED groups (d–f, h) after adjustment for multiple comparisons.
Extended Data Fig. 2
Extended Data Fig. 2. Training response differential expression analysis: volcano plots.
a–d) Volcano plots displaying the magnitude and significance of comparisons of each trained group against sex-matched sedentary controls in transcriptomics (a), proteomics (b), phosphoproteomics (c), and metabolomics (d) datasets. Features that are differentially expressed in all female or all male comparisons are labeled and arranged from top to bottom by most to least significant and along the x-axis according to ranked magnitude of log2 fold-change if there was sufficient space. For metabolomics (d) the 5 metabolites that are most significant, on average, across all female or male comparisons are labeled since specific metabolites are not mentioned in the differential analysis results.
Extended Data Fig. 3
Extended Data Fig. 3. Additional FGSEA heatmaps from training response differential expression analysis.
a–b) Top biological process (GO-BP) (a) or cellular component (GO-CC) (b) terms from the Gene Ontology database that are most significantly enriched (FDR < 0.05) in any of the 8 comparisons from transcriptomics FGSEA results. c–d) Top GO-BP (c) or GO-CC (d) terms that are most significantly enriched (FDR < 0.05) in any of the 8 comparisons from proteomics FGSEA results.
Extended Data Fig. 4
Extended Data Fig. 4. Metabolomic Visualizations.
a–c) scWAT metabolome heatmaps displaying acyl-CoAs (a), amino acids (b), and nucleotides (c). Sample-level values were standardized before calculating the mean of each group to better observe patterns.
Extended Data Fig. 5
Extended Data Fig. 5. Comparison of training response across sexes.
a–b) Top molecular function (GO-MF) (a) or cellular component (GO-CC) (b) terms from the Gene Ontology database that are most significantly enriched (FDR < 0.05) in any of the 4 comparisons of the male and female training responses from the transcriptomics FGSEA results. c–d) Top GO-MF (c) or GO-BP (d) terms that are most significantly enriched (FDR < 0.05) in any of the 4 comparisons of the male and female training responses from the proteomics FGSEA results. e) Top kinases that are most significantly enriched (FDR < 0.05) in any of the 4 comparisons of the male and female training responses from the phosphoproteomics KSEA results. f) Top RefMet chemical subclasses that are most significantly enriched (FDR < 0.05) in any of the 4 comparisons of the male and female training responses from the metabolomics FGSEA results.
Extended Data Fig. 6
Extended Data Fig. 6. WGCNA module eigenfeatures.
a–c) Plots of the module eigengenes (MEs) from the metabolomics (a), transcriptomics (b), and proteomics (c) WGCNA results. The size of each module is displayed along with the module labels. Boxes represent 95% confidence intervals for the mean of each group.
Extended Data Fig. 7
Extended Data Fig. 7. Sexual dimorphism in lipid dynamics with ExT.
a) mtDNA 2−ΔΔCT values as measured by real-time qPCR. b–c) Changes in chain length (b) and double bond content (c) of TAG species in male and female rats after 1, 2, 4, and 8 weeks of exercise training. Loess curves are included with 95% confidence bands. The y-axes have been restricted to show patterns more clearly, so not all points are visible. d–e) log2 relative abundances of Acaca and Plin1 proteins (n = 6 per group). Boxes are 95% confidence intervals for the means, and an asterisk indicates a significant (BH-adjusted p-value < 0.05) difference between group means from the proteomics differential analysis results.
Extended Data Fig. 8
Extended Data Fig. 8. Differential analysis model indicators.
a) Multidimensional scaling (MDS) plots where distances between points approximate the typical log2 fold-changes between transcriptomics samples. b) Scatterplot of the average log2 counts per million vs. the square-root of the residual standard deviations from limma::voom. The loess curve (dashed red line) approximates the mean–variance relationship. c–e) MDS plots where distances between points approximate the typical log2 fold-changes between proteomics (c), phosphoproteomics (d), or metabolomics (e) samples. f–g) Average log2 relative abundance vs. the square-root of the residual standard deviations of proteins (f) or phosphosites (g). The dashed red line indicates the robust mean–variance trend from the limma::eBayes step. This is the ggplot2 equivalent of the limma::plotSA output.

Update of

References

    1. Scherer PE. Adipose tissue: from lipid storage compartment to endocrine organ. Diabetes. 2006;55:1537–1545. doi: 10.2337/db06-0263. - DOI - PubMed
    1. Cypess AM. Reassessing human adipose tissue. N. Engl. J. Med. 2022;386:768–779. doi: 10.1056/NEJMra2032804. - DOI - PubMed
    1. Emont MP, et al. A single-cell atlas of human and mouse white adipose tissue. Nature. 2022;603:926–933. doi: 10.1038/s41586-022-04518-2. - DOI - PMC - PubMed
    1. Gonzalez-Gil AM, Elizondo-Montemayor L. The role of exercise in the interplay between myokines, hepatokines, osteokines, adipokines, and modulation of inflammation for energy substrate redistribution and fat mass loss: a review. Nutrients. 2020;12:1899. doi: 10.3390/nu12061899. - DOI - PMC - PubMed
    1. Lange M, et al. AdipoAtlas: a reference lipidome for human white adipose tissue. Cell Rep. Med. 2021;2:100407. doi: 10.1016/j.xcrm.2021.100407. - DOI - PMC - PubMed

Grants and funding