. 2024 May 1;7(1):517.
doi: 10.1038/s42003-024-06214-5.

Forming cognitive maps for abstract spaces: the roles of the human hippocampus and orbitofrontal cortex

Affiliations

Forming cognitive maps for abstract spaces: the roles of the human hippocampus and orbitofrontal cortex

Yidan Qiu et al. Commun Biol. .

Abstract

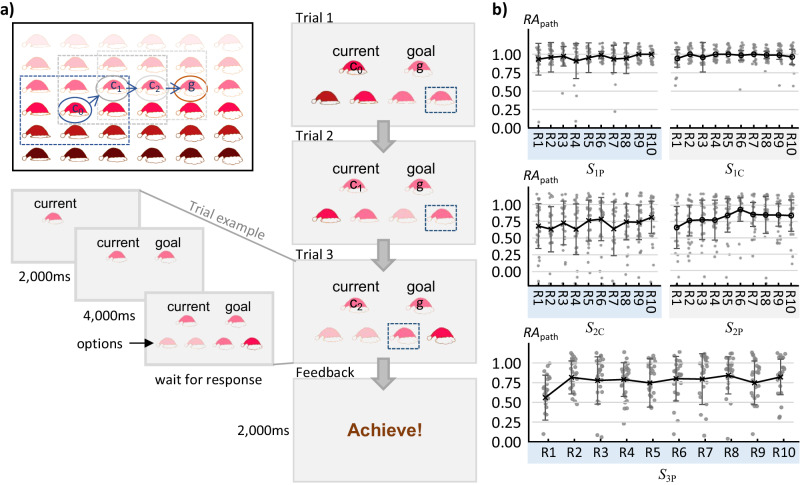
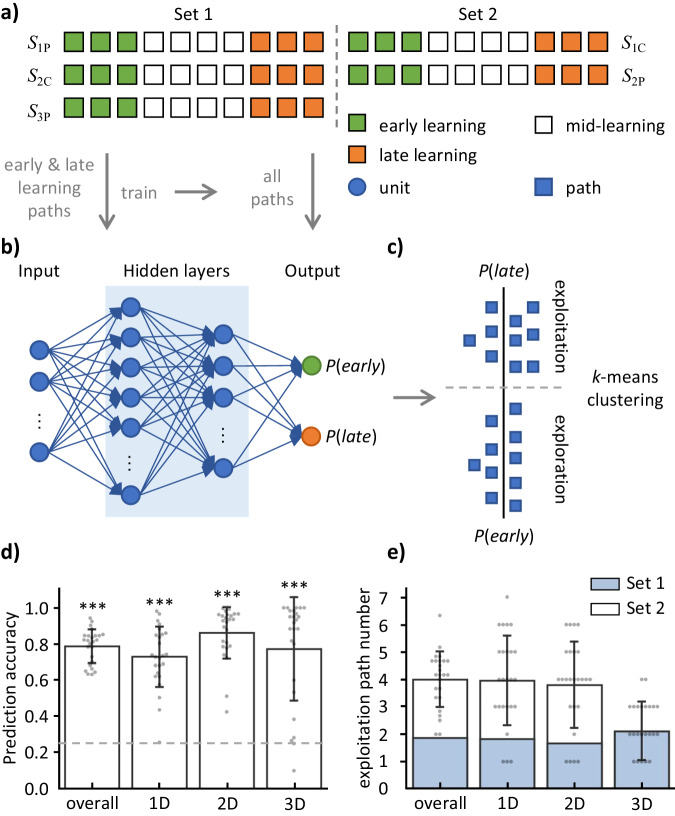
How does the human brain construct cognitive maps for decision-making and inference? Here, we conduct an fMRI study on a navigation task in multidimensional abstract spaces. Using a deep neural network model, we assess learning levels and categorized paths into exploration and exploitation stages. Univariate analyses show higher activation in the bilateral hippocampus and lateral prefrontal cortex during exploration, positively associated with learning level and response accuracy. Conversely, the bilateral orbitofrontal cortex (OFC) and retrosplenial cortex show higher activation during exploitation, negatively associated with learning level and response accuracy. Representational similarity analysis show that the hippocampus, entorhinal cortex, and OFC more accurately represent destinations in exploitation than exploration stages. These findings highlight the collaboration between the medial temporal lobe and prefrontal cortex in learning abstract space structures. The hippocampus may be involved in spatial memory formation and representation, while the OFC integrates sensory information for decision-making in multidimensional abstract spaces.


Conflict of interest statement

The authors declare no competing interests.

Figures

Fig. 1
Fig. 1. Schematic of the construction of the abstract spaces and the fMRI scanning procedure.
a The two basic symbols and their four features (F1, F2, F3, and F4). A certain feature or a dimension consisted of six discrete values. The four features of the hat symbol were tilt angle, brim width, pompom size, and color lightness. The four features of the dog symbol were tail direction, body length, leg length, and color tone. The symbols and features were created by the authors. b Example of the 1D, 2D, and 3D abstract spaces constructed with one feature (1 F), two features (2 F), and three features (3 F) of the hat symbol. In the example, the hat was taken as the primary symbol (denoted as P) to construct three different dimensional abstract spaces, the S1P, S2P, and S3P. The other symbol, dog, was taken as the control symbol (denoted as C) to construct another three abstract spaces, the S1C, S2C, and S3C (the S3C was not used in the fMRI experiment). If the dog was taken as the primary symbol, the S1P, S2P, and S3P would be constructed using the dog symbol, and the S1C, S2C, and S3C would be constructed using the hat symbol. Each abstract space used in the navigation task for a subject was constructed by randomly choosing 1−3 features of a specific symbol. The compasses show the directions that the subjects could take to move in the abstract space during the experiment. The circles and arrows below the compasses are examples of a shortest path from a starting point (blue circle) to a destination (orange circle) in the 1D, 2D, and 3D abstract spaces. Each dot represents a location in the abstract space. More than one shortest path may exist between a certain current and goal locations (Fig. S3, Supplementary Information), so the arrow indicates one of the shortest paths. c The procedure of the experiment. During the fMRI scanning, the subjects performed the navigation task in five different abstract spaces separately in a fixed order of S1P, S2C, S2P, S1C, and S3P. The S1P, S2C, and S3P were collectively referred to as Set 1 because these three were the first space of each dimensionality presented to the subject. The S1C and S2P were collectively referred to as Set 2 because these two were the second space of each dimensionality presented to the subject. Half of the subjects used the hat as the primary symbol, and the other half of the subjects used the dog as the primary symbol. Abbreviations: D, dimension; F, feature; P, primary symbol; C, control symbol; S1P, S1C, S2P, S2C, S3P, and S3C indicate six different multi-dimensional abstract spaces; Set 1 and Set 2 refer to the first and the second space of each dimensionality presented to the subject. rs-fMRI, resting-state fMRI; sMRI, structural magnetic resonance image; HARDI, high angular resolution diffusion-weighted imaging.
Fig. 2
Fig. 2. An example of the navigation task in a 2D abstract space for a subject and the response accuracy of the paths (RApath) in the five abstract spaces.
a Procedure of the navigation task. In each path (from c0 to g), two locations (specific combination of features described in Fig. 1) in the abstract space were chosen randomly as the starting point (also as the first current location) and the destination. The subjects navigated to the destination from the starting point by choosing the given options. With an optimal option, the subject can reach to the destination with the lowest number of steps. In each trial, the options were chosen randomly around the current location (within the dotted frame). For a subject, if the chosen option was not same as the destination, the chosen option became the current location of the next trial and the destination remained the same; otherwise, a feedback screen would indicate the completion of the path. Each trial started with a cue indicating the current location for 2 s, then showed the destination for 4 s, followed by the options, and ended with the subject’s response. b Average response accuracy for each path (RApath) across all the 25 subjects. The error bars indicate standard deviation. The underlying source data is supplied in Supplementary Data 1. Abbreviations: cn, the current location of the nth step; g, goal location; S1P, S1C, S2P, S2C, and S3P represent the five abstract spaces; R1, R2, …, and R10 indicate ten different paths or routes.
Fig. 3
Fig. 3. Schematic and results for the separation of the navigation paths into the exploration and exploitation stages.
a Definition of the early learning (green), mid-learning (white), and late learning (orange). The first three paths and the last three paths of each space were labeled as the early and late learning phases, respectively. These labeled paths were used in training the deep neural network (DNN). b Construction of the DNN prediction model. The DNN contains 2 hidden layers between the input and output layers. The input data were a Nstep-by-2 matrix B=[RA1,RT1;...;RANstep,RTNstep] of a path, where RANstep and RTNstep represent response accuracy and response time of the Nth step, respectively. The values of the two units in the output layer indicate the probability of the path being categorized as early learning phase (denoted as P(early)) and being categorized as late learning phase (denoted as P(late)=1P(early)). The B matrices of all paths were input to the trained DNN to obtain the P(early). c Categorization the navigation paths into the exploration and exploitation stages. A k-means algorithm was used to categorize the paths into the exploration and exploitation stages based on the P(early). d Performance of the DNN prediction model in the 25 subjects. During training, the DNN model predicted the label of the paths in the test set. The accuracy was calculated as the ratio of correctly predicted paths to the total paths in the testing set and averaged across the 100 iterations. The model accuracy value was significantly higher than the chance level (0.25 = 0.5 / ntest). e The number of paths categorized as exploitation stage by the k-means algorithm in each space in the 25 subjects. The error bars indicate standard deviation. The underlying source data is supplied in Supplementary Data 1. ***p < .001.
Fig. 4
Fig. 4. Brain regions associated with learning in abstract spaces.
a Brain regions showing significant differences in activation between the exploration and exploitation stages. Warm (cold) colors stand for the contrast of exploration > exploitation (exploration < exploitation). b Brain regions with the activation associated with response accuracy. Warm (cold) colors stand for a positive (negative) association. The color bar represents the Z-values. c Schematic for the representational similarity analysis (RSA). The lower triangular matrix depicts a theoretical representational dissimilarity matrix (RDM) where each element was the Euclidean distance (d) between goals of different paths. The upper triangular matrix depicts a neural RDM, with each element was the dissimilarity (1 - r) between two paths, where r is the Pearson’s correlation coefficient. The neural RDM was constructed by calculating the dissimilarity of voxel-wise parametric estimations within brain regions between paths. The Spearman’s rank correlation coefficient (ρ) was then computed between the theoretical RDM and the neural RDM. d Brain regions identified through voxel-wise searchlight RSA in the whole-brain. Significant regions indicate improved representation on destinations after learning. The color bar represents the Z-values. The underlying statistical maps are available at https://identifiers.org/neurovault.collection:16948. Abbreviations: HIP hippocampus, EC entorhinal cortex, OFC orbitofrontal cortex, FP frontal pole, ACC anterior cingulate cortex, LOC lateral occipital cortex, TP temporal pole, V1 primary visual cortex.

Similar articles

Cited by

References

    1. Tolman EC. Cognitive maps in rats and men. Psychol. Rev. 1948;55:189–208. doi: 10.1037/h0061626. - DOI - PubMed
    1. Behrens TEJ, et al. What is a cognitive map? Organizing knowledge for flexible behavior. Neuron. 2018;100:490–509. doi: 10.1016/j.neuron.2018.10.002. - DOI - PubMed
    1. Brown TI, Gagnon SA, Wagner AD. Stress disrupts human hippocampal-prefrontal function during prospective spatial navigation and hinders flexible behavior. Curr. Biol. 2020;30:1821–1833.e8. doi: 10.1016/j.cub.2020.03.006. - DOI - PMC - PubMed
    1. Doeller CF, Barry C, Burgess N. Evidence for grid cells in a human memory network. Nature. 2010;463:657–661. doi: 10.1038/nature08704. - DOI - PMC - PubMed
    1. Julian JB, Doeller CF. Remapping and realignment in the human hippocampal formation predict context-dependent spatial behavior. Nat. Neurosci. 2021;24:863–872. doi: 10.1038/s41593-021-00835-3. - DOI - PubMed

Publication types