. 2024 May;56(5):1018-1031.
doi: 10.1038/s41588-024-01737-3. Epub 2024 May 1.

Genomes of multicellular algal sisters to land plants illuminate signaling network evolution

Affiliations

Genomes of multicellular algal sisters to land plants illuminate signaling network evolution

Xuehuan Feng et al. Nat Genet. 2024 May.

Abstract

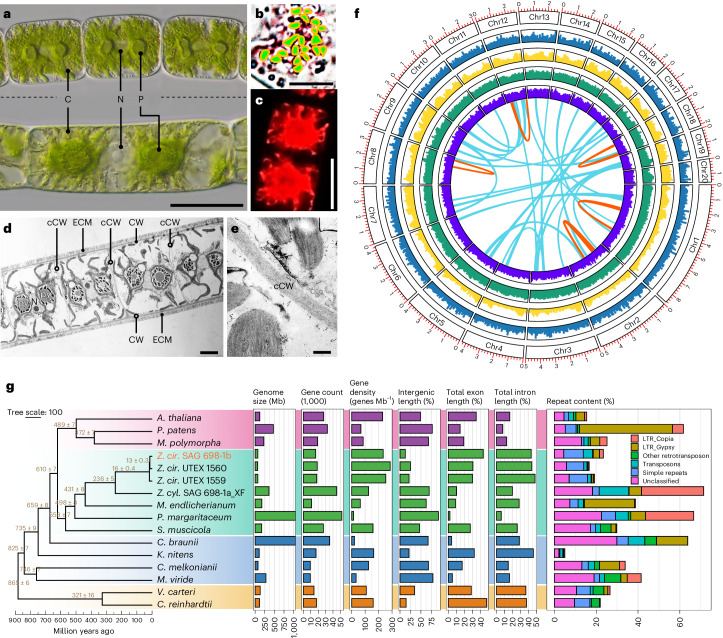
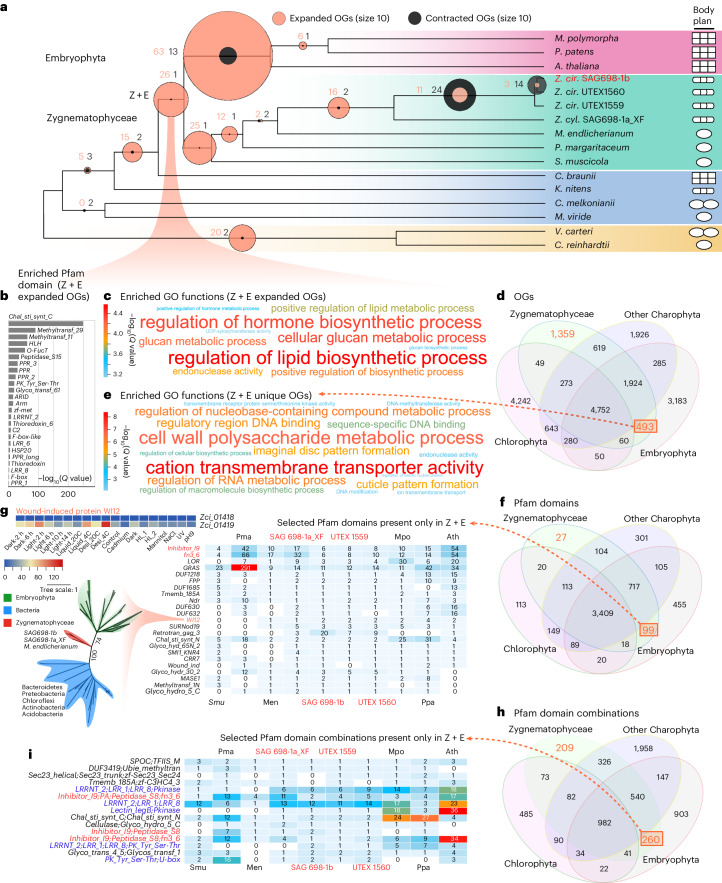
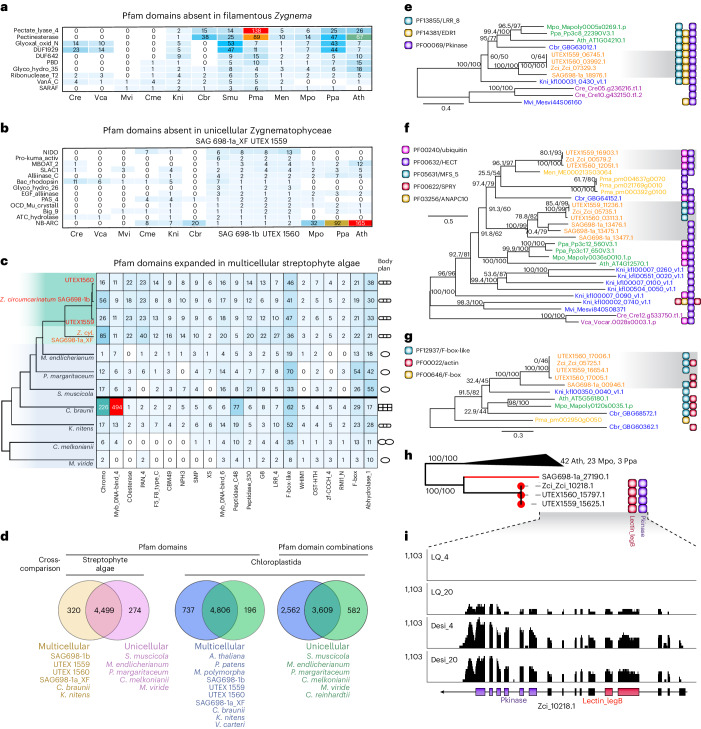
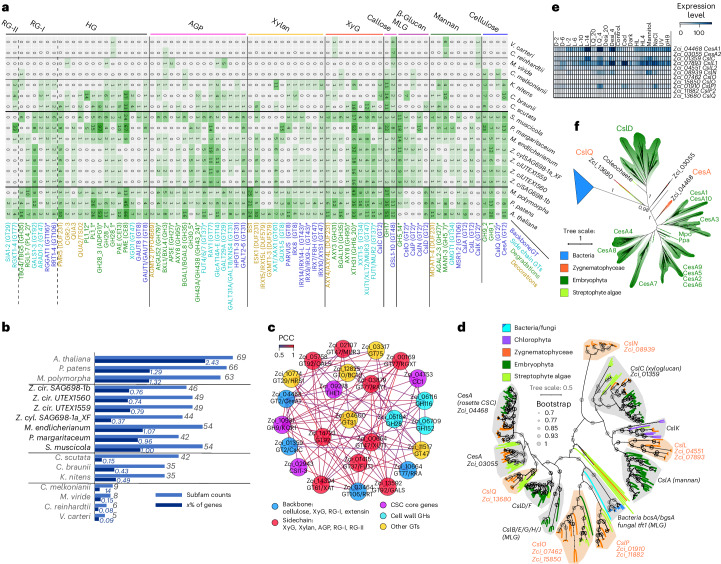
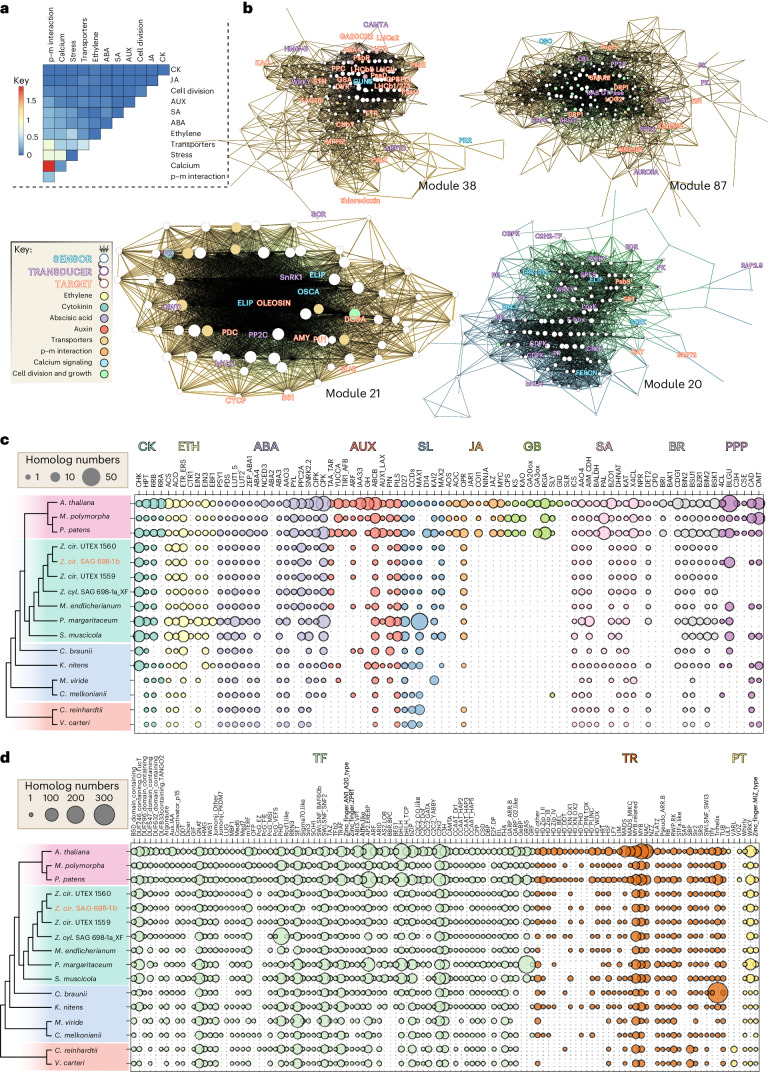
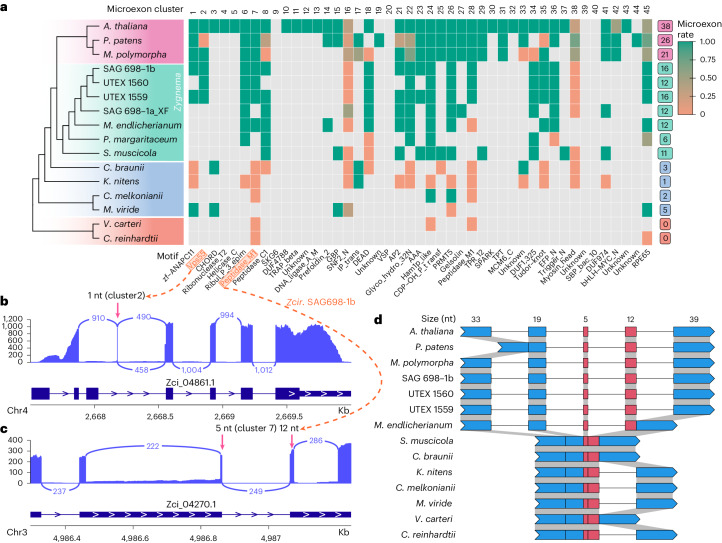
Zygnematophyceae are the algal sisters of land plants. Here we sequenced four genomes of filamentous Zygnematophyceae, including chromosome-scale assemblies for three strains of Zygnema circumcarinatum. We inferred traits in the ancestor of Zygnematophyceae and land plants that might have ushered in the conquest of land by plants: expanded genes for signaling cascades, environmental response, and multicellular growth. Zygnematophyceae and land plants share all the major enzymes for cell wall synthesis and remodifications, and gene gains shaped this toolkit. Co-expression network analyses uncover gene cohorts that unite environmental signaling with multicellular developmental programs. Our data shed light on a molecular chassis that balances environmental response and growth modulation across more than 600 million years of streptophyte evolution.


Conflict of interest statement

The authors declare no competing interests.

Figures

Fig. 1
Fig. 1. Zygnema.
a, Three cells of a vegetative filament of SAG 698-1b (top) compared with one cell of a vegetative filament of SAG 698-1a (bottom, both samples of 1 month old cultures). Scale bar, 20 μm. C, chloroplast; N, nucleus; P, pyrenoid. One-cell filament contains two chloroplasts and one nucleus. b, Chromosome counting on light micrographs of SAG 698-1b fixed and stained with acetocarmine at prophase (0.5 months old); count was also performed in metaphase and telophase (Supplementary Fig. 1). The green dots represent the 20 chromosomes that were counted after rendering a stack of ~100 images. Scale bar, 10 μm. See Supplementary Fig. 1 for the original images. A minimum of ten cells each from three independent cell cultures were analyzed. c, A confocal laser scanning image of one SAG 698-1b cell (0.5 months). Scale bar, 20 μm. d, Transmission electron micrographs illustrating the filamentous nature of Z. circumcarinatum (SAG 698-1b). Left: overview showing that the cells are connected by extremely thin cross cell walls (cCW), while the outer cell wall (CW) is surrounded by a pectinous extracellular matrix (ECM); within the individual cells, pyrenoids (Py) and the nucleus (N) are clearly depictable. Scale bar, 5 µm. e, A detailed view of the cross wall separating two cells where chloroplast lobes are visible. Scale bar, 0.5 µm. Transmission electron micrographs (d and e) derived from the analysis of ≥15 algal filaments each for two independent cell cultures. f, Chromosome-level assembly of the SAG 698-1b genome. Concentric rings show chromosome (Chr) numbers, gene density (blue), repeat density (yellow), RNA-seq mapping density log10(fragments per kilobase of transcript per million mapped reads) (dark green) and guanine-cytosine content density (violet). The red and green links show respectively intra- and interchromosomal syntenic blocks. g, A comparison of genome properties for 13 algal and 3 land plant species. The time-calibrated species tree was built from 493 low-copy genes (all nodes supported by >97% nonparametric bootstrap; numbers at branches are estimated divergence times in million years (mean ± standard deviation) (see Supplementary Table 1f for details). Data for the bar plot can be found in Supplementary Table 1i,j. Source data
Fig. 2
Fig. 2. Comparative genomics of algal and land plant genomes.
a, Gene family expansion and contraction patterns estimated by CAFE using Orthofinder-identified OGs and the time-calibrated phylogeny of Fig. 1g. Key nodes are indicated on the tree and significant expansions and contractions are shown. The circles are proportional to expanded/contracted OGs; the numbers next to the circles indicate the numbers of expanded (orange) and contracted (dark gray) OGs. Z. cir., Zygnema circumcarinatum; Z. cyl., Zygnema cf. cylindricum. Icons indicate body plans: parenchymatous (box of tissue), filamentous (chain of cells), unicellular (single round cell) and sarcinoid/colonial (two round cells). b, Pfam domain enrichment for genes on the node leading to Zygnematophyceae and Embryophyta (Z + E). c, Functional (GO) enrichment for the Z + E node. d, OGs overlap among Chlorophyta, Embryophyta, Zygnematophyceae and other streptophyte algae. e, Enriched GO terms in the 493 OGs exclusive to Zygnematophyceae and Embryophyta. f, Pfam domain overlap among Chlorophyta, Embryophyta, Zygnematophyceae and other streptophyte algae. g, Exclusive Pfam domains found only in Zygnematophyceae and Embryophyta. One Pfam family WI12 was studied with phylogenetic analysis, suggesting a possible HGT from bacteria and expression response to stresses. h, Pfam domain combination overlap among Chlorophyta, Embryophyta, Zygnematophyceae and other streptophyte algae. i, Exclusive Pfam domain combinations in Zygnematophyceae and Embryophyta. Smu, Spirogloea muscicola; Pma, Penium margaritaceum; Men, Mesotaenium endlicherianum; SAG 698-1a_XF, SAG 698-1b, UTEX 1559 and UTEX 1560, the four here sequenced Zygnema spp.; Mpo, Marchantia polymorpha; Ppa, Physcomitrium patens; Ath, Arabidopsis thaliana. Source data
Fig. 3
Fig. 3. Protein domains in unicellular and multicellular species in the green lineage.
a, Selected Pfam domains that are absent in the four filamentous Zygnema genomes. b, Selected Pfam domains that are absent in the three unicellular Zygnematophyceae genomes. c, A heatmap of selected Pfam domains that are significantly expanded in multicellular streptophyte algae; icons indicate body plans. d, Venn diagrams showing shared and exclusive Pfam domains and domain combinations in multicellular versus unicellular species. eg, Phylogenetic trees of selected OGs and the corresponding protein domain architecture for each sequence. Phylogeny of Raf-related kinases bearing a combination of EDR1, LRR_8 and Pkinase domains (e). Phylogeny of HECT domain-containing ubiquitin protein ligases (f). Phylogeny of F-box-like domain-containing actin-related proteins (g). h, Phylogeny of Zci_10218.1, a gene encoding L-type LecRLK with Lectin_legB domain in the N-terminus, Pkinase in the C-terminus and a TM domain in the middle. i, RNA-seq read mapping of Zci_10218.1. LQ, liquid; Desi, dessication; 4 and 20, temperature in Celsius; 1,103, the highest read counts (y axis). Cre, Chlamydomonas reinhardtii; Vca, Volvox carteri; Mvi, Mesostigma viride; Cme, Chlorokybus melkonianii; Kni, Klebsormidium nitens; Cbr, Chara braunii; Smu, Spirogloea muscicola; Pma, Penium margaritaceum; Men, Mesotaenium endlicherianum; SAG 698-1a, SAG 698-1b, UTEX 1559 and UTEX 1560, the four here sequenced Zygnema spp.; Mpo, Marchantia polymorpha; Ppa, Physcomitrium patens; Ath, Arabidopsis thaliana. Source data
Fig. 4
Fig. 4. Cell wall innovations revealed by protein family analyses.
a, A heatmap of homolog presence in 77 enzyme subfamilies (rows) across 17 plant and algal genomes (except for Coleochaete scutata, for which we used its transcriptome). The enzyme subfamilies are grouped by polysaccharide, and the colors indicate their biochemical roles; phylogenetic patterns compatible with gene gains that might have involved HGT are indicated with asterisks. b, Counts of subfamilies and gene percentages (with respect to the total annotated genes) across the 17 species. Shown in the plot is the gene percentage × 100. c, The co-expression network of SAG 698-1b containing 25 genes (most belonging to the 77 analyzed subfamilies) involved in cell wall polysaccharide syntheses. d, The phylogeny of GT2 across the 17 species. Major plant CesA/Csl subfamilies are labeled by the SAG 698-1b homolog, and newly defined subfamilies are in red. Ten bacterial β-glucan synthase (BgsA) and fungal mixed-linkage glucan (MLG) synthase (Tft1) homologs are included to show their relationships with plant CesA/Csl subfamilies. e, Gene expression of 11 SAG 698-1b GT2 genes across 19 experimental conditions (3 replicates each). f, The phylogeny of GT2 with ZcCesA1 (Zci_04468) homologs retrieved by BLASTP against the protein non-redundant (nr) database of the National Center for Biotechnology Information (NCBI) (E-value <1 × 10−10); colors follow d, and >5,000 bacterial homologs from >8 phyla are collapsed (blue triangle). See Supplementary Data 1–13 for details. Z. cir./Z. ci, Zygnema circumcarinatum; Z. cyl., Zygnema cf. cylindricum. Source data
Fig. 5
Fig. 5. Gene co-expression modules and phylogenetic distribution of land plant signature specialized metabolism and TFs.
a, Heatmap of per-module co-occurrence frequencies among genes associated with plant–microbe (p–m) interaction, calcium signaling, stress, transporters, cell division and diverse phytohormones (see abbreviations below); based on 150 out of 406 total gene co-expression modules showing co-occurrence of at least two functional categories. b, Modules 20, 21, 38 and 87 discussed in the main text; node (gene) sizes are proportional to number of neighbors and edge (co-expression) widths are proportional to Pearson’s correlation coefficient whereas colors are those of interconnected genes; egde gradient colors highlight the two dominant gene categories as indicated in the key. Font colors indicate genes’ likely roles in establishing a flow of information. The full gene co-expression results can be accessed in our online portal (https://zygnema.sbs.ntu.edu.sg/). The gene names are based on homology and the proteins they likely encode. c, The phylogenetic distribution of genes coding for proteins involved in phytohormone biosynthesis, signaling and phenylpropanoid biosynthesis. d, The phylogenetic distribution of genes coding for TFs. CK, cytokinin; ETH, ethylene; AUX, auxin; SL, strigolactone; JA, jasmonic acid; GB, gibberellic acid; SA, salicylic acid; BR, brassinosteroids; PPP, phenylpropanoid; TR, transcriptional regulators; PT, putative transcription-associated proteins. Note that the high number of homologs found in Penium margaritaceum are probably due to the large genome of 3.6 Gb and >50,000 annotated proteins. Z. cir., Zygnema circumcarinatum; Z. cyl., Zygnema cf. cylindricum. Source data
Fig. 6
Fig. 6. Microexon prediction in 16 plant and algae genomes.
a, Heatmap of 45 conserved microexon-tags predicted by MEPmodeler. Microexon rate is the rate of true microexons among all predicted results in the cluster. For example, green cells indicate that 100% microexons with two flanking introns are present, orange indicates all microexon sequences are parts of large exons and none of them could be considered as microexons, and the others are between 0 and 1. A gray cell indicates missing data (a microexon-tag could not be found). The numbers on the right column indicate the predicted clusters containing at least one true microexon (see ref. for more detail). b, RNA-seq evidence of the 1 bp microexon in cluster 2 (x axis the genomic location, and y axis the read count). c, RNA-seq evidence of two adjacent microexons, 5 (cluster 7) and 12 bp (cluster 28). In b and c, the RNA-seq of condition p881sControl2 was used; RNA-seq read depth (blue numbers) and gene annotation are shown; blue arcs indicate introns (exon–exon junctions), and the numbers indicate the junction read counts supporting the introns. The pink arrows point to microexons. d, Exon–intron structures of microexon-tag clusters 7 and 28 in 14 plant genomes. The structure was predicted by relaxing the stringency in M. viride genome and by doing TBLASTX search in S. muscicola genome (all three copies are intronless in this microexon-tag), respectively. The others are predicted with default parameters. Source data

Update of

  • Chromosome-level genomes of multicellular algal sisters to land plants illuminate signaling network evolution.
    Feng X, Zheng J, Irisarri I, Yu H, Zheng B, Ali Z, de Vries S, Keller J, Fürst-Jansen JMR, Dadras A, Zegers JMS, Rieseberg TP, Ashok AD, Darienko T, Bierenbroodspot MJ, Gramzow L, Petroll R, Haas FB, Fernandez-Pozo N, Nousias O, Li T, Fitzek E, Grayburn WS, Rittmeier N, Permann C, Rümpler F, Archibald JM, Theißen G, Mower JP, Lorenz M, Buschmann H, von Schwartzenberg K, Boston L, Hayes RD, Daum C, Barry K, Grigoriev IV, Wang X, Li FW, Rensing SA, Ari JB, Keren N, Mosquna A, Holzinger A, Delaux PM, Zhang C, Huang J, Mutwil M, de Vries J, Yin Y. Feng X, et al. bioRxiv [Preprint]. 2023 Feb 1:2023.01.31.526407. doi: 10.1101/2023.01.31.526407. bioRxiv. 2023. Update in: Nat Genet. 2024 May;56(5):1018-1031. doi: 10.1038/s41588-024-01737-3. PMID: 36778228 Free PMC article. Updated. Preprint.

Comment in

  • Two steps beyond.
    Tena G. Tena G. Nat Plants. 2024 May;10(5):695. doi: 10.1038/s41477-024-01719-7. Nat Plants. 2024. PMID: 38773272 No abstract available.

References

    1. Delwiche CF, Cooper ED. The evolutionary origin of a terrestrial flora. Curr. Biol. 2015;25:R899–R910. doi: 10.1016/j.cub.2015.08.029. - DOI - PubMed
    1. Wickett NJ, et al. Phylotranscriptomic analysis of the origin and early diversification of land plants. Proc. Natl Acad. Sci. USA. 2014;111:E4859–E4868. doi: 10.1073/pnas.1323926111. - DOI - PMC - PubMed
    1. Puttick MN, et al. The interrelationships of land plants and the nature of the ancestral embryophyte. Curr. Biol. 2018;28:733–745. e732. doi: 10.1016/j.cub.2018.01.063. - DOI - PubMed
    1. One Thousand Plant Transcriptomics Initiative. One thousand plant transcriptomes and the phylogenomics of green plants. Nature574, 679–685 (2019). - PMC - PubMed
    1. Guiry MD. AlgaeBase: a global database for algae. Curr. Sci. 2021;121:10–11.

Grants and funding