. 2024 May;629(8010):174-183.
doi: 10.1038/s41586-023-06877-w. Epub 2024 May 1.

Temporal dynamics of the multi-omic response to endurance exercise training

Collaborators

Temporal dynamics of the multi-omic response to endurance exercise training

MoTrPAC Study Group et al. Nature. 2024 May.

Abstract

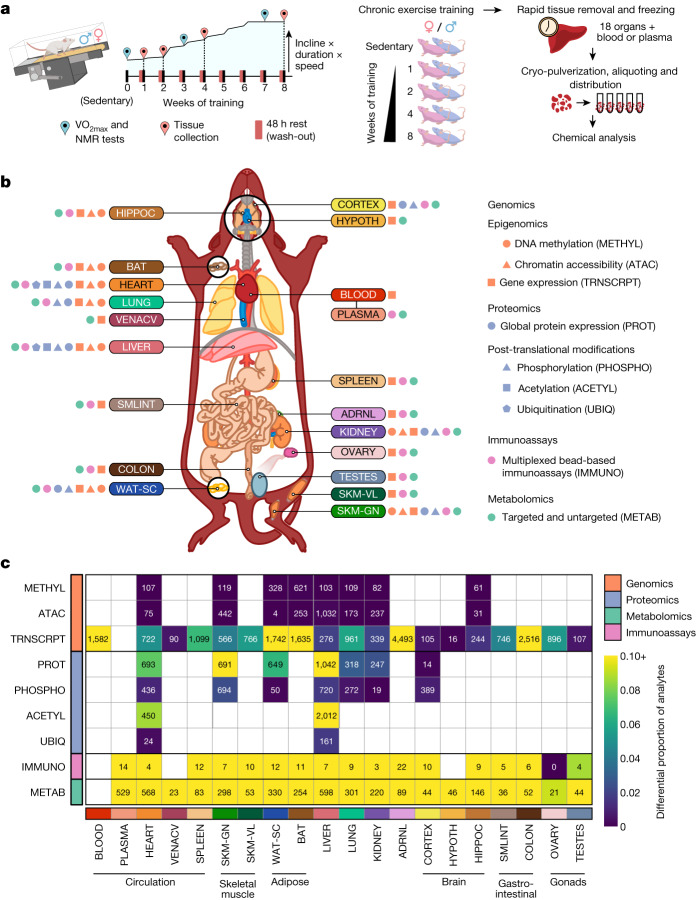
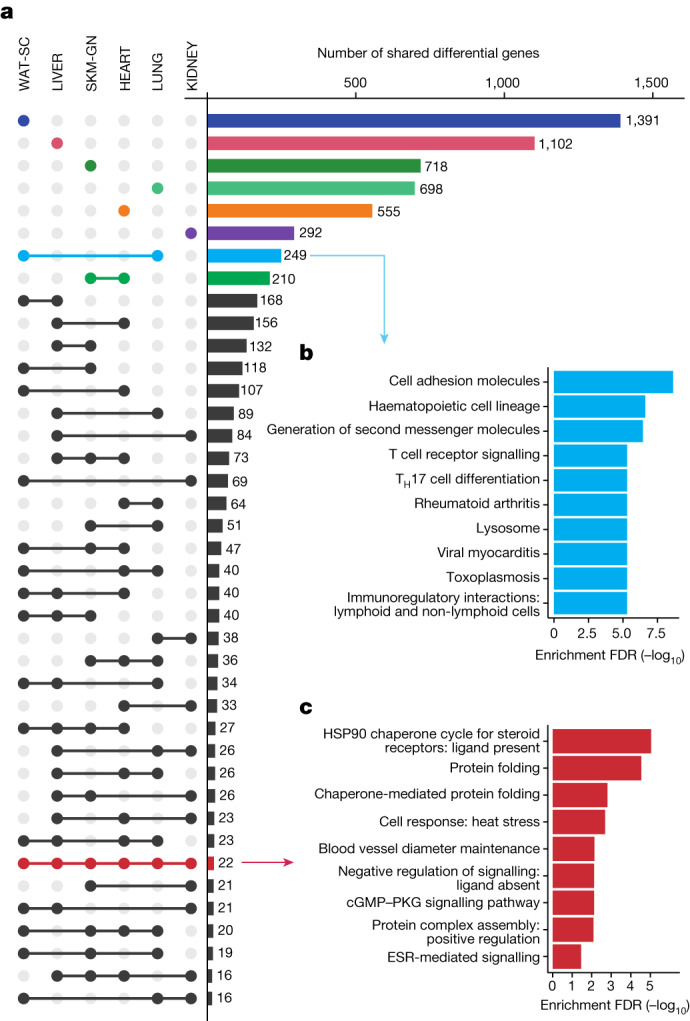
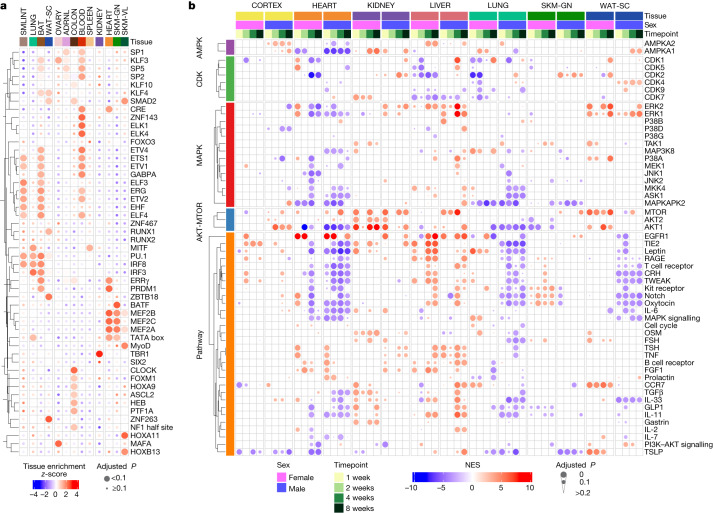
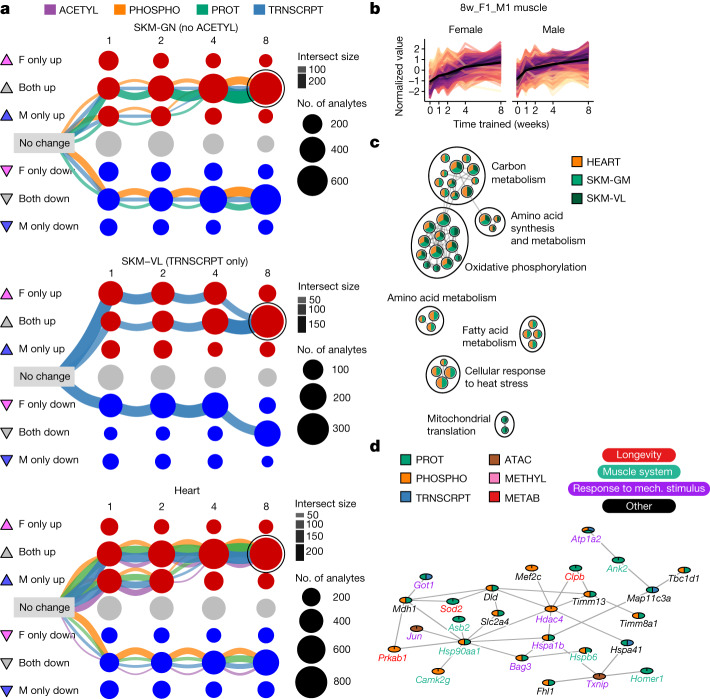
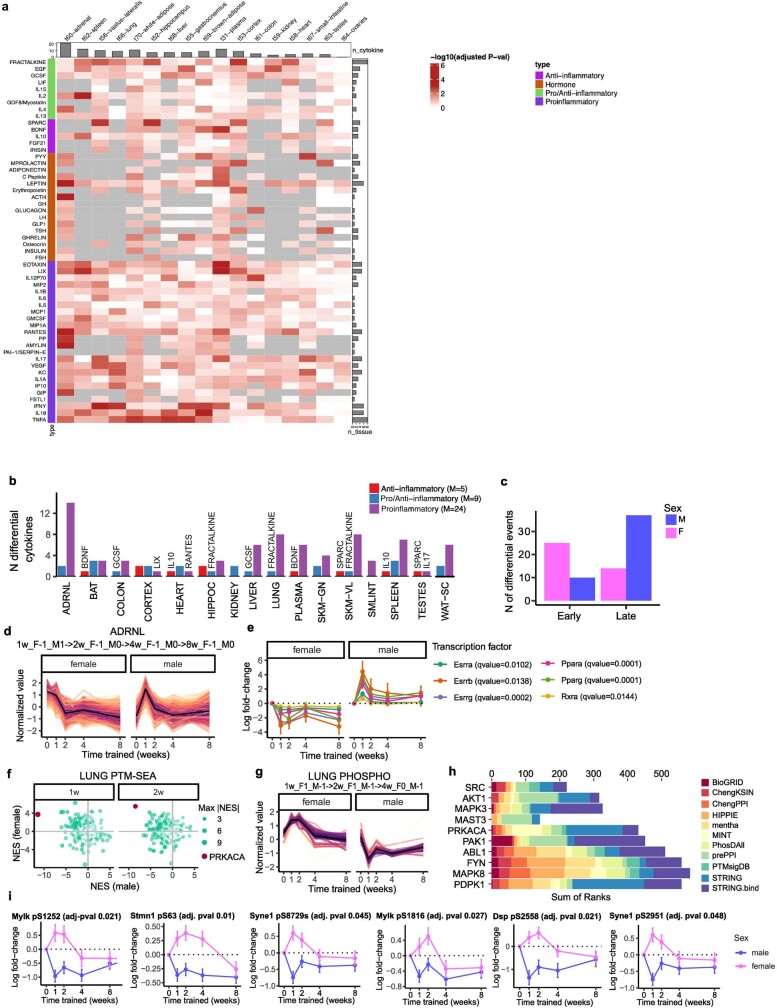
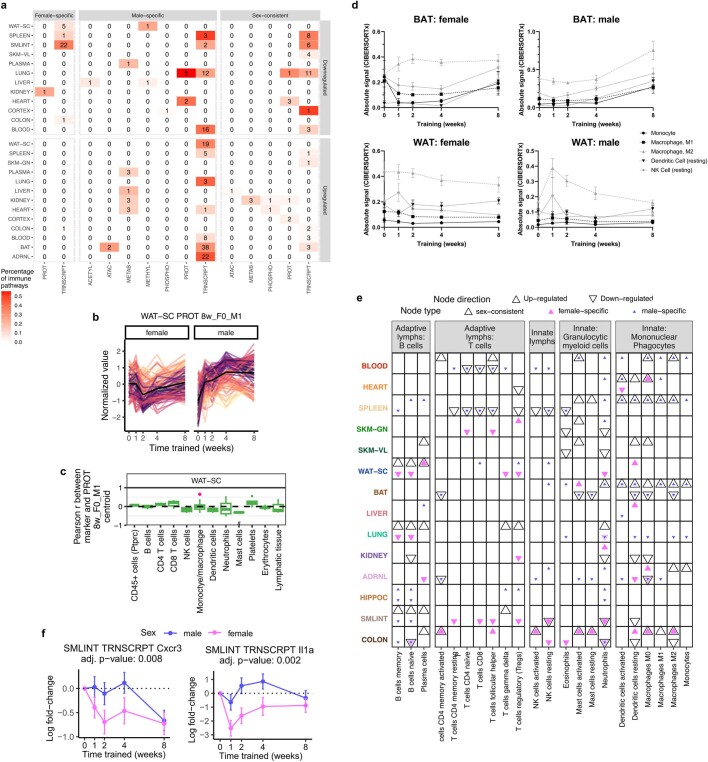
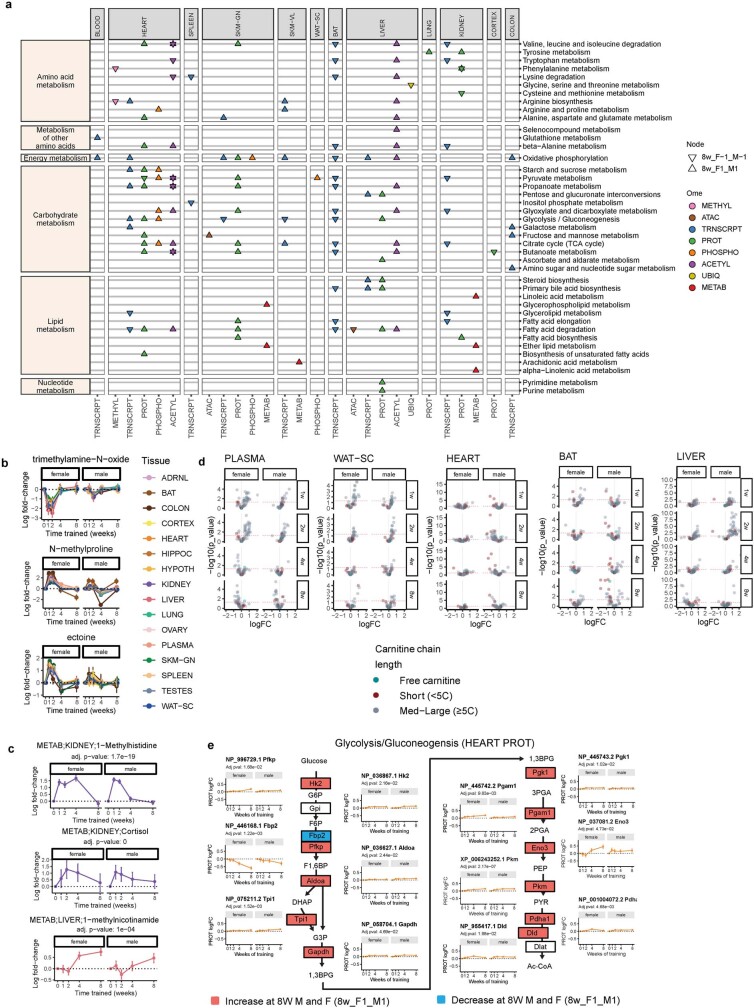
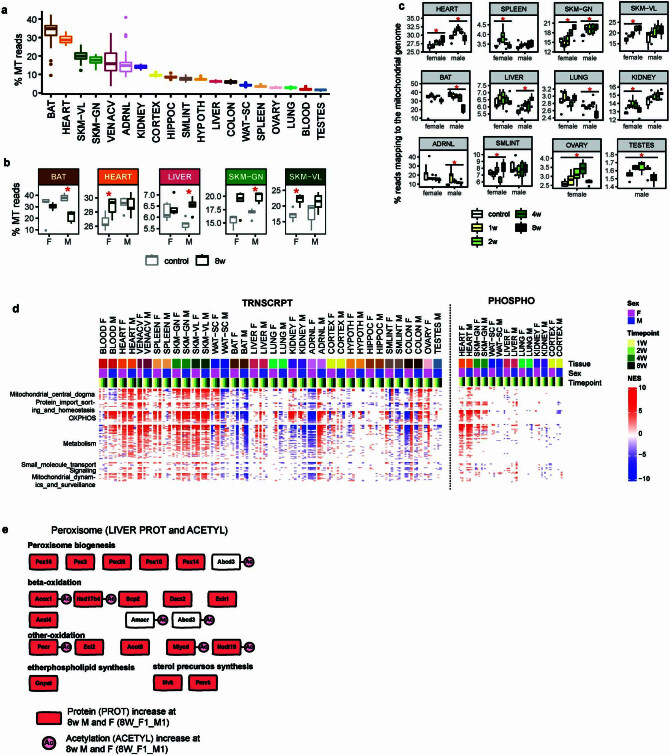
Regular exercise promotes whole-body health and prevents disease, but the underlying molecular mechanisms are incompletely understood1-3. Here, the Molecular Transducers of Physical Activity Consortium4 profiled the temporal transcriptome, proteome, metabolome, lipidome, phosphoproteome, acetylproteome, ubiquitylproteome, epigenome and immunome in whole blood, plasma and 18 solid tissues in male and female Rattus norvegicus over eight weeks of endurance exercise training. The resulting data compendium encompasses 9,466 assays across 19 tissues, 25 molecular platforms and 4 training time points. Thousands of shared and tissue-specific molecular alterations were identified, with sex differences found in multiple tissues. Temporal multi-omic and multi-tissue analyses revealed expansive biological insights into the adaptive responses to endurance training, including widespread regulation of immune, metabolic, stress response and mitochondrial pathways. Many changes were relevant to human health, including non-alcoholic fatty liver disease, inflammatory bowel disease, cardiovascular health and tissue injury and recovery. The data and analyses presented in this study will serve as valuable resources for understanding and exploring the multi-tissue molecular effects of endurance training and are provided in a public repository ( https://motrpac-data.org/ ).


Conflict of interest statement

S.C.B. has equity in Emmyon, Inc. G.R.C. sits on data and safety monitoring boards for AI Therapeutics, AMO Pharma, Astra-Zeneca, Avexis Pharmaceuticals, Biolinerx, Brainstorm Cell Therapeutics, Bristol Meyers Squibb/Celgene, CSL Behring, Galmed Pharmaceuticals, Green Valley Pharma, Horizon Pharmaceuticals, Immunic, Mapi Pharmaceuticals, Merck, Mitsubishi Tanabe Pharma Holdings, Opko Biologics, Prothena Biosciences, Novartis, Regeneron, Sanofi-Aventis, Reata Pharmaceuticals, NHLBI (protocol review committee), University of Texas Southwestern, University of Pennsylvania, Visioneering Technologies, Inc.; serves on consulting or advisory boards for Alexion, Antisense Therapeutics, Biogen, Clinical Trial Solutions LLC, Genzyme, Genentech, GW Pharmaceuticals, Immunic, Klein-Buendel Incorporated, Merck/Serono, Novartis, Osmotica Pharmaceuticals, Perception Neurosciences, Protalix Biotherapeutics, Recursion/Cerexis Pharmaceuticals, Regeneron, Roche, SAB Biotherapeutics; and is the president of Pythagoras Inc., a private consulting company. S.A.C. is a member of the scientific advisory boards of Kymera, PrognomiQ, PTM BioLabs, and Seer. M.P.S. is a cofounder and scientific advisor to Personalis, Qbio, January AI, Filtricine, SensOmics, Protos, Fodsel, Rthm, Marble and scientific advisor to Genapsys, Swaz, Jupiter. S.B.M. is a consultant for BioMarin, MyOme and Tenaya Therapeutics. D.A. is currently employed at Insitro, South San Francisco, CA. N.R.G. is currently employed at 23andMe, Sunnyvale, CA. P.M.J.B. is currently employed at Pfizer, Cambridge, MA. Insitro, 23andMe and Pfizer had no involvement in the work presented here.

Figures

Fig. 1
Fig. 1. Summary of the study design and multi-omics dataset.
a, Experimental design and tissue sample processing. Inbred Fischer 344 rats were subjected to a progressive treadmill training protocol. Tissues were collected from male and female animals that remained sedentary or completed 1, 2, 4 or 8 weeks of endurance exercise training. For trained animals, samples were collected 48 h after their last exercise bout (red pins). b, Summary of molecular datasets included in this study. Up to nine data types (omes) were generated for blood, plasma, and 18 solid tissues, per animal: ACETYL: acetylproteomics; protein site acetylation; ATAC, chromatin accessibility, ATAC-seq data; IMMUNO, multiplexed immunoassays; METAB, metabolomics and lipidomics; METHYL, DNA methylation, RRBS data; PHOSPHO, phosphoproteomics; protein site phosphorylation; PROT, global proteomics; protein abundance; TRNSCRPT, transcriptomics, RNA-seq data; UBIQ, ubiquitylome, protein site ubiquitination. Tissue labels indicate the location, colour code, and abbreviation for each tissue used throughout this study: ADRNL, adrenal gland; BAT, brown adipose tissue; BLOOD, whole blood, blood RNA; COLON, colon; CORTEX, cerebral cortex; HEART, heart; HIPPOC, hippocampus; HYPOTH, hypothalamus; KIDNEY, kidney; LIVER, liver; LUNG, lung; OVARY, ovaries; PLASMA, plasma; SKM-GN, gastrocnemius (skeletal muscle); SKM-VL, vastus lateralis (skeletal muscle); SMLINT, small intestine; SPLEEN, spleen; TESTES, testes; VENACV, vena cava; WAT-SC, subcutaneous white adipose tissue. Icons next to each tissue label indicate the data types generated for that tissue. c, Number of training-regulated features at 5% FDR. Each cell represents results for a single tissue and data type. Colours indicate the proportion of measured features that are differential.
Fig. 2
Fig. 2. Multi-tissue molecular endurance training responses.
a, UpSet plot of the training-regulated gene sets associated with each tissue. Bars and dots indicating tissue-specific differential genes are coloured by tissue. Pathway enrichment analysis is shown for selected sets of genes in b,c as indicated by the arrows. b,c, Significantly enriched pathways (10% FDR) corresponding to genes that are differential in both LUNG and WAT-SC datasets (b) and the 22 genes that are training-regulated in all six tissues considered in a (c). Redundant pathways (those with an overlap of 80% or greater with an existing pathway) were removed. ESR, oestrogen receptor; TH17, T helper 17.
Fig. 3
Fig. 3. Regulatory signalling pathways modulated by endurance training.
a, Transcription factor motif enrichment analysis of the training-regulated transcripts in each tissue. The heat map shows enrichment z-scores across the differential genes for the 13 tissues that had at least 300 genes after mapping transcript IDs to gene symbols. Transcription factors were hierarchically clustered by their enrichment across tissues. CRE, cAMP response element. b, Estimate of activity changes in selected kinases and signalling pathways using PTM signature enrichment analysis on phosphoproteomics data. Only kinases or pathways with a significant difference in at least one tissue, sex or time point (q value < 0.05) are shown. The heat map shows normalized enrichment score (NES) as colour; tissue, sex and time point combinations as columns, and either kinases or pathways as rows. Kinases are grouped by family; rows are hierarchically clustered within each group. FSH, follicle-stimulating hormone; TSH, thyroid-stimulating hormone.
Fig. 4
Fig. 4. Temporal patterns of the molecular training response.
a, Graphical representation of training-differential features in the three muscle tissues: gastrocnemius (SKM-GN), vastus lateralis (SKM-VL) and heart. Each node represents one of nine possible states (rows) at each of the four training time points (columns). Triangles to the left of row labels map states to symbols used in Fig. 5a. Edges represent the path of differential features over the training time course (see Extended Data Fig. 7 for a detailed explanation). Each graph includes the three largest paths of differential features in that tissue, with edges split by data type. Both node and edge size are proportional to the number of features represented. The node corresponding to features that are up-regulated in both sexes at 8 weeks of training (8w_F1_M1) is circled in each graph. b, Line plots of standardized abundances of all 8w_F1_M1 muscle features. The black line represents the average value across all features. c, Network view of significant pathway enrichment results (10% FDR) corresponding to the features in b. Nodes represent pathways; edges represent functionally similar node pairs (set similarity ≥ 0.3). Nodes are included only if they are significantly enriched in at least two of the muscle tissues, as indicated by node colour. Node size is proportional to the number of differential feature sets (for example, gastrocnemius transcripts) for which the pathway is significantly enriched. High-level biological themes were defined using Louvain community detection of the nodes. d, A subnetwork of a larger cluster identified by network clustering 8w_F1_M1 features from SKM-GN. Mech., mechanical.
Fig. 5
Fig. 5. Training-induced immune responses.
a, Enrichment analysis results of the training-differential transcripts at 8 weeks in Kyoto Encyclopedia of Genes and Genomes (KEGG) immune system pathways (10% FDR). NK, natural killer. b, Line plots of standardized abundances of selected training-differential transcripts. Brown and white adipose tissue show male-specific up-regulation at week 8 (8w_F0_M1). The small intestine (SMLINT) shows down-regulation in females and partial down-regulation in males at week 8 (8w_F-1_M0 or 8w_F-1_M-1). c, Box plots of the sample-level Pearson correlation between markers of immune cell types, lymphatic tissue or cell proliferation and the average value of features in b at the transcript level. A pink dot indicates that the marker is also one of the differential features plotted in b. A pound sign indicates that the distribution of Pearson correlations for a set of at least two markers is significantly different from 0 (two-sided one-sample t-test, 5% FDR). When only one marker is used to define a category on the y axis, the gene name is provided in parentheses. In box plots, the centre line represents median, box bounds represent 25th and 75th percentiles, whiskers represent minimum and maximum excluding outliers and blue dots represent outliers.
Fig. 6
Fig. 6. Training-induced changes in metabolism.
a, RefMet metabolite class enrichment calculated using GSEA with the −log10 training P value. Significant chemical class enrichments (5% FDR) are shown as black circles with size is proportional to FDR. Small grey circles are chemical class enrichments that were not significant, and blank cells were not tested owing to low numbers of detected metabolites. TCA, tricarboxylic acid cycle. b, GSEA results using the MitoCarta MitoPathways gene set database and proteomics (PROT) or acetylome (ACETYL) timewise summary statistics for training. NESs are shown for significant pathways (10% FDR). Mitochondrial pathways shown as rows are grouped using the parental group in the MitoPathways hierarchy. OXPHOS, oxidative phosphorylation. c, Line plots of standardized abundances of liver training-differential features across all data types that are up-regulated in both sexes, with a later response in females (LIVER: 1w_F0_M1 − >2w_F0_M1 − >4w_F0_M1 − >8w_F1_M1). The black line represents the average value across all features. d, Network view of pathway enrichment results corresponding to features in c. Nodes indicate significantly enriched pathways (10% FDR); edges connect nodes if there is a similarity score of at least 0.375 between the gene sets driving each pathway enrichment. Node colours indicate omes in which the enrichment was observed. e, log2 fold changes (logFC) relative to sedentary controls for metabolites within the ‘Lipids and lipid related compounds’ category in the 8-week liver. Heat map colour represents fold change (red, positive; blue, negative). Compounds are grouped into columns based on category (coloured bars).
Extended Data Fig. 1
Extended Data Fig. 1. Animal phenotyping and data availability.
a-d) Clinical measurements before and after the training intervention in untrained control rats (SED), 4-week trained rats (4w), and 8-week trained rats (8w). Data are displayed pre and post for each individual rat (connected by a line), with males in blue and females in pink. Filled symbols (n = 5 per sex and time point) represent rats used for all omics analyses, whereas the rat utilized for proteomics only (n = 1 per sex and time point) is represented by a non-filled symbol. Significant results by ANOVA of the overall group effect (#, p < 0.05; ##, p < 0.01) and interaction between group and time (§, p < 0.05; §§ p < 0.01) are indicated. Significant within-group differential responses from a Bonferroni post hoc test are indicated (*, q-value < 0.05; **, q-value < 0.01). a) Aerobic capacity through a VO2max test until exhaustion. Data are reported in ml/(kg.min) for all individual rats and time points. b) Body fat percentage. c) Percent lean mass. (b-c) were assessed through nuclear magnetic resonance spectroscopy. d) Body weight (in grams). e) Description of available datasets. Colored cells indicate that data are available for that tissue and assay. Individual panels and platforms are shown for metabolomics and the multiplexed immunoassays. f) Detailed availability of sample-level data across assays. Each column represents an individual animal, ordered by training group and colored by sex. Gray cells indicate that data were generated for that animal and assay; black cells indicate that data were not generated. Rows are ordered by ome and colored by assay and tissue.
Extended Data Fig. 2
Extended Data Fig. 2. Quality control metrics for omics data.
a) Proteomics multiplexing design using TMT11 reagents for isobaric tagging and a pooled reference sample. The diagram describes processing of a single tissue. Following multiplexing, peptides were used for protein abundance analysis, serial PTM enriched for phosphosite and optional acetylsite quantification, or ubiquitylsite quantification through enrichment of lysine-diglycine ubiquitin remnants. b) Total number of fully quantified proteins per plex in each global proteome dataset. c-e) The total number of fully quantified phosphosites (c), acetylsites (d), and ubiquitylsites (e) per plex in each dataset. f) Distributions of coefficients of variation (CVs) calculated from metabolomics features identified in pooled samples and analyzed periodically throughout liquid chromatography-mass spectrometry runs. CVs were aggregated and plotted separately for named and unnamed metabolites. g) Transcription start site (TSS) enrichment (top) and fraction of reads in peaks (FRiP, bottom) across ATAC-seq samples per tissue. h) Distributions of RNA integrity numbers (RIN, top) and median 5′ to 3′ bias (bottom) across samples in each tissue in the RNA-Seq data. i) Percent methylation of CpG, CHG and CHH sites in the RRBS data. For boxplots in (h,i): center line represents median; box bounds represent 25th and 75th percentiles; whiskers represent minimum and maximum excluding outliers; filled dots represent outliers. j) Number of wells across multiplexed immunoassays with fewer than 20 beads. Measurements from these 182 wells were excluded from downstream analysis. k) 2D density plot of targeted analytes’ mean fluorescence intensity (MFI) versus corresponding CHEX4 MFI from the same well for each multiplexed immunoassay measurement, where CHEX4 is a measure of non-specific binding.
Extended Data Fig. 3
Extended Data Fig. 3. Permutation tests.
a-b) Permutation tests of groups within males (a) and females (b). For each sex, the original group labels were shuffled to minimize the number of animal pairs that remain in the same group. Only the group labels were shuffled and all other covariates remained as in the original data. For each permuted dataset, the differential abundance pipeline was rerun and the number of transcripts that were selected at 5% FDR adjustment were re-counted. c-d) Permutation tests of sex within groups. For each group and each sex, half of the animals were selected randomly and their sex was swapped. Only the sex labels were shuffled and all other covariates remained as in the original data. For each permutation the differential analysis pipeline was rerun and the timewise summary statistics were extracted. A gene was considered sexually dimorphic if for at least one time point the z-score (absolute) difference between males and females was greater than 3. c) Counts of sexually dimorphic genes among the IHW-selected genes of the original data. d) Counts of sexually dimorphic genes among the 5% FDR selected genes within each permuted dataset. Each boxplot in (a-d) represents the differential abundance analysis results over 100 permutations of the transcriptomics data in a specific tissue. Center line represents median; box bounds represent 25th and 75th percentiles; whiskers represent minimum and maximum excluding outliers; open circles represent outliers. Added points represent the results of the true data labels, and their shape corresponds to the empirical p-value (●: p > 0.05; ×: 0.01 < p < 0.05; *: p ≤ 0.01).
Extended Data Fig. 4
Extended Data Fig. 4. Correlations between proteins and transcripts throughout endurance training.
a) Number of tissues in which each gene, including features mapped to genes from all omes, is training-regulated. Only differential features from the subset of tissues with deep molecular profiling (lung, gastrocnemius, subcutaneous white adipose, kidney, liver, and heart) and the subset of omes that were profiled in all six of these tissues (DNA methylation, chromatin accessibility, transcriptomics, global proteomics, phosphoproteomics, multiplexed immunoassays) were considered. Numbers above each bar indicate the number of genes that are differential in exactly the number of tissues indicated on the x-axis. b) Pathways significantly enriched by tissue-specific training-regulated genes represented in Fig. 2a (q-value < 0.1). KEGG and Reactome pathways were queried, and redundant pathways were removed (i.e., those with an overlap of 80% or greater with an existing pathway). c) Heatmaps showing the Pearson correlation between the TRNSCRPT and PROT timewise summary statistics (z- and t-scores, respectively) (top, gene-level) and pathway-level enrichment results (Gene Set Enrichment Analysis normalized enrichment scores) (bottom, pathway-level). d) Scatter plots of pathway GSEA NES of the TRNSCRPT and PROT datasets in the seven tissues for which these data were acquired. Pathways showing high discordance or agreement across TRNSCRPT and PROT and with functional relevance or general interest were highlighted.
Extended Data Fig. 5
Extended Data Fig. 5. Heat shock response.
a) Scatter plots of the protein t-scores (PROT) versus the transcript z-scores (TRNSCRPT) by gene at 8 weeks of training (8 W) relative to sedentary controls. Data are shown for the seven tissues for which both proteomics and transcriptomics was acquired. Red points indicate genes associated with the heat shock response, and the labeled points indicate those with a large differential response at the protein level. b-c) Line plots showing protein b) and transcript (c) log2 fold-changes relative to the untrained controls for a subset of heat shock proteins with increased abundance during exercise training. Each line represents a protein in a single tissue.
Extended Data Fig. 6
Extended Data Fig. 6. Regulatory signaling pathways modulated by endurance training.
a) Heatmap of differences in TF motif enrichment in training-regulated genes across tissues. Each value reflects the average difference in motif enrichment for shared transcription factors. Tissues are clustered with complete linkage hierarchical clustering. b) (left) Filtered PTM-SEA results for the liver showing kinases and signaling pathways with increased activity. (right) Heatmap showing t-scores for phosphosites within the HGF signaling pathway. c) Hypothetical model of HGF signaling effects during exercise training. Phosphorylation of STAT3 and PXN is known to modulate cell growth and cell migration, respectively. Error bars=SEM. d) Filtered PTM-SEA results for the heart showing selected kinases with significant enrichments in at least one time point. Heatmap shows the NES as color and enrichment p-value as dot size. Kinases are grouped by kinase family and sorted by hierarchical clustering. e) (top) Log2 fold-change of GJA1 and CDH2 protein abundance in the heart. No significant response to exercise training was observed for these proteins (F-test; q-value > 0.05). (bottom) Log2 fold-changes for selected Src kinase phosphosite targets, GJA1 pY265 and CDH2 pY820, in the heart. These phosphosites show a significant response to exercise training (F-test, 5% FDR). Error bars=SEM. f) Gene Set Enrichment Analysis (GSEA) results from the heart global proteome dataset using the matrisome gene set database. Heatmap shows NES as color and enrichment p-value as dot size. Rows are clustered using hierarchical clustering. g) Log2 fold-change for basement membrane proteins in heart. Proteins showing a significant response to exercise training are highlighted in orange (F-test; 5% FDR). Error bars=SEM. h) Log2 protein fold-change of NTN1 protein abundance in heart. A significant response to exercise training was observed for these proteins (F-test; 5% FDR). Error bars=SEM.
Extended Data Fig. 7
Extended Data Fig. 7. Graphical representation of differential results.
a) Number of training-regulated features assigned to groups of graphical states across tissues and time. Red points indicate features that are up-regulated in at least one sex (e.g., only in males: F0_M1; only in females: F1_M0; in both sexes: F1_M1), and blue points indicate features down-regulated in at least one sex (only in males: F0_M-1; only in females: F-1_M0; in both sexes: F-1_M-1). Green points indicate features that are up-regulated in males and down-regulated in females or vice versa (F-1_M1 and F1_M-1, respectively). Point size is proportional to the number of features. Point opacity is proportional to the within-tissue fraction of features represented by that point. Features can be represented in multiple points. The number of omes profiled in each tissue is provided in parentheses next to the tissue abbreviation. b) A schematic example of the graphical representation of the differential analysis results. Top: the z-scores of four features. A positive score corresponds to up-regulation (red), and a negative score corresponds to down regulation (blue). Bottom: the assignment of features to node sets and full path sets (edge sets are not shown for conciseness but can be easily inferred from the full paths). Node labels follow the [time]_F[x]_M[y] format where [time] shows the animal sacrifice week and can take one of (1w, 2w, 4w, or 8w), and [x] and [y] are one of (−1,0,1), corresponding to down-regulation, no effect, and up-regulation, respectively. c) Graphical representation of the feature sets. Columns are training time points, and rows are the differential abundance states. Node and edge sizes are proportional to the number of features that are assigned to each set.
Extended Data Fig. 8
Extended Data Fig. 8. Key pathway enrichments per tissue.
Key pathway enrichments for features that are up-regulated in both sexes at 8 weeks of training in each tissue. For display purposes, enrichment q-values were floored to 1e-10 (Enrichment FDR (−log10) = 10). Bars are colored by the number of omes for which the pathway was significantly enriched (q-value < 0.01) (lighter gray: 1 ome; darker gray: 2 omes; black: 3 omes). Pathways were selected from Supplementary Table 10.
Extended Data Fig. 9
Extended Data Fig. 9. Associations with signatures of human health and complex traits.
a) Jaccard coefficients between gene sets identified by different omes in 8-week gastrocnemius up-regulated features (“X” marks overlap p > 0.05). b) Network connectivity p-values (Pathways, Biogrid, and string) among the gastrocnemius week-8 multi-omic genes and with the single-omic genes. c) Proportion of features from each ome represented in the gastrocnemius response clusters, identified by the network clustering analysis. d-g) Overlap between our rat vastus lateralis differential expression results and the meta-analysis of human long-term exercise studies by Amar et al. d-e) Spearman correlation (d) and its significance (e) between the meta-analysis fold-changes and the log2 fold-changes foreach sex and time point. f) GSEA results. Genes were ranked by meta-analysis (−log10 p-value*log2 fold-change) and the rat training-differential, sex-consistent gene sets were tested for enrichment at the bottom of the ranking (negative scores) or the top (positive scores). g) Overlap between the rat gene sets from (f) and the high-heterogeneity human meta-analysis genes (I2 > 75%). h) -log10 overlap p-values (Fisher’s exact test), comparing rat female gastrocnemius and vastus lateralis week-8 differential transcripts from this study (p < 0.01) and the differential genes from the rat female soleus data of Bye et al. (p < 0.01). HCR: high capacity runners, LCR: low capacity runners. i) A comparison of rat gastrocnemius differential proteins from this study (p < 0.01) and the human endurance training proteomics results of Hostrup et al. (p < 0.01) using Fisher’s exact test. Left: -log10 overlap p-values. Right: -log10 sex concordance p-values. j) Statistics of the overlapping proteins from (i), week-8 female comparison (y: rat z-scores, x: human t-scores). k) DOSE disease enrichment results of the white adipose, kidney, and liver gene sets. DOSE was applied only on diseases that are relevant for each tissue. The network shows the results for the sex-consistent down-regulated features at week-8.
Extended Data Fig. 10
Extended Data Fig. 10. Characterization of the extent of sex difference in the endurance training response.
The extent of sex differences in the training response were characterized in two ways: first, by correlating log2 fold-changes between males and females for each training-differential feature; second, by calculating the difference between the area under the log2 fold-change curve for each training-differential feature, including a (0,0) point (ΔAUC, males - females). The first approach characterizes differences in direction of effect while the second approach characterizes differences in magnitude. Left plot for each tissue: density line plots of correlations from the first approach. Densities or correlations corresponding to features in each ome are plotted separately, with a label that provides the ome and the number of differential features represented. Right plot for each tissue: 2D density plot of ΔAUC against the correlation between the male and female log2 fold-changes for each training-differential feature used to simultaneously evaluate sex differences in the direction and magnitude of the training response. Points at the top-center of these 2D density plots represent features with high similarity between males and females in terms of both direction and magnitude; features on the right and left sides of the plots represent features with greater magnitudes of response in males and females, respectively.
Extended Data Fig. 11
Extended Data Fig. 11. Sex differences in the endurance training response.
a) Heatmap of the training response of immunoassay analytes across tissues. Gray indicates no data. Bars indicate the number of training-regulated analytes in each tissue (top) and the number of tissues in which the analyte is training-regulated (right, 5% FDR). b) Training-differential cytokines across tissues. 5, 24, and 9 cytokines were annotated as anti-, pro-, and pro/anti- inflammatory, respectively. Bars indicate the number of annotated cytokines in each category that are differential (5% FDR). c) Counts of early vs. (1- or 2-week) vs. late (4- or 8-week) differential cytokines, according to states assigned by the graphical analysis, including all tissues. Cytokines with both early and late responses in the same tissue were excluded. d) Line plots of standardized abundances of training-differential features that follow the largest graphical path in the adrenal gland (i.e., 1w_F-1_M1 − >2w_F-1_M0 − >4w_F-1_M0 − >8w_F-1_M0 according to our graphical analysis notation). The black line represents the average value across all features. The closer a colored line is to this average, the darker it is (distance calculated using sum of squares). e) Line plots of transcript-level log2 fold-changes corresponding to six transcription factors (TFs) whose motifs are significantly enriched by transcripts in (d). TF motif enrichment q-values are provided in the legend (error bars = SEM). f) Male versus female NES from PTM-SEA in the lung. Anticorrelated points corresponding to PRKACA NES are in dark red. g) Line plots of standardized abundances of training-differential phosphosites that follow the largest graphical edges of phosphosites in the lung (1w_F1_M-1 − >2w_F1_M-1 − >4w_F0_M-1). h) Top ten kinases with the greatest over-representation of substrates (proteins) corresponding to training-differential phosphosites in (g). MeanRank scores by library are shown, as reported by KEA3. i) Line plots showing phosphosite-level log2 fold-changes of PRKACA phosphosite substrates identified in the lung as differential with disparate sex responses (error bars = SEM).
Extended Data Fig. 12
Extended Data Fig. 12. Assessment of immune responses to endurance training.
a) Heatmap of the number and percent of KEGG and Reactome immune pathways significantly enriched by training-regulated features at 8 weeks. b) Line plots of standardized abundances of training-differential proteins in white adipose tissue up-regulated only in males at 8 weeks. Black line shows average across all features. c) Boxplots of the sample-level Pearson correlation between markers of immune cell types, lymphatic tissue, or cell proliferation and the average value of features in (b) at the protein level. Center line represents median; box bounds represent 25th and 75th percentiles; whiskers represent minimum and maximum excluding outliers; filled dots represent outliers. A pink point indicates that the marker is also one of the differential features plotted in (b). # indicates when the distribution of Pearson correlations for a set of at least two markers is significantly different from 0 (two-sided one-sample t-test, 5% BY FDR). When only one marker is used to define a category on the y-axis, the gene name is provided in parentheses. d) Trajectories of mean absolute signal of various immune cell types in BAT or WAT-SC following deconvolution of bulk RNA-Seq with CIBERSORTx (error bars = SEM). e) Immune cell type enrichment analysis results of training-differentially expressed transcripts. Points represent significant enrichments (5% FDR, one-sided Mann-Whitney U test). f) Line plots showing the log2 fold-changes for Cxcr3 and Il1a transcripts in the small intestine (error bars = SEM).
Extended Data Fig. 13
Extended Data Fig. 13. Metabolic effects of endurance training.
a) Significant enrichments for relevant categories of KEGG metabolism pathways from features that are up- or down- regulated in both sexes at 8 weeks (8w_F1_M1 and 8w_F-1_M-1 nodes, respectively). Triangles point in the direction of the response (up or down). Points are colored by ome. b) Log2 fold-change of metabolites regulated across many tissues (F-Test, 5% FDR, error bars=SEM). c) Log2 fold-change of training-regulated metabolites: 1-methylhistidine in the kidney, cortisol in the kidney, and 1-methylnicotinamide in the liver (F-Test, 5% FDR, error bars = SEM). d) Volcano plots showing abundance changes (log2 fold-changes; logFC) and significance (-log10 nominal p-values) for acyl-carnitines. Features are colored based on the carnitine chain length. e) Protein abundance changes in the glycolysis and gluconeogenesis pathway in the heart tissue after 8 weeks of training. Line plots show the log2 fold-changes over the training time course (error bars = SEM). Red and blue boxes indicate a statistically significant (F-test, 5% FDR) increase and decrease in abundance, respectively, for both males and females at 8 weeks.
Extended Data Fig. 14
Extended Data Fig. 14. Mitochondria and peroxisome adaptations to endurance training.
a) Boxplots showing the percent of mitochondrial genome reads across samples in each tissue that map to the mitochondrial genome (% MT reads). b) Comparison of % MT reads between untrained controls and animals trained for 8 weeks. Plot shows tissues with a statistically significant change after 8 weeks in at least one sex (red asterisk, two-sided Dunnett’s test, 10% FDR). For boxplots in (b,c): center line represents median; box bounds represent 25th and 75th percentiles; whiskers represent minimum and maximum excluding outliers; filled dots represent outliers. c) Boxplots showing the percent of mitochondrial genome reads across tissue, sex, and time points. Center line represents median; box bounds represent 25th and 75th percentiles; whiskers represent minimum and maximum excluding outliers; open circles represent outliers. Red asterisks indicate a significant change throughout the training time course (F-test, 5% FDR). Center line represents median; box bounds represent 25th and 75th percentiles; whiskers represent minimum and maximum excluding outliers; blue dots represent outliers. d) GSEA using the MitoCarta MitoPathways gene set database and transcriptome (TRNSCRPT) or phosphoproteome (PHOSPHO) differential analysis results. NES are shown for significant pathways (10% FDR) for all tissues, sexes, and time points within the heatmap. Mitochondria pathways (rows) are grouped using the parental group in the MitoPathways hierarchy. e) Protein abundance and protein acetylation level changes in the peroxisome KEGG pathway in the liver tissue after 8 weeks of training. Red boxes indicate an increase in abundance for both males and females, while red circles indicate an increase in at least one acetylsite within the protein (8w_F1_M1 cluster).

Similar articles

Cited by

References

    1. Blair SN, et al. Physical fitness and all-cause mortality. A prospective study of healthy men and women. JAMA. 1989;262:2395–2401. doi: 10.1001/jama.1989.03430170057028. - DOI - PubMed
    1. Booth FW, Roberts CK, Laye MJ. Lack of exercise is a major cause of chronic diseases. Compr. Physiol. 2012;2:1143–1211. doi: 10.1002/cphy.c110025. - DOI - PMC - PubMed
    1. Neufer PD, et al. Understanding the cellular and molecular mechanisms of physical activity-induced health benefits. Cell Metab. 2015;22:4–11. doi: 10.1016/j.cmet.2015.05.011. - DOI - PubMed
    1. Sanford JA, et al. Molecular Transducers of Physical Activity Consortium (MoTrPAC): mapping the dynamic responses to exercise. Cell. 2020;181:1464–1474. doi: 10.1016/j.cell.2020.06.004. - DOI - PMC - PubMed
    1. Nocon M, et al. Association of physical activity with all-cause and cardiovascular mortality: a systematic review and meta-analysis. Eur. J. Cardiovasc. Prev. Rehabil. 2008;15:239–246. doi: 10.1097/HJR.0b013e3282f55e09. - DOI - PubMed

Publication types

MeSH terms