. 2024 May;8(5):499-512.
doi: 10.1038/s41551-024-01202-w. Epub 2024 May 1.

Targeted desialylation and cytolysis of tumour cells by fusing a sialidase to a bispecific T-cell engager

Affiliations

Targeted desialylation and cytolysis of tumour cells by fusing a sialidase to a bispecific T-cell engager

Zhuo Yang et al. Nat Biomed Eng. 2024 May.

Abstract

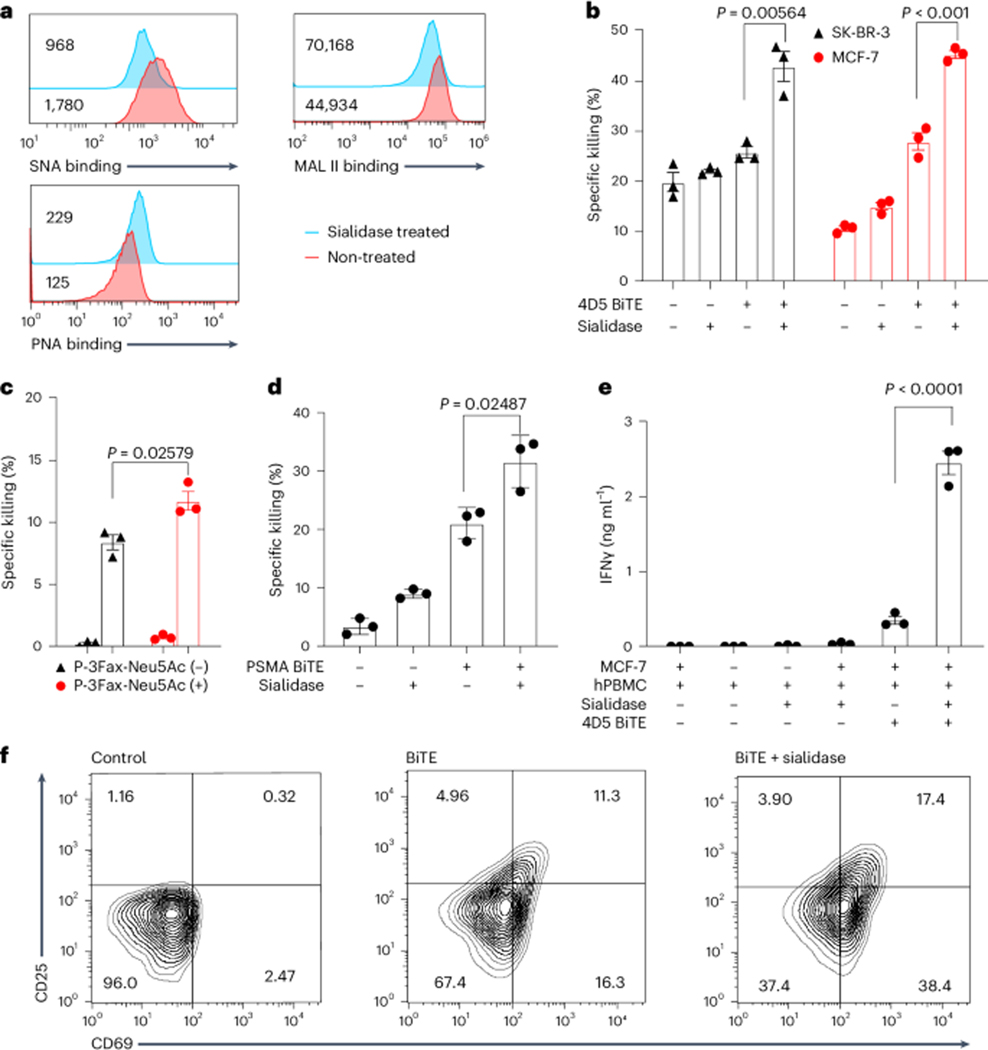
Bispecific T-cell engagers (BiTEs) bring together tumour cells and cytotoxic T cells by binding to specific cell-surface tumour antigens and T-cell receptors, and have been clinically successful for the treatment of B-cell malignancies. Here we show that a BiTE-sialidase fusion protein enhances the susceptibility of solid tumours to BiTE-mediated cytolysis of tumour cells via targeted desialylation-that is, the removal of terminal sialic acid residues on glycans-at the BiTE-induced T-cell-tumour-cell interface. In xenograft and syngeneic mouse models of leukaemia and of melanoma and breast cancer, and compared with the parental BiTE molecules, targeted desialylation via the BiTE-sialidase fusion proteins enhanced the formation of immunological synapses, T-cell activation and T-cell-mediated tumour-cell cytolysis in the presence of the target antigen. The targeted desialylation of tumour cells may enhance the potency of therapies relying on T-cell engagers.


Figures

Fig. 1 |
Fig. 1 |. Removal of sialic acid enhances BiTE-induced T-cell cytotoxicity and activation.
a, Measurement of sialic acid levels on the surface of SK-BR-3 cells after treatment with B. infantis sialidase using the sialic acid-binding lectin SNA-FITC and MAL II-biotin and the galactose-binding lectin PNA-FITC. The MFI is shown in the figure. b, Killing of SK-BR-3 cells and MCF-7 cells induced by 4D5 BiTEs with or without sialidase treatment. c, Killing of SK-BR-3 cells induced by 4D5 BiTEs + hPBMCs with or without previous treatment with the 100 mM sialylation inhibitor P-3Fax-Neu5Ac. d, Killing of PSMA-positive PC3 cells induced by PSMA-targeting BiTEs with or without sialidase treatment. e, IFNγ release was measured as an indicator of BiTE-induced T-cell activation by incubating MCF-7 cells with 4D5 BiTEs + hPBMCs with or without the addition of sialidase. f, CD25 and CD69 expression levels were measured in T cells with or without the presence of 4D5 BiTEs and sialidase. The effector-to-target ratio used for all experiments in the figure is 5:1. Sialidase was added at a concentration of 1.5 mg ml−1. Mean values represent three independent experiments with s.e.m. as error bars. Unpaired Student’s t-test with Welch correction was used for statistical analysis.
Fig. 2 |
Fig. 2 |. Desialylation promotes stronger BiTE-mediated IS formation rather than suppressing the inhibitory Siglec signalling.
a, Siglec-7 and Siglec-9 expression levels were measured on human T cells with or without BiTE-induced activation and with or without sialidase treatment. b, Siglec-7 and Siglec-9 expression levels were measured on T cells and CD3 cells in PBMCs from healthy human donors. c, SK-BR-3 cell killing induced by 4D5 BiTEs was measured with or without the addition of sialidase or anti-Siglec-9 antibody. d,e, SK-BR-3 cell killing induced by 4D5 BiTEs was measured in the presence or absence of sialidase with added recombinant CTLA-4 (d) and anti-CD2-blocking antibody (e). f, Staining of CD3ζ and F-actin to visualize the IS formed by T cells and tumour cells by confocal microscopy. Two groups, with and without sialidase treatment of the tumour cells, were imaged. Scale bar, 10 mm. g, CD3 accumulation at the IS was calculated by dividing the MFI at the IS by the MFI of the rest of the membrane. h, Relative IS contact area was calculated by dividing the area of the IS by the area of the rest of the T-cell membrane. All analyses were done using ImageJ. Mean values show three independent experiments with s.e.m. as error bars. For statistical analysis, unpaired Student’s t-test with Welch correction was applied.
Fig. 3 |
Fig. 3 |. Construction of 4D5 BiTE–sialidase fusion proteins for selective desialylation of HER2-positive cells.
a, Two fusion proteins are constructed by fusing sialidase to either the N- or C-terminus of the 4D5 BiTE. b, Measurement of sialic acid levels on the surface of SK-BR-3 and SKOV-3 cells after treatment with the fusion proteins and staining with the lectins SNA-FITC, MAL II-biotin and PNA-FITC. SNA staining was performed on both SK-BR-3 and SKOV-3 cells (top), while MAL II and PNA staining were performed on SK-BR-3 cells (bottom). The MFI is shown in the figure. c, Comparison of desialylation efficiency between 4D5 BiTE–sialidase, sialidase–4D5 BiTE and free sialidase at different concentrations as shown by MAL II and PNA staining. d, HER2-positive SKOV-3 cells and HER2-negative MDA-MB-468 cells were mixed and treated with 5 nM or 50 nM 4D5 BiTE–sialidase. Cell-surface sialylation was measured by FITC-SNA staining and flow cytometry analysis.
Fig. 4 |
Fig. 4 |. 4D5 BiTE–sialidase exhibits better activities than 4D5 BiTE for killing HER2-positive target cells and activating T cells.
a,b, Specific lysis of HER2-positive SK-BR-3 (a) and SKOV-3 (b) cells with 4 nM 4D5 BiTE or sialidase fusion proteins at an effector-to-target ratio of 5:1. c,d, Dose-dependent targeted killing with 4D5 BiTE or 4D5 BiTE–sialidase against SK-BR-3 (c) and SKOV-3 (d) cells. eg, CD25 (e), CD69 (f) and CD107a (g) expression was measured in T-cell populations in the presence of SK-BR-3 cells and 4 nM 4D5 BiTE or the fusion protein. hj, IFNγ (h), IL-2 (i) and TNF (j) release were measured for 4D5 BiTE or fusion protein induced T-cell activation in the presence of SK-BR-3 cells. k, The cytotoxicity enhancements induced by 4D5 BiTE–sialidase compared with 4D5 BiTE for cell lines with different HER2 expression levels. l, The specific lysis of MDA-MB-468 cells under 4 nM 4D5 BiTE or 4D5 BiTE–sialidase at an effector-to-target ratio of 5:1. m, Volcano plot of differentially expressed genes between T cells treated with 4D5 BiTE or 4D5 BiTE–sialidase when co-cultured with target MDA-MB-231 cells (genes with adjusted P value <0.01 are shown). Relevant differentiated genes are highlighted in red. FC, fold change. n, The heatmap of cytokine activities ranked by CytoSig. EC50 values were calculated from a sigmoidal dose–response curve model using Prism8. Statistical analysis was performed using unpaired Student’s t-test with Welch correction.
Fig. 5 |
Fig. 5 |. 4D5 BiTE–sialidase promotes stronger IS formation between SK-BR-3 cells and Jurkat cells.
a, Fluorescence confocal microscopy of SK-BR-3 cells and Jurkat cells treated with either 4D5 BiTE or 4D5 BiTE–sialidase. F-actin (blue), CD3 (red), HER2 (green) and pZAP70 (cyan) are shown in the figure for three sets of data for each condition. DIC stands for differential interference contrast. Scale bars, 10 mm. be, Quantification of F-actin (b), CD3 (c), HER2 (d) and pZAP70 (e) TFI at the synaptic area between SK-BR-3 cells and Jurkat cells. Unpaired Student’s t-test with Welch correction was used for statistical analysis.
Fig. 6 |
Fig. 6 |. BiTE–sialidase exhibits better tumour control than BiTE in vivo.
a, Experimental timeline and treatment protocol for a HER2-positive SK-BR-3 breast cancer xenograft in NCG mice (n = 5). b, Serum IFNγ release was measured 5 h after the first drug treatment. c, Bioluminescence was measured twice a week to visualize changes in tumour volume. On day 41, one mouse in the PBS control group died. d,e, Bioluminescence was measured and calculated for each mouse as an indication of tumour burden. Tumour progression was followed by plotting the change in the group average (d) and individual (e) values over time. f, Experimental timeline and treatment protocol for a xenograft NALM-6 model of acute lymphoblastic leukaemia. g, Bioluminescence measured on days 3 and 7 is shown for different groups to compare tumour burden. h, Tumour burden was measured and calculated by following the bioluminescence signals (n = 5). One-way analysis of variance and Student’s t-test were used to analyse the differences between groups.
Fig. 7 |
Fig. 7 |. EGFR BiTE–sialidase shows improved tumour control by altering the composition of tumour-infiltrating immune cells in a syngeneic mouse model of melanoma.
a, Measurement of sialic acid levels on the surface of B16-E5 cells after treatment of EGFR BiTE–sialidase with sialic acid-binding lectin SNA. The MFI is shown in the figure. b,c, Tumour growth curve (b) and survival percentage (c) of the B16-E5 mouse model under intratumoural treatment with PBS, EGFR BiTE and EGFR BiTE–sialidase. B16-E5 cells (0.6 million) were inoculated into C57BL/6J mice (s.c.) and 0.5 μg BiTE or 0.93 μg BiTE–sialidase was administered intratumourally on days 8, 12 and 14 (n = 5 for each group). d, Profiling of tumour-infiltrating cells in the B16-E5 mouse model. Left: B16-E5 cells (0.6 million) were inoculated into C57BL/6J mice and 1.5 μg BiTE and 2.8 μg BiTE–sialidase were administered intratumourally on day 11 before killing on day 14. Right: Tumour weight on day 14. e,f, Total cell counts of CD45.2+ (e) and CD8+ (f) cells in tumour lymph nodes isolated on day 14. LN, lymph node. gk, Percentage of CD8+ T cells (g), NK cells (h), CD4+ T cells (i), CD11c-positive cells (j) and CD11b-positive NK1.1-negative cells (k) in the tumours of different treatment groups (n = 5). Unpaired Student’s t-test with Welch correction was used for statistical analysis. Kaplan–Meier with log-rank test and Cox regression for survival analysis.

References

    1. Goebeler M-E & Bargou RC T cell-engaging therapies—BiTEs and beyond. Nat. Rev. Clin. Oncol---. 17, 418–434 (2020). - PubMed
    1. Przepiorka D. et al. FDA approval: blinatumomab. Clin. Cancer Res. 21, 4035–4039 (2015). - PubMed
    1. Arvedson T. et al. Targeting solid tumors with bispecific T cell engager immune therapy. Annu. Rev. Cancer Biol. 6, 17–34 (2021).
    1. Singh A, Dees S. & Grewal IS Overcoming the challenges associated with CD3+ T-cell redirection in cancer. Br. J. Cancer 124, 1037–1048 (2021). - PMC - PubMed
    1. Munn DH & Bronte V. Immune suppressive mechanisms in the tumor microenvironment. Curr. Opin. Immunol. 39, 1–6 (2016). - PMC - PubMed

MeSH terms