

Quantifying reciprocal relationships between poverty and health: combining a causal loop diagram with longitudinal structural equation modelling
- PMID: 38693575
- PMCID: PMC11061969
- DOI: 10.1186/s12939-024-02172-w
Quantifying reciprocal relationships between poverty and health: combining a causal loop diagram with longitudinal structural equation modelling
Abstract
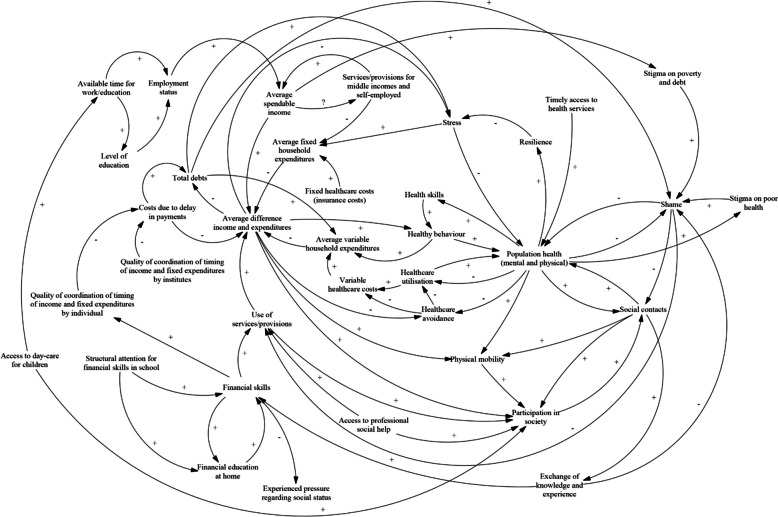
Background: This study takes on the challenge of quantifying a complex causal loop diagram describing how poverty and health affect each other, and does so using longitudinal data from The Netherlands. Furthermore, this paper elaborates on its methodological approach in order to facilitate replication and methodological advancement.
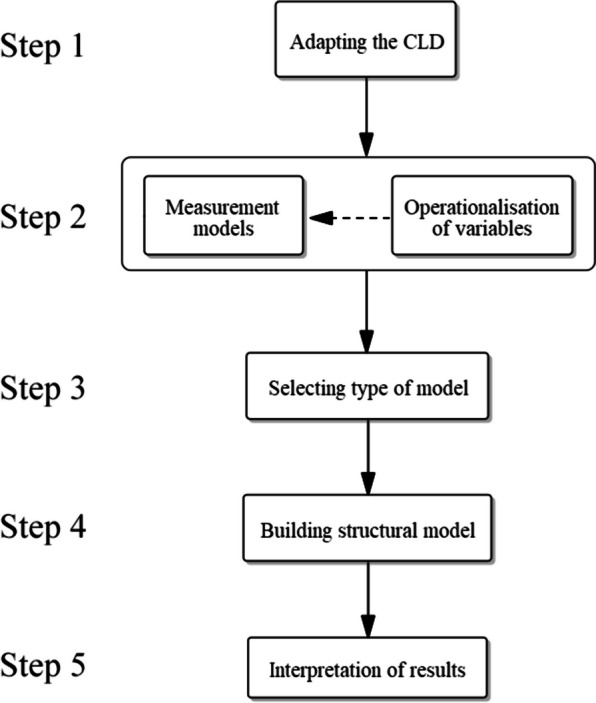
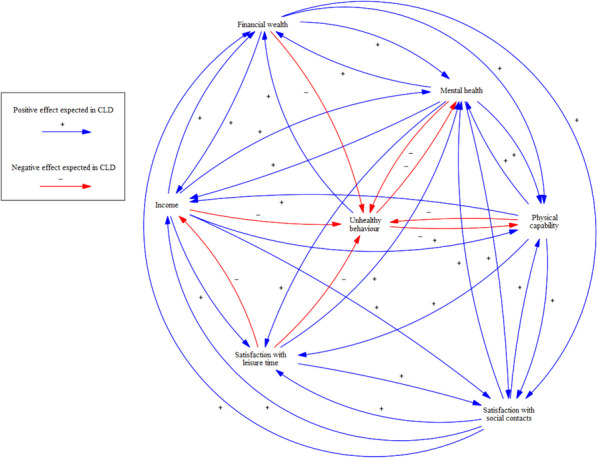
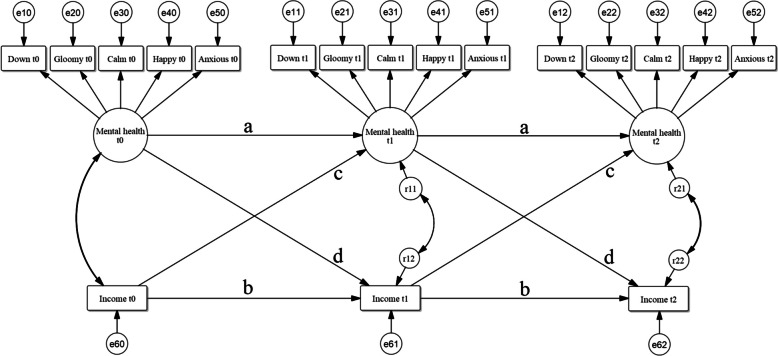
Methods: After adapting a causal loop diagram that was built by stakeholders, a longitudinal structural equation modelling approach was used. A cross-lagged panel model with nine endogenous variables, of which two latent variables, and three time-invariant exogenous variables was constructed. With this model, directional effects are estimated in a Granger-causal manner, using data from 2015 to 2019. Both the direct effects (with a one-year lag) and total effects over multiple (up to eight) years were calculated. Five sensitivity analyses were conducted. Two of these focus on lower-income and lower-wealth individuals. The other three each added one exogenous variable: work status, level of education, and home ownership.
Results: The effects of income and financial wealth on health are present, but are relatively weak for the overall population. Sensitivity analyses show that these effects are stronger for those with lower incomes or wealth. Physical capability does seem to have strong positive effects on both income and financial wealth. There are a number of other results as well, as the estimated models are extensive. Many of the estimated effects only become substantial after several years.
Conclusions: Income and financial wealth appear to have limited effects on the health of the overall population of The Netherlands. However, there are indications that these effects may be stronger for individuals who are closer to the poverty threshold. Since the estimated effects of physical capability on income and financial wealth are more substantial, a broad recommendation would be that including physical capability in efforts that are aimed at improving income and financial wealth could be useful and effective. The methodological approach described in this paper could also be applied to other research settings or topics.
Keywords: Causal loop diagram; Financial wealth; Income; Indirect effects; Latent variables; Longitudinal; Poverty; Quantification; Social determinants of health; Structural equation modelling.
© 2024. The Author(s).
Conflict of interest statement
The authors declare no competing interests.
Figures


References
-
- Collins SD. Economic status and health: a review and study of the relevant morbidity and mortality data. 1924.
-
- Ratcliff KS. The social determinants of health: looking upstream. Cambridge: Polity; 2017.
-
- World Health Organization. Social determinants of health. https://www.who.int/health-topics/social-determinants-of-health. Accessed 19 Feb 2024.
Publication types
MeSH terms
Grants and funding
LinkOut - more resources
Full Text Sources
