

A physiologically-based pharmacokinetic precision dosing approach to manage dasatinib drug-drug interactions
- PMID: 38693610
- PMCID: PMC11247110
- DOI: 10.1002/psp4.13146
A physiologically-based pharmacokinetic precision dosing approach to manage dasatinib drug-drug interactions
Abstract
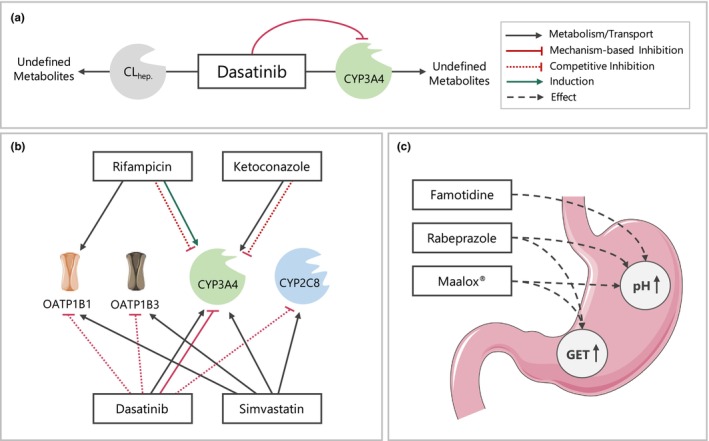
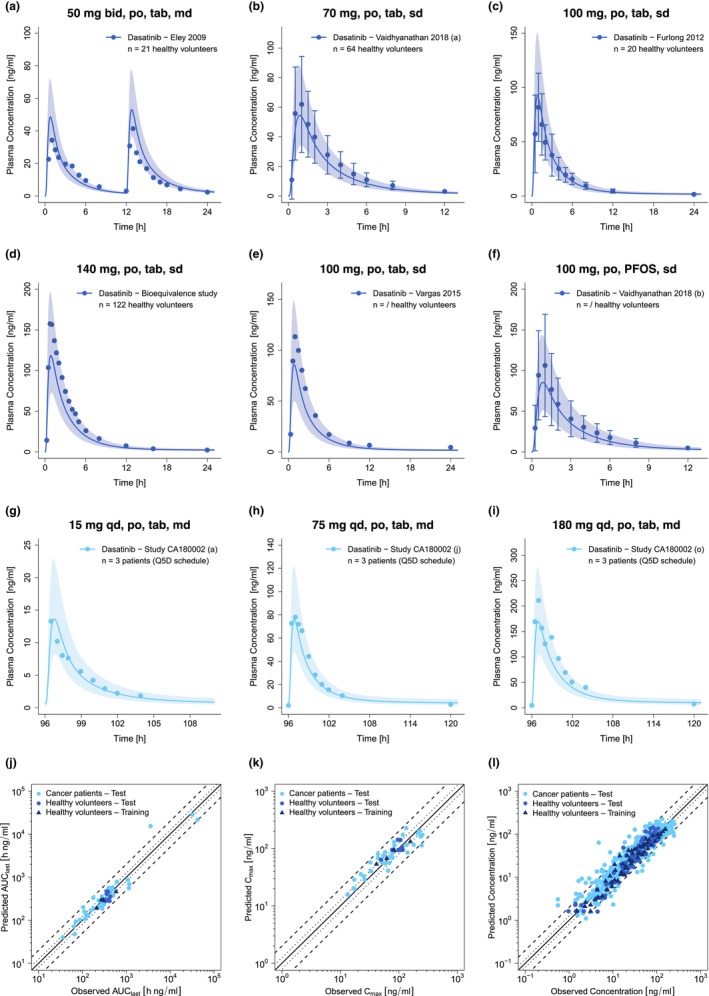
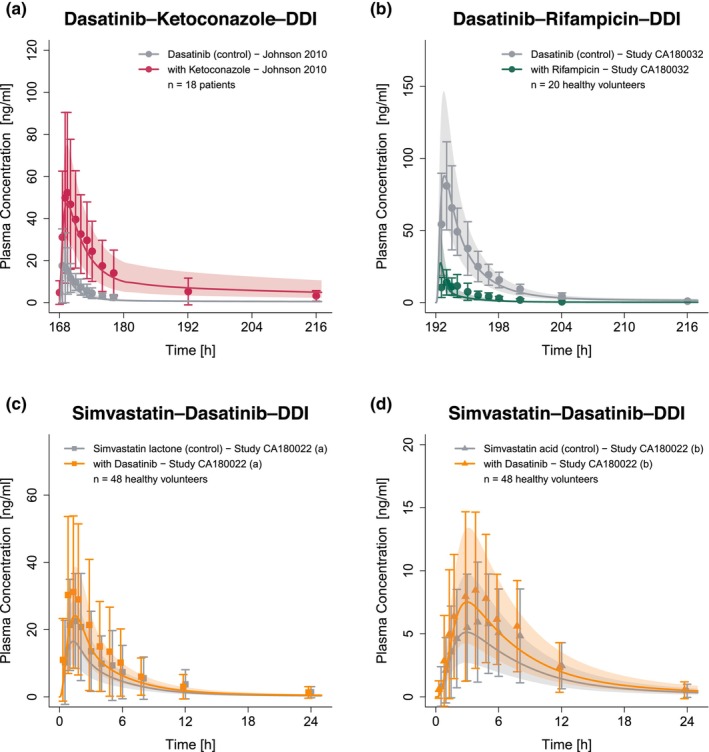
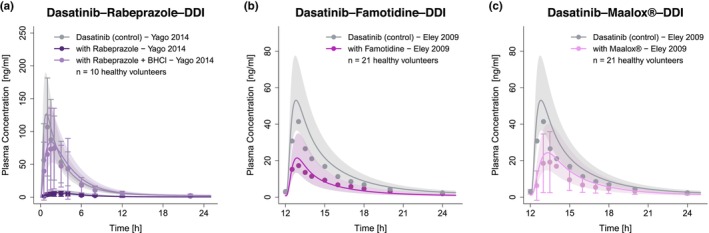
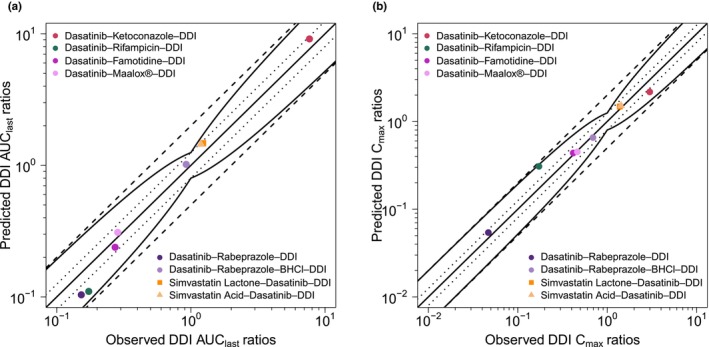
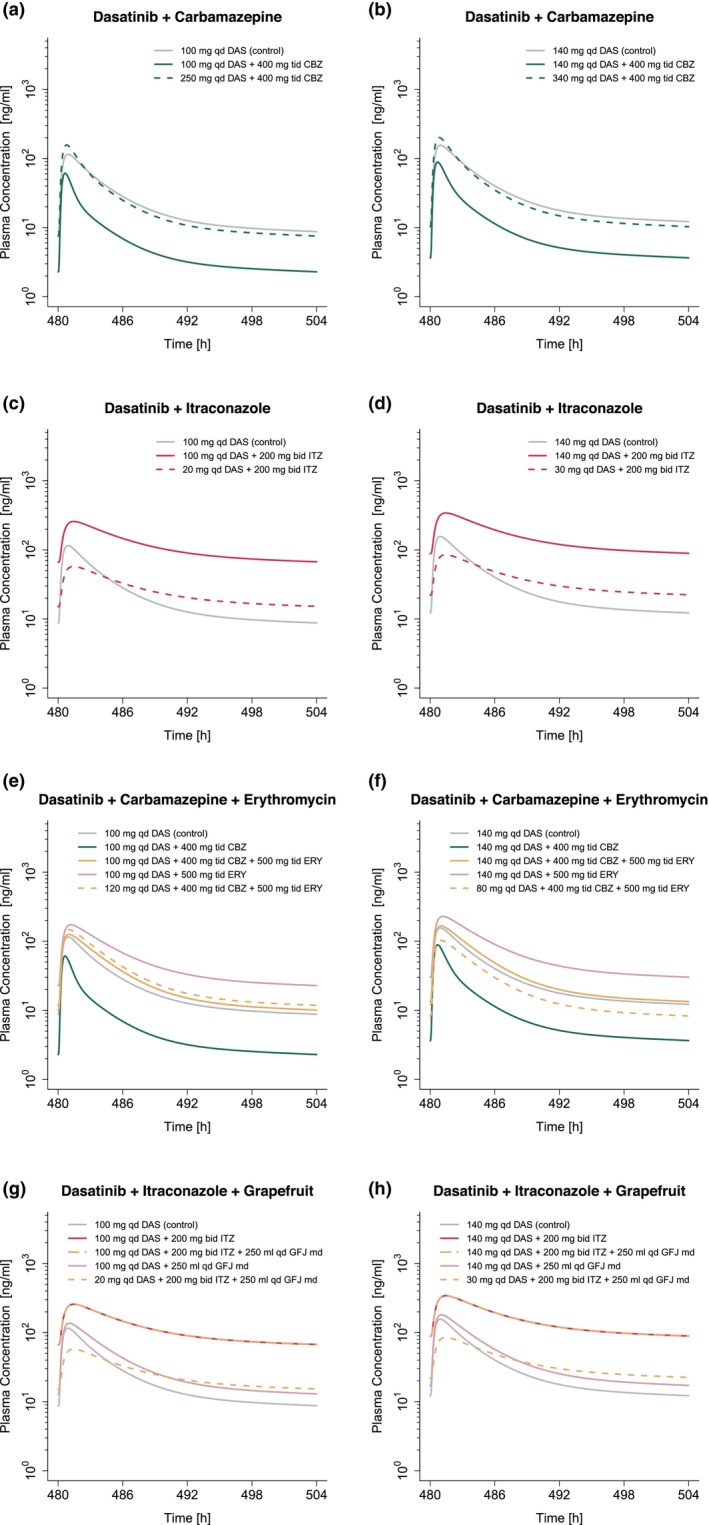
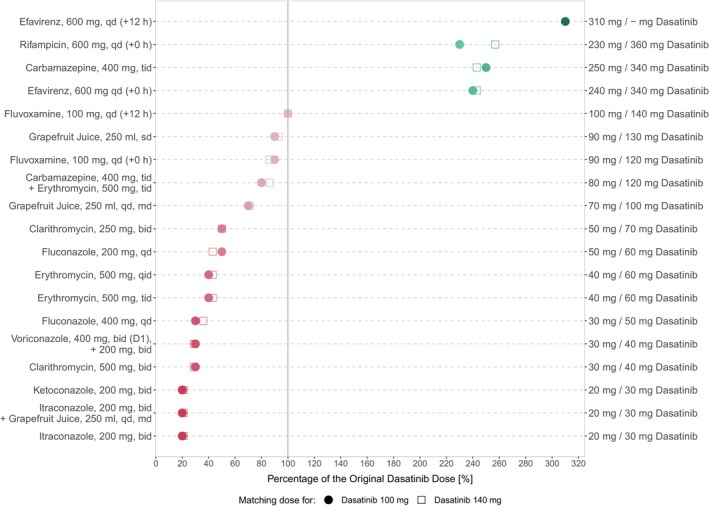
Dasatinib, a second-generation tyrosine kinase inhibitor, is approved for treating chronic myeloid and acute lymphoblastic leukemia. As a sensitive cytochrome P450 (CYP) 3A4 substrate and weak base with strong pH-sensitive solubility, dasatinib is susceptible to enzyme-mediated drug-drug interactions (DDIs) with CYP3A4 perpetrators and pH-dependent DDIs with acid-reducing agents. This work aimed to develop a whole-body physiologically-based pharmacokinetic (PBPK) model of dasatinib to describe and predict enzyme-mediated and pH-dependent DDIs, to evaluate the impact of strong and moderate CYP3A4 inhibitors and inducers on dasatinib exposure and to support optimized dasatinib dosing. Overall, 63 plasma profiles from perorally administered dasatinib in healthy volunteers and cancer patients were used for model development. The model accurately described and predicted plasma profiles with geometric mean fold errors (GMFEs) for area under the concentration-time curve from the first to the last timepoint of measurement (AUClast) and maximum plasma concentration (Cmax) of 1.27 and 1.29, respectively. Regarding the DDI studies used for model development, all (8/8) predicted AUClast and Cmax ratios were within twofold of observed ratios. Application of the PBPK model for dose adaptations within various DDIs revealed dasatinib dose reductions of 50%-80% for strong and 0%-70% for moderate CYP3A4 inhibitors and a 2.3-3.1-fold increase of the daily dasatinib dose for CYP3A4 inducers to match the exposure of dasatinib administered alone. The developed model can be further employed to personalize dasatinib therapy, thereby help coping with clinical challenges resulting from DDIs and patient-related factors, such as elevated gastric pH.
© 2024 The Authors. CPT: Pharmacometrics & Systems Pharmacology published by Wiley Periodicals LLC on behalf of American Society for Clinical Pharmacology and Therapeutics.
Conflict of interest statement
The authors declared no competing interests for this work.
Figures
Similar articles
-
Physiologically based pharmacokinetic modeling and simulation to predict drug-drug interactions of ivosidenib with CYP3A perpetrators in patients with acute myeloid leukemia.Cancer Chemother Pharmacol. 2020 Nov;86(5):619-632. doi: 10.1007/s00280-020-04148-3. Epub 2020 Sep 25. Cancer Chemother Pharmacol. 2020. PMID: 32978634
-
Evaluation of Cytochrome P450 3A4-Mediated Drug-Drug Interaction Potential for Cobimetinib Using Physiologically Based Pharmacokinetic Modeling and Simulation.Clin Pharmacokinet. 2016 Nov;55(11):1435-1445. doi: 10.1007/s40262-016-0412-5. Clin Pharmacokinet. 2016. PMID: 27225997
-
Physiologically Based Pharmacokinetic Modeling for Maribavir to Inform Dosing in Drug-Drug Interaction Scenarios with CYP3A4 Inducers and Inhibitors.J Clin Pharmacol. 2024 May;64(5):590-600. doi: 10.1002/jcph.2385. Epub 2023 Dec 14. J Clin Pharmacol. 2024. PMID: 38009271 Clinical Trial.
-
Physiologically based pharmacokinetic model to predict drug-drug interactions with the antibody-drug conjugate enfortumab vedotin.J Pharmacokinet Pharmacodyn. 2024 Oct;51(5):417-428. doi: 10.1007/s10928-023-09877-5. Epub 2023 Aug 26. J Pharmacokinet Pharmacodyn. 2024. PMID: 37632598 Free PMC article. Review.
-
Clinical Pharmacokinetics and Pharmacodynamics of Dasatinib.Clin Pharmacokinet. 2020 Jul;59(7):849-856. doi: 10.1007/s40262-020-00872-4. Clin Pharmacokinet. 2020. PMID: 32112275 Review.
Cited by
-
Severe Impact of Omeprazole Timing on pH-Sensitive Dasatinib Absorption: Unveiling Substantial Drug-Drug Interaction.J Clin Pharmacol. 2025 May;65(5):588-597. doi: 10.1002/jcph.6173. Epub 2024 Dec 26. J Clin Pharmacol. 2025. PMID: 39726232 Free PMC article.
-
Pulmonary arterial hypertension caused by coadministration of dasatinib and voriconazole: A case report and literature review.Medicine (Baltimore). 2025 Jul 18;104(29):e42927. doi: 10.1097/MD.0000000000042927. Medicine (Baltimore). 2025. PMID: 40696668 Free PMC article. Review.
References
-
- Amercian Cancer Society . Cancer facts and figures. Amercian Cancer Society website. https://www.cancer.org/cancer/chronic‐myeloid‐leukemia/about/statistics..... Accessed February 1, 2023.
-
- European Medicines Agency (EMA) . Annex I: summary of product characteristics (Sprycel). European Medicines Agency website. https://www.ema.europa.eu/en/documents/product‐information/sprycel‐epar‐.... Accessed January 18, 2023.
-
- Center for Drug Evaluation . Clinical pharmacology and biopharmaceutics review(s): NDA Review – Dasatinib. U.S. Food and Drug Administration website. https://www.accessdata.fda.gov/drugsatfda_docs/nda/2006/021986s000_Spryc.... Accessed August 04, 2022.
-
- Eley T, Luo FR, Agrawal S, et al. Phase I study of the effect of gastric acid pH modulators on the bioavailability of oral dasatinib in healthy subjects. J Clin Pharmacol. 2009;49:700‐709. - PubMed
MeSH terms
Substances
LinkOut - more resources
Full Text Sources
Medical
Research Materials
