. 2024 Jul 12;217(2):119-132.
doi: 10.1093/cei/uxae041.

Impact on in-depth immunophenotyping of delay to peripheral blood processing

Affiliations

Impact on in-depth immunophenotyping of delay to peripheral blood processing

Lauren E Higdon et al. Clin Exp Immunol. .

Abstract

Peripheral blood mononuclear cell (PBMC) immunophenotyping is crucial in tracking activation, disease state, and response to therapy in human subjects. Many studies require the shipping of blood from clinical sites to a laboratory for processing to PBMC, which can lead to delays that impact sample quality. We used an extensive cytometry by time-of-flight (CyTOF) immunophenotyping panel to analyze the impacts of delays to processing and distinct storage conditions on cell composition and quality of PBMC from seven adults across a range of ages, including two with rheumatoid arthritis. Two or more days of delay to processing resulted in extensive red blood cell contamination and increased variability of cell counts. While total memory and naïve B- and T-cell populations were maintained, 4-day delays reduced the frequencies of monocytes. Variation across all immune subsets increased with delays of up to 7 days in processing. Unbiased clustering analysis to define more granular subsets confirmed changes in PBMC composition, including decreases of classical and non-classical monocytes, basophils, plasmacytoid dendritic cells, and follicular helper T cells, with each subset impacted at a distinct time of delay. Expression of activation markers and chemokine receptors changed by Day 2, with differential impacts across subsets and markers. Our data support existing recommendations to process PBMC within 36 h of collection but provide guidance on appropriate immunophenotyping experiments with longer delays.

Keywords: CyTOF; delayed processing; immunophenotyping; monocytes; peripheral blood mononuclear cells.


Conflict of interest statement

The authors have no conflicts of interest to disclose.

Figures

Graphical Abstract
Graphical Abstract
Figure 1.
Figure 1.
Delays to PBMC processing impact Ficoll separation and recovery of viable cells. (A) Whole blood was collected from five HA and two RA patients into a mix of Hep and K-EDTA tubes. (B) Blood was stored in collection tubes for an indicated number of days in ambient shipping containers, ambient on a rocker, or in a 4°C refrigerator. PBMC were isolated using a Ficoll gradient after the storage period. (C) Representative photos of HA Ficoll gradients with processing at Days 0–3. Storage condition is indicated below the images. (D) Representative photos of HA and RA Ficoll gradients at Days 5 and 7. (E and F) Cells were counted after the completion of Ficoll gradients. (E) Counts without RBC lysis in each storage condition out to Day 3. (F) Total number of viable cells prior to cryopreservation from the heparin ambient condition with or without RBC lysis. (G and H) Upon thaw, cells were treated with DNase and RBC lysis prior to counting. (G) % of cryopreserved cells recovered upon thaw relative to counts with RBC lysis at cryopreservation. (H) % viable of cells after thaw. (F–H) Points depict the mean and error bars depict the standard deviation
CyTOF data showing impact on immune cell types over time and across conditions.
Figure 2.
Monocytes are most impacted by delays in processing. (A) Thawed samples were analyzed by mass cytometry and gated for live singlets as indicated. (B) Granulocytes, (C) myeloid cells, and (D) other leukocyte subsets were analyzed over time in HA and RA subjects in Heparin room temperature samples. Each individual subject is represented with a distinct symbol, as indicated in the figure. (E) Non-granulocyte gated cells (CD66b−) were analyzed for each condition at Days 0, 2, and 3 for frequencies represented by each population. Other cells = all cells that do not fall into the gated populations. This includes some subsets of non-classical monocytes and DCs, double-positive T cells, innate lymphoid cells, and cell–cell conjugates
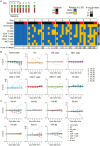
Change from baseline for each subject and population.
Figure 3.
Variability of immune population frequencies increases by Day 2. For heparin samples stored in ambient conditions, baseline mean, and standard deviation for each population frequency from Fig. 2A for each subject were calculated using Days 0–1. (A) Heatmap depicts populations with frequencies within and outside two standard deviations from the mean as indicated in the key for the figure. Grayscale bars depict number of populations out of range within subject/day (bottom) and within population (right). (B and C) Number of standard deviations from the mean at baseline (Z-score) calculated for each HA and RA subject and population at each time point depicted for (B) each population and (C) each subject. Points are connected by lines within (B) subject or (C) population. Dotted line indicates 0, and shaded box indicates the range of 2 SDs from 0. Each subject is indicated with a distinct symbol
Change over time in myeloid subsets.
Figure 4.
Both classical and non-classical monocytes are decreased with delays in processing. (A) CD66b−CD3−CD19− cells gated as shown in Fig. 2A were clustered using DISCOV-R based on the listed parameters (Supplementary Figure S1A and SB), with the clusters projected onto a UMAP. Population names were determined based on protein expression patterns. The frequency of each cluster over the time course in Heparin ambient storage samples from barcode set 1 was analyzed for (B) monocytes, (C) basophils, (D) dendritic cell subsets, and (E) NK cell subsets. Each HA and RA subject is indicated with a distinct symbol. Statistics displayed on graphs computed using simple linear regression. Statistics computed between time points (in text) with Friedman test with Dunn’s multiple comparisons test. * = P < 0.05, ** = P < 0.01,**** = P < 0.0001
Change over time in B cell subsets.
Figure 5.
Plasmablast and memory B cell subsets shift with delays to processing. (A) CD66b-CD3-CD19 + B cells gated as shown in Fig. 2A were clustered using DISCOV-R based on the listed parameters (Supplementary Figure S1C and D), and clusters were projected onto a UMAP. Population names were determined based on protein expression patterns. The frequency of each cluster over the time course in Heparin ambient storage samples from barcode set 1 was analyzed for (B) naïve B cells, memory B cells, plasmablasts, and age-associated B cells (ABCs). Each HA and RA subject is indicated with a distinct symbol. Statistics displayed on graphs computed using simple linear regression. Statistics computed between time points (in text) with Friedman test with Dunn’s multiple comparisons test. * = P < 0.05, ** = P < 0.01
Change over time in T cell subsets.
Figure 6.
Tfh cells were depleted by delays to processing, while Th17 cells were preferentially preserved. (A) CD66b−CD3+ CD19− T cells gated as shown in Fig. 2A were clustered using DISCOV-R (Supplementary Figure S1E and S1F) and clusters were projected onto a UMAP. Population names were determined based on protein expression patterns. The frequency of each cluster over the time course in Heparin room temperature samples from barcode set 1 was analyzed for (B) innate-like T-cell subsets, (C) MAIT cells, (D) CD8 T-cell subsets, (E) CD4 T-cell subsets, and (F) CD4 memory T cells. (G) CD4 memory cluster from Fig. 6A was exported and DISCOV-R clustering was run on this subset based on the Th lineage-defining markers CCR4, CCR5, CXCR3, and CXCR5. Population names were determined based on protein expression patterns. Frequency of each Th cluster over the time course analyzed. Each HA and RA subject is indicated with a distinct symbol. Statistics displayed on graphs computed using simple linear regression. Statistics computed between time points (in text) with Friedman test with Dunn’s multiple comparisons test. ** = P < 0.01
Figure 7.
Figure 7.
Expression of activation and other markers was altered by two or more days of delay to processing. DISCOV-R clusters for non-naïve (not CCR7+ CD45RA+) CD4 and CD8 T cells, Treg, B cells, cDC, monocytes, and NK cells were analyzed for the median intensity of expression of (A) proteins known to change with activation and (B) other proteins including chemokine receptors in Heparin ambient storage samples from barcode set 1. Intensities were normalized to the intensity at Day 0 and plotted in log2 scale. Proteins analyzed were (A) HLA-DR, CD38, CD95, ICOS, PD1, TIGIT, CD25, and CD27, (B) CCR4, CCR6, CCR7, CXCR3, CXCR5, Ki67, CD56, and CD2. Shaded boxes highlight Days 3–7 after the draw. Statistics were computed using simple linear regression (for each subset). Statistics computed between time points with Friedman test with Dunn’s multiple comparisons test. All statistics are shown in the text only
Figure 8.
Figure 8.
Decision tree for use of samples with delayed processing. Based on the results of this study, this decision tree provides guidelines on how to determine whether samples with 2–7 days delay in processing are appropriate for use in specific experiments. Color coding of boxes and arrows demonstrates recommendations for use. Samples processed within 2 days are appropriate for use in an immune profiling study. For samples processed 2-3 days after collection, further validation is recommended. Samples processed 4 or more days after collection are not recommended for use

References

    1. Higdon LE, Lee K, Tang Q, Maltzman JS.. Virtual global transplant laboratory standard operating procedures for blood collection, PBMC isolation, and storage. Transplant Direct 2016, 2, e101. doi:10.1097/TXD.0000000000000613 - DOI - PMC - PubMed
    1. Fuss IJ, Kanof ME, Smith PD, Zola H.. Isolation of whole mononuclear cells from peripheral blood and cord blood. Curr Protoc Immunol 2009, Chapter 7, 7.1.1–8. doi:10.1002/0471142735.im0701s85 - DOI - PubMed
    1. Yi PC, Zhuo L, Lin J, Chang C, Goddard A, Yoon OK.. Impact of delayed PBMC processing on functional and genomic assays. J Immunol Methods 2023, 519, 113514. doi:10.1016/j.jim.2023.113514 - DOI - PubMed
    1. Thyagarajan B, Barcelo H, Crimmins E, Weir D, Minnerath S, Vivek S, et al.. Effect of delayed cell processing and cryopreservation on immunophenotyping in multicenter population studies. J Immunol Methods 2018, 463, 61–70. doi:10.1016/j.jim.2018.09.007 - DOI - PMC - PubMed
    1. Scheible K, Secor-Socha S, Wightman T, Wang H, Mariani TJ, Topham DJ, et al.. Stability of T cell phenotype and functional assays following heparinized umbilical cord blood collection. Cytometry A 2012, 81, 937–49. doi:10.1002/cyto.a.22203 - DOI - PMC - PubMed