. 2024 May;28(9):e18342.
doi: 10.1111/jcmm.18342.

New synergistic combination therapy approaches with HDAC inhibitor quisinostat, cisplatin or PARP inhibitor talazoparib for urothelial carcinoma

Affiliations

New synergistic combination therapy approaches with HDAC inhibitor quisinostat, cisplatin or PARP inhibitor talazoparib for urothelial carcinoma

Sarah Meneceur et al. J Cell Mol Med. 2024 May.

Abstract

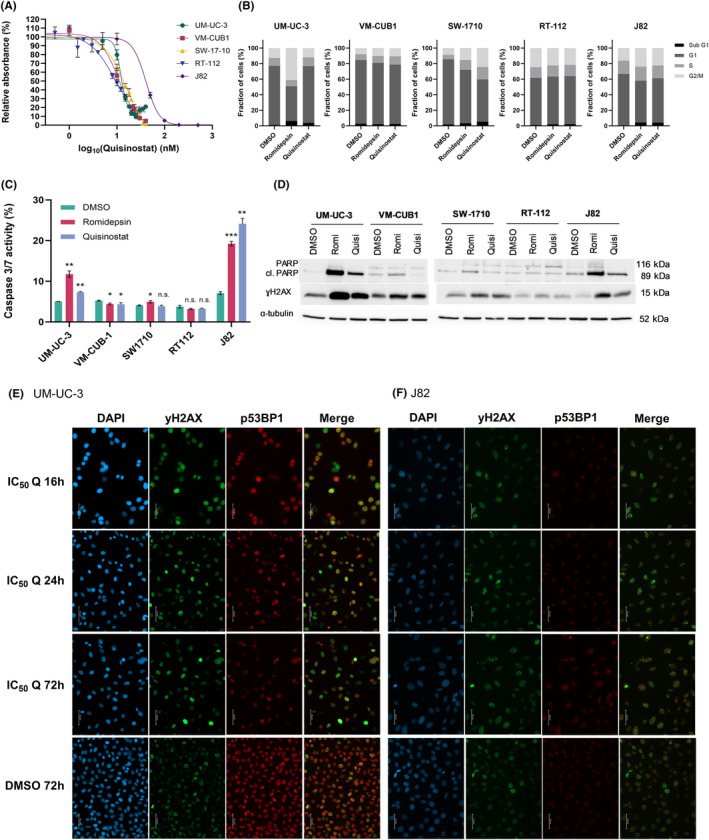
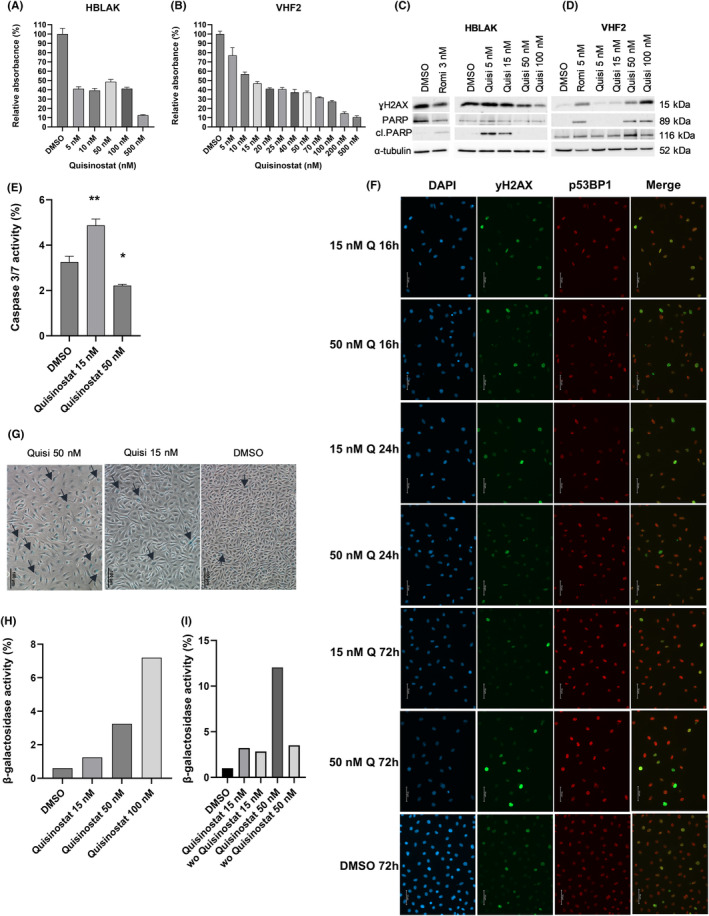
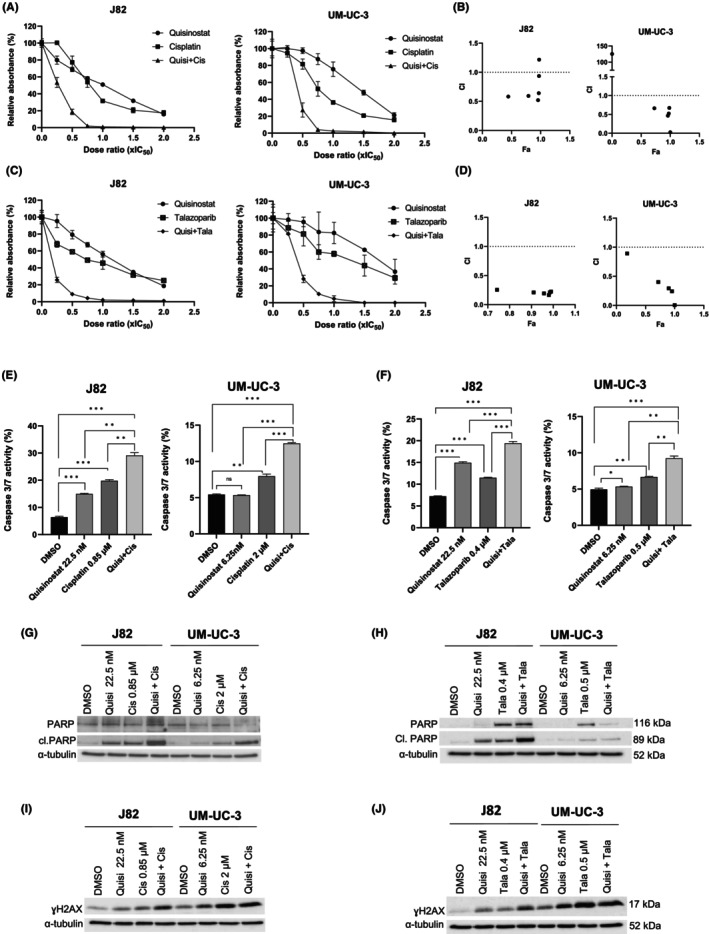
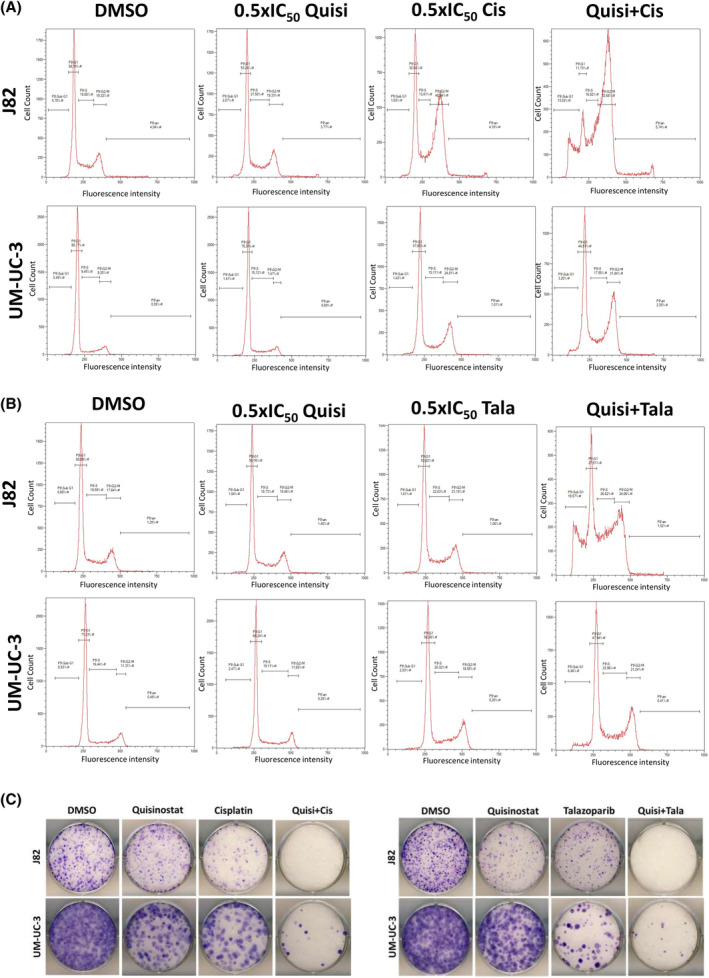
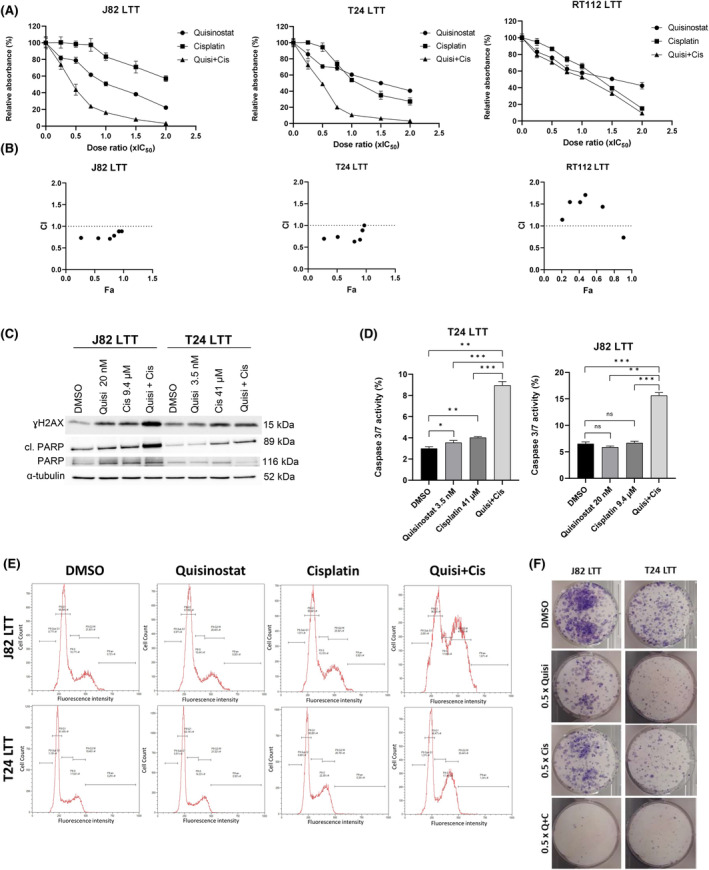
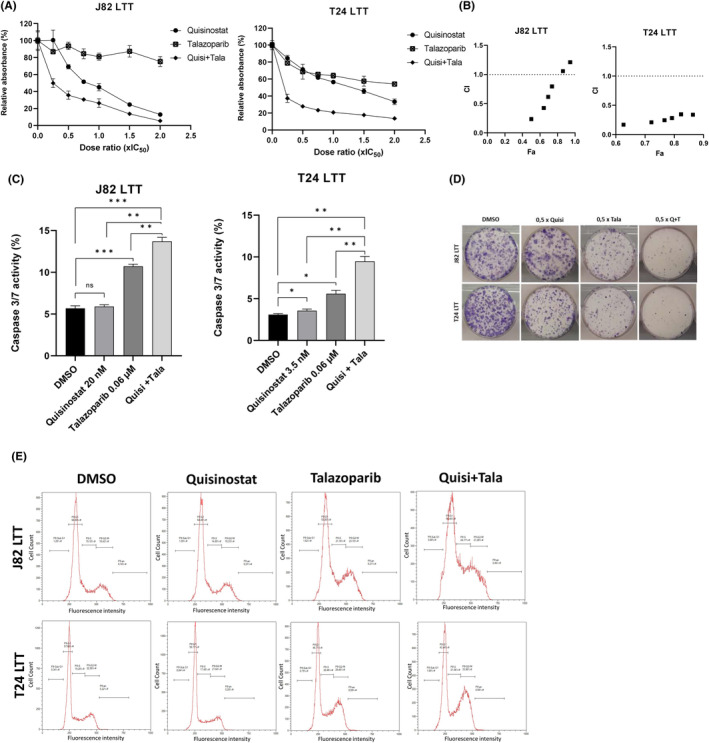
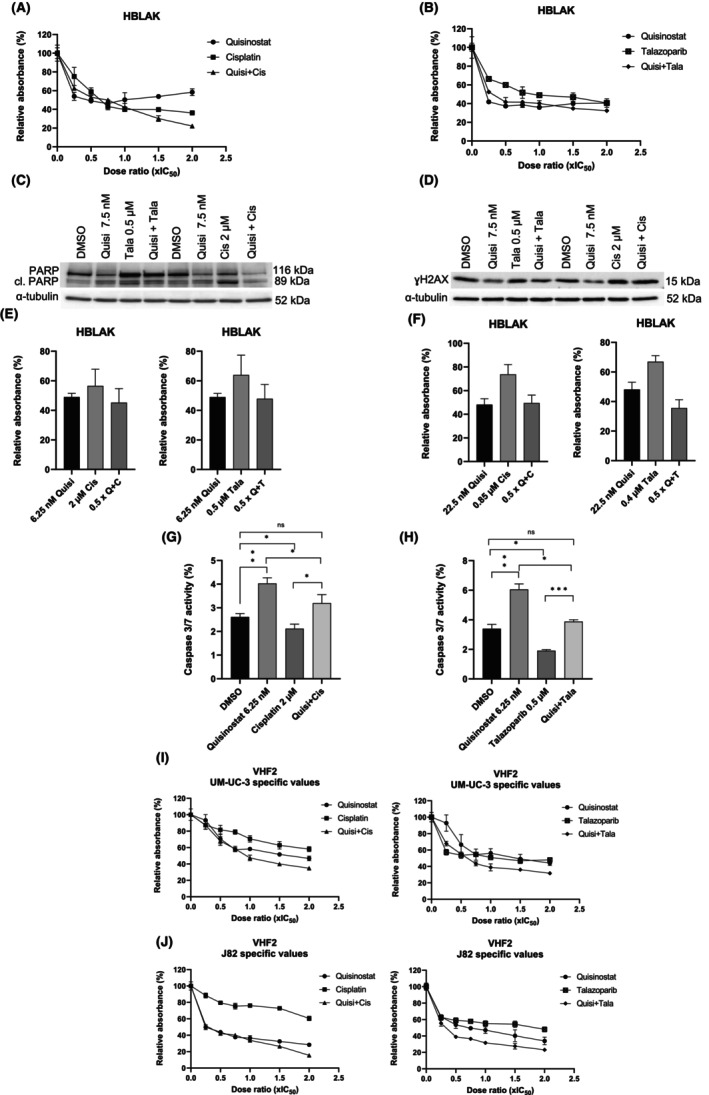
Urothelial carcinoma (UC) urgently requires new therapeutic options. Histone deacetylases (HDAC) are frequently dysregulated in UC and constitute interesting targets for the development of alternative therapy options. Thus, we investigated the effect of the second generation HDAC inhibitor (HDACi) quisinostat in five UC cell lines (UCC) and two normal control cell lines in comparison to romidepsin, a well characterized HDACi which was previously shown to induce cell death and cell cycle arrest. In UCC, quisinostat led to cell cycle alterations, cell death induction and DNA damage, but was well tolerated by normal cells. Combinations of quisinostat with cisplatin or the PARP inhibitor talazoparib led to decrease in cell viability and significant synergistic effect in five UCCs and platinum-resistant sublines allowing dose reduction. Further analyses in UM-UC-3 and J82 at low dose ratio revealed that the mechanisms included cell cycle disturbance, apoptosis induction and DNA damage. These combinations appeared to be well tolerated in normal cells. In conclusion, our results suggest new promising combination regimes for treatment of UC, also in the cisplatin-resistant setting.

Keywords: HDACi; bladder cancer; cisplatin; quisinostat; talazoparib.


Conflict of interest statement

The authors declare no conflict of interest. The funders had no role in the design of the study; in the collection, analyses, or interpretation of data; in the writing of the manuscript, or in the decision to publish the results.

Figures

FIGURE 1
FIGURE 1
Quisinostat affects cell viability of UCC at low doses and has cell line dependent effects on DNA damage, cell death and cell cycle. (A) Non‐linear regression curves for determination of the IC50 values for quisinostat in UM‐UC‐3, VMCUB‐1, SW‐1710, RT‐112 and J82. Absorbance values for metabolic activity (MTT) relative to DMSO control (%) was calculated as surrogate for cell viability 72 h post‐treatment. (B) Bar graphs presenting the cell cycle distribution 72 h post‐treatment with HDACi romidepsin and quisinostat at IC50 values. Results of a representative experiment are shown, n = 3. (C) Caspase 3/7 activity in 5 UCCs 72 h post‐treatment with HDACi romidepsin and quisinostat at IC50 values. The results were normalized to the amount of viable cells measured with CellTiterGlo and are presented as percentage ±SD (standard deviation). p‐values are indicated as follows: *p < 0.05; **p < 0.005; ***p < 0.0005; n.s., non‐significant; n = 3. (D) Western blots showing the apoptopic marker cleaved PARP, total PARP and ɣH2AX following treatment with romidepsin and quisinostat after 72 h in 5 UCCs. α‐tubulin was used as loading control. The respective IC50 of the cell lines were used. Romi, romidepsin; Quisi, quisinostat. (E, F) Immunocytochemistry stainings of ɣH2AX (green fluorescence), p53BP1 (red fluorescence) and DAPI (blue fluorescence) or channel overlay (merge). Cells were treated with cell line dependent IC50 dosages of quisinostat (Q) (E, UM‐UC‐3 12.5 nM; F, J82 45 nM) and stained after 16, 24 and 72 h compared to DMSO. Images were taken with 25× objective, scale bar indicates 50 μm.
FIGURE 2
FIGURE 2
Normal cells tolerate high dosage of quisinostat and acquire a revertiblesenescence‐like phenotype. Bar graphs presenting metabolic activity as a surrogate for cell viability normalized to DMSO as relative absorbance (%) with increasing doses of quisinostat in the normal cells HBLAK (A) and fibroblasts VHF2 (B) 72 h post‐treatment. Western blots of the DNA double strand break marker ɣH2AX, the apoptopic marker cleaved PARP and total PARP with increasing doses of quisinostat in HBLAK (C) and VHF2 (D) 72 h post‐treatment, romidepsin was used for comparison. α‐tubulin was used as loading control. (E) Caspase 3/7 activity in HBLAK 72 h post‐treatment with quisinostat. The results were normalized to the amount of viable cells measured with CellTiterGlo and are presented as percentage ±SD (standard deviation). p‐values are indicated as follows: *p < 0.05; **p < 0.005; ***p < 0.0005; n.s., non‐significant; n = 3. (F) Immunocytochemistry stainings of ɣH2AX (green fluorescence), p53BP1 (red fluorescence) and DAPI (blue fluorescence) or channel overlay (merge). HBLAK cells were treated with either 15, 50 nM quisinostat (Q) or DMSO and stained after 16, 24 and 72 h. Images were taken with 25× objective, scale bar indicates 50 μm. (G) β‐galactosidase activity visualized with X‐gal staining 72 h after treatment with 15 and 50 nM quisinostat in HBLAK (scale bar 100 μm). (H) β‐galactosidase activity measured by FACS in HBLAK 72 h after treatment, n = 3. (I) β‐galactosidase activity measured by FACS in HBLAK 72 h after treatment compared to wash out (wo) after 24 h and measurement after 72 h, n = 3.
FIGURE 3
FIGURE 3
Quisinostat synergises with the DNA damage agent cisplatin and the PARP inhibitor talazoparib in UM‐UC‐3 and J82. (A, C) MTT assay curves of the single and combined treatments with cisplatin and talazoparib 72 h post‐treatment (± standard deviation SD), n = 4; (B, D) Chou Talalay analysis of the combinations quisinostat/cisplatin (C) and quisinostat/talazoparib (D), CI, Combination Index, Fa, Fraction affected, CI = 1: additive effect; CI >1: antagonistic effect; CI <1 synergistic effect. (E, F) Caspase 3/7 activity assay of the combined treatments at low dose ratios in J82 and UM‐UC‐3 72 h post‐treatment. The results were normalized to the amount of viable cells measured with CellTiterGlo and are presented as percentage ±SD (standard deviation). p‐values are indicated as follows: *p < 0.05; **p < 0.005; ***p < 0.0005; n.s. non‐significant; n = 3. Quisi, quisinostat; Cis, cisplatin; Tala, talazoparib; IC50, Inhibitory concentration 50; CI, combination index; Fa, fraction affected. (G, H) Western blots showing the apoptopic marker cleaved PARP (cl. PARP) and total PARP in UM‐UC‐3 and J82 treated with IC25 (0.5 × IC50) dosage of quisinostat, cisplatin, talazoparib, and combined treatment after 72 h. α‐tubulin was used as loading control. (I, J) Western blots showing the DNA damage marker γH2AX in UM‐UC‐3 and J82 treated with IC25 (0.5 × IC50) dosage of quisinostat, cisplatin, talazoparib, and combined treatment after 72 h. α‐tubulin was used as loading control.
FIGURE 4
FIGURE 4
Combinations of quisinostat and cisplatin or talazoparib disrupt the cell cycle in UM‐UC3 and J82 at reduced dosage and affect long‐term proliferation. (A, B) Histograms showing the cell cycle distribution in UM‐UC‐3 and J82 following treatment with cell line‐specific IC25 dosage of quisinostat, cisplatin, talazoparib as single agents and combined treatment after 72 h, DMSO was used as control. Results of a representative experiment are shown, n = 3. Quisi, quisinostat; Cis, cisplatin; Tala, talazoparib; IC50, Inhibitory concentration 50. (C) Giemsa staining of the colony formation assay in UM‐UC‐3 and J82, after 72 h treatment with cell line‐specific IC25 dosage of quisinostat, cisplatin, talazoparib as single agents and as combined treatment, DMSO was used as control. Results of a representative experiment are shown, n = 3.
FIGURE 5
FIGURE 5
Quisinostat synergises with cisplatin in cells resistant to cisplatin. (A) MTT assays curves of the single and combined treatments with cisplatin and talazoparib 72 h post‐treatment (± standard deviation SD) in J82 LTT, T24 LTT, RT‐112 LTT (LTT, long term treated), n = 4; (B) Chou Talalay analysis of the combinations quisinostat/cisplatin, CI, combination index, Fa, fraction affected; CI = 1: additive effect; CI >1: antagonistic effect; CI <1: synergistic effect. (C) Western blots showing the apoptopic marker cleaved PARP (cl. PARP), total PARP and ɣH2AX in J82 LTT and T24 LTT treated with IC25 dosage of quisinostat (Quisi), cisplatin (Cis), and combined treatment (Quisi + Cis) after 72 h. α‐tubulin was used as loading control. (D) Caspase 3/7 activity assay in J82 LTT and T24 LTT upon treatment with 0.5 IC50 values of quisinostat (Quisi), cisplatin (Cis), and combined treatment (Quisi + Cis) after 72 h. The results were normalized to the amount of viable cells measured with CellTiterGlo and are presented as percentage ±SD (standard deviation). p‐values are indicated as follows: *p < 0.05; **p < 0.005; ***p < 0.0005; n.s., non‐significant; n = 3. (E) Histograms showing the cell cycle distribution of J82 LTT and T24 LTT following after 72 h treatment with cell line‐specific IC25 dosage of quisinostat, cisplatin, talazoparib as single agents and as combined treatment, DMSO was used as control. Results of a representative experiment are shown. (F) Giemsa staining of the colony formation assay in J82 LTT and T24 LTT, after treatment with cell line‐specific IC25 dosage of quisinostat (Quisi), cisplatin (Cis), as single agents and as combined treatment, DMSO was used as control. Results of a representative experiment are shown.
FIGURE 6
FIGURE 6
Quisinostat sensitizes J82 LTT and T24 LTT to the PARP inhibitor talazoparib. (A) MTT assays curves representing cell viability of the single and combined treatments with talazoparib 72 h post‐treatment in J82LTT and T24LTT (±Standard deviation SD); n = 4; (B) Chou Talalay analysis of the combinations quisinostat/talazoparib CI, combination index, Fa, fraction affected; CI = 1: additive effect; CI >1: antagonistic effect; CI <1: synergistic effect; (C) Caspase 3/7 activity assay in J82 LTT and T24 LTT upon treatment with quisinostat (IC25), 0.06 μM talazoparib, the combination of quisinostat and talazoparib. p‐values of t‐test results are indicated as follow: *p < 0.05; **p < 0.005; ***p < 0.0005; n.s., non‐significant; n = 3. (D) Giemsa staining of the colony formation assay for J82 LTT and T24 LTT, after treatment with cell line‐specific IC25 dosage of quisinostat (Quisi), talazoparib (Tala), as single agents and as combined treatment, DMSO was used as control. Results of a representative experiment are shown. (E) Histograms showing the cell cycle distribution of J82 LTT and T24 LTT following a 72 h treatment with cell line‐specific IC25 dosage of quisinostat, talazoparib as single agents and as combined treatment (Quisi + Tala), DMSO was used as control. Results of a representative experiment are shown.
FIGURE 7
FIGURE 7
Effects of the combinations in normal cell lines. (A, B) MTT assays curves as a surrogate for cell viability of the single and combined treatments with cisplatin and talazoparib 72 h post‐treatment in HBLAK (± standard deviation SD) with HBLAK specific values (IC50 used for: quisinostat 15 nM, cisplatin 4 μM, talazoparib 1 μM); n = 4. (C) Western blots showing the apoptotic marker cleaved PARP and total PARP in HBLAK treated with IC25 dosage of quisinostat, cisplatin, talazoparib, and combined treatment after 72 h. α‐tubulin was used as loading control. (D) Western blots for ɣH2AX in HBLAK treated with IC25 dosage of quisinostat, cisplatin, talazoparib, and combined treatment after 72 h. α‐tubulin was used as loading control. The respective IC50 of the cell lines were used. Romi: romidepsin; Quisi: quisinostat. (E) Bar graph presenting the cell viability of HBLAK as relative absorbance (%) upon 72 h treatment (Quisi, quisinostat; Cis, cisplatin; Q + C, quisinostat + cisplatin) with 0.5 × IC50 values specific to UM‐UC‐3. (F) Bar graph presenting metabolic activity as a surrogate for cell viability of HBLAK as relative absorbance (%) upon 72 h treatment (Quisi, quisinostat; Cis, cisplatin; Q + C: quisinostat+cisplatin) with 0.5 × IC50 values specific to J82; n = 4. (G) Caspase 3/7 activity assay in HBLAK upon 72 h treatment with 6.25 nM quisinostat, 2 μM cisplatin and the combination of quisinostat and cisplatin. (H) Caspase 3/7 activity assay in HBLAK upon treatment with 6.25 nM quisinostat, 0.5 μM talazoparib, the combination of quisinostat and talazoparib. p‐values of t‐test results are indicated as follows: *p < 0.05; **p < 0.005; ***p < 0.0005; n.s., non‐significant; n = 3. (I, J) MTT assay curves of the single and combined treatments with cisplatin and talazoparib in VHF2 72 h post‐treatment with UM‐UC‐3 specific values (I) and J82 specific values (J); n = 4.

Similar articles

References

    1. Miyazaki J, Nishiyama H. Epidemiology of urothelial carcinoma. Int J Urol. 2017;24(10):730‐734. doi:10.1111/iju.13376 - DOI - PubMed
    1. Ferlay J, Colombet M, Soerjomataram I, et al. Cancer incidence and mortality patterns in Europe: estimates for 40 countries and 25 major cancers in 2018. Eur J Cancer. 2018;103:356‐387. doi:10.1016/j.ejca.2018.07.005 - DOI - PubMed
    1. Li HT, Duymich CE, Weisenberger DJ, Liang G. Genetic and epigenetic alterations in bladder cancer. Int Neurourol J. 2016;20(Suppl 2):S84‐S94. doi:10.5213/inj.1632752.376 - DOI - PMC - PubMed
    1. Lopez‐Beltran A, Cimadamore A, Blanca A, et al. Immune checkpoint inhibitors for the treatment of bladder cancer. Cancers (Basel). 2021;13(1):131. doi:10.3390/cancers13010131 - DOI - PMC - PubMed
    1. Kim JH, Chang IH. A novel strategy for treatment of bladder cancer: antibody‐drug conjugates. Investig Clin Urol. 2022;63(4):373‐384. doi:10.4111/icu.20220061 - DOI - PMC - PubMed

Publication types

MeSH terms