. 2024 Jun 1;41(6):msae085.
doi: 10.1093/molbev/msae085.

Non-Poissonian Bursts in the Arrival of Phenotypic Variation Can Strongly Affect the Dynamics of Adaptation

Affiliations

Non-Poissonian Bursts in the Arrival of Phenotypic Variation Can Strongly Affect the Dynamics of Adaptation

Nora S Martin et al. Mol Biol Evol. .

Abstract

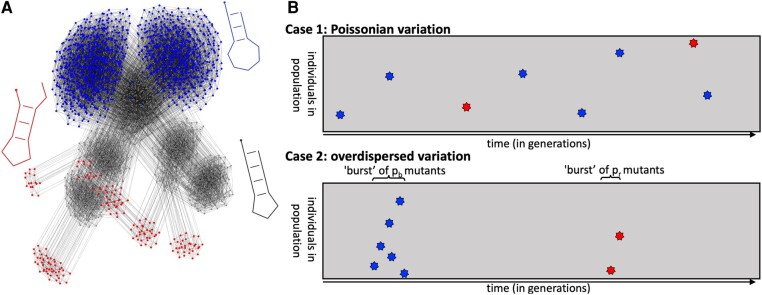
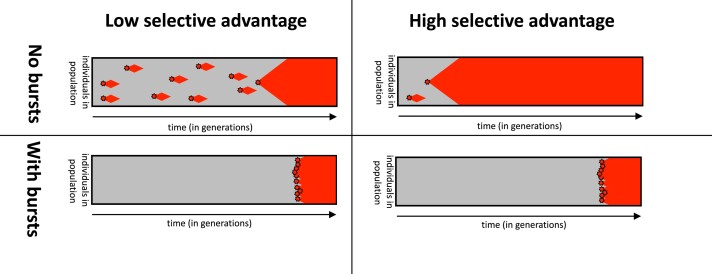
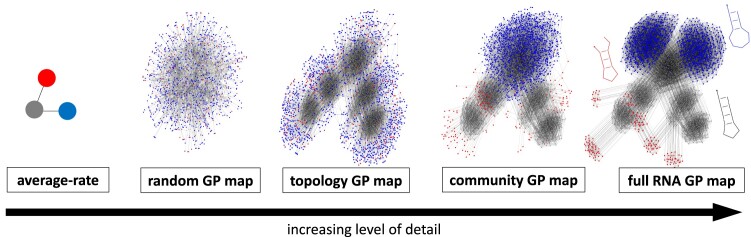
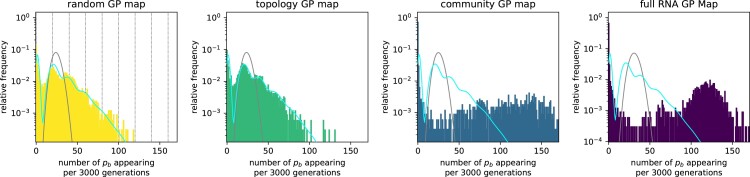
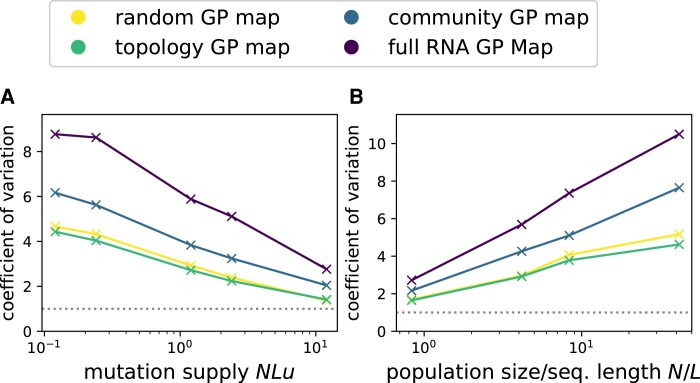
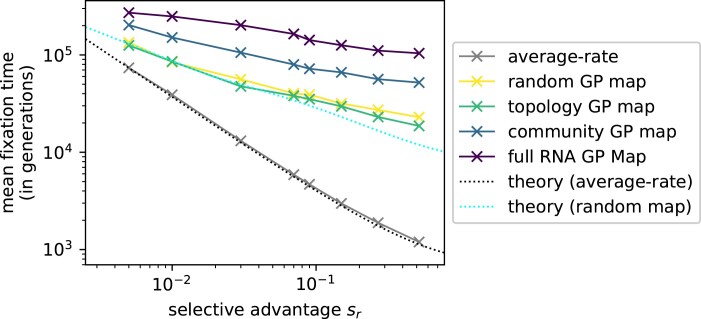
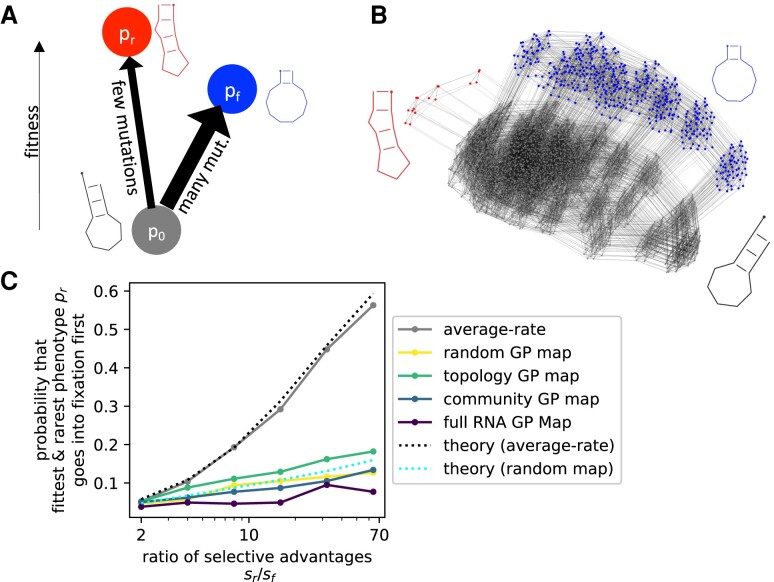
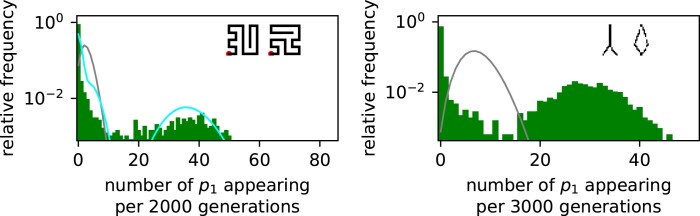
Modeling the rate at which adaptive phenotypes appear in a population is a key to predicting evolutionary processes. Given random mutations, should this rate be modeled by a simple Poisson process, or is a more complex dynamics needed? Here we use analytic calculations and simulations of evolving populations on explicit genotype-phenotype maps to show that the introduction of novel phenotypes can be "bursty" or overdispersed. In other words, a novel phenotype either appears multiple times in quick succession or not at all for many generations. These bursts are fundamentally caused by statistical fluctuations and other structure in the map from genotypes to phenotypes. Their strength depends on population parameters, being highest for "monomorphic" populations with low mutation rates. They can also be enhanced by additional inhomogeneities in the mapping from genotypes to phenotypes. We mainly investigate the effect of bursts using the well-studied genotype-phenotype map for RNA secondary structure, but find similar behavior in a lattice protein model and in Richard Dawkins's biomorphs model of morphological development. Bursts can profoundly affect adaptive dynamics. Most notably, they imply that fitness differences play a smaller role in determining which phenotype fixes than would be the case for a Poisson process without bursts.

Keywords: evolution; genotype–phenotype map; population genetics.


Conflict of interest statement

Conflict of interest statement None declared.

Figures

Fig. 1.
Fig. 1.
Structure in the mapping from genotypes to phenotypes can induce non-Poissonian bursts in the introduction of novel variation. a) Genotypes of sequence length L=12nt mapping to three selected RNA secondary structure phenotypes (shown in gray, red, and blue) are drawn as a mutational network. Each genotype is a network node and each gray edge between two genotypes means that these two genotypes are only one point mutation apart. A full NC of 1,094 genotypes (nodes) is shown for the gray phenotype (specifically the NC containing the sequence AUACGAAACGUA), while only those nodes connected to the gray NC are shown for the red and blue phenotypes. This network is heterogeneous in several ways (see Schaper and Louis 2014; Greenbury 2014; Capitan et al. 2015; Weiß and Ahnert 2020; Greenbury et al. 2016; McCandlish 2012): first, not all gray genotypes are portal genotypes for red and blue, i.e. genotypes with mutational connections to red or blue phenotypes. Second, the gray NC has a community structure where the nodes form several densely connected clusters. Third, the portal genotypes to the red or blue phenotype are concentrated on a few regions of the gray network, i.e. transitions to blue or red are very likely from some gray genotypes and their mutational neighbors, but impossible otherwise. b) Idealized schematic of individuals in the population (y-axis) vs. time (x-axis). The population starts on the gray phenotype and moves through the gray NC by neutral mutations. Other novel phenotypes can appear through random mutations, but in this simplified case of strong stabilizing selection, the novel phenotypes only appear for one generation. Here only two novel phenotypes, blue and red, are depicted, with blue appearing at a larger rate than red. Case 1 depicts the classical picture with Poisson statistics, whereas case 2 illustrates “bursty/overdispersed variation” due to the heterogeneous structure in the GP map. Both cases have the same average rates of introduction. Note that each color stands for one phenotype, but in this many-to-one mapping, this does not imply that they have the same genotype. This and the fact that we focus on burstiness in the newly introduced phenotypes, not in the times that phenotypes are fixed in the population, are differences from the overdispersion of the molecular clock in neutral evolution.
Fig. 2.
Fig. 2.
Idealized schematic—the effect of bursts on the time to fixation: in the non-bursty case (first row), the red phenotype pr, which is fitter than the initial gray phenotype, appears at intervals that are described by a Poisson process. The fixation time depends strongly on how many appearances of pr are required for its fixation, which in turn depends strongly on its selection coefficient spr. In the overdispersed case (second row), there are time intervals where pr does not appear at all for many generations and intervals when the population resides at a portal genotype, and pr is produced many times in quick succession. When pr does not appear at all, it cannot fix, so its selective advantage does not matter. When it appears repeatedly, it is likely to fix as long as its fitness is above a modest threshold given by Equation (6), but how far above the threshold does not matter much. The time to fixation in this regime is thus dominated by the time tport for the population to reach a portal genotype. The fitness plays a much less important role.
Fig. 3.
Fig. 3.
Hierarchy of models with increasing complexity for the RNA GP map. The rightmost network is the same as Fig. 1: the 1,094 genotypes in the initial NC, which corresponds to phenotype pg, are drawn as gray nodes and possible point mutation connections are shown as gray lines. In addition to neutral mutations within the NC, mutations to two different non-neutral phenotypes are shown, 1,358 genotypes with phenotype pb (blue nodes) and 176 genotypes with phenotype pr (red nodes). The leftmost model depicts a simple average-rate model without the internal structure of a GP map, but the same mean probabilities of mutating to pb and pr (see Schaper and Louis 2014). In the random GP map, the probability that a mutation from gray will lead to pi is the same as in the RNA GP map, but otherwise, the assignment between genotypes and phenotypes is random (similar to Schaper and Louis 2014). The topology GP map has all the neutral connections of the original NC, but randomized non-neutral mutational neighborhoods, thus erasing non-neutral correlations (similar to McCandlish 2012). The community GP map also randomizes non-neutral mutational neighborhoods but only performs swaps within a network community, thus only partially erasing non-neutral correlations. The rightmost drawing represents the full NC from the RNA GP map, and the three structures are shown next to it. To make the figure easier to interpret, only an excerpt is shown for the random GP map.
Fig. 4.
Fig. 4.
Strong deviations from Poisson statistics for the appearance of phenotype pb in a population neutrally evolving with stabilizing selection for pg. Phenotype appearances are quantified by splitting the simulation into time intervals of Δt=3,000 generations and recording how often the given new phenotype pb appears in each Δt. These data are shown for all four GP map models. The number of appearances per interval is highly overdispersed compared to a Poisson distribution with the same mean (gray line), which would be expected from an average-rate model. For the random GP map, the data can be approximated analytically (cyan line, given by supplementary Equation (S13), Supplementary Material online). Vertical lines highlight the values npbΔt/tgene for a range of values npb, depicting the expected number of pb mutants if a perfectly monomorphic population was located at a genotype with exactly npb discrete instances of pb in its mutational neighborhood. The data on the community GP map and full RNA GP map show even higher overdispersion than analytically predicted for the random map. Parameters: population size N=1,000, mutation rate u=2×10⁵, total time 107 generations. The initial NC is the one shown in Fig. 3 and pb corresponds to the blue phenotype in the same figure. Many further examples for other phenotypes and RNA sequences of length L=30 nt can be found in supplementary Sections S2.1 and S2.4, Supplementary Material online.
Fig. 5.
Fig. 5.
How does the amount of overdispersion, quantified by the coefficient of variation from Equation (7), depend on being in the monomorphic regime NuL1 or on being in the slow-drift regime N/L1? We repeat the simulations from Fig. 4: in a) we vary the mutation rate u at a constant population size N=200 to study the effect of leaving the monomorphic regime. In b) we vary the population size N at a constant mutation rate u=5×10⁵ to study the fast-drift regime. The initial and final phenotypes are the gray and red phenotypes in Fig. 1. Each line in the plot stands for a different GP map (see legend). The gray dashed line denotes the Poisson statistics prediction Vt=1. Since the number of (neutral and non-neutral) mutations per generation scales as NLu, we need longer run-times to obtain reliable statistics for lower values of NLu and thus run simulations for T=max(106/(NuL),104) generations, always rounded up to the nearest power of ten.
Fig. 6.
Fig. 6.
Overdispersion weakens the influence of the selective advantage sr of an adaptive phenotype on its time until fixation. The population starts on the NC of the initial phenotype pg and a single phenotype pr has a selective advantage of sr over pg. All other phenotypic changes are deleterious with zero fitness. We repeat the simulation 103 times for each value of sr and record how many generations it takes on average from the start of the simulation until pr fixes (thus, the time includes the introduction through mutations and fixation). Data are shown for all four GP maps (the random, topology, community, and RNA GP maps), as well as for an “average-rate” model, where variation is introduced by a random number generator at a fixed rate for each phenotype. In all cases, pr fixes more rapidly if its selective advantage is higher, but this decrease is much steeper for the average-rate model than for the GP map models, which have overdispersed variation. Classic origin-fixation theory (McCandlish and Stoltzfus 2014; gray line, Equation (8)) describes the “average-rate” simulations well. The flatter scaling on the GP map models is captured by a simple analytic approximation for the random GP map (cyan dotted line, supplementary Equation (S15), Supplementary Material online). Parameters: population size N=103, mutation rate u=2×10⁵ so that M78 for the random map, and NLu0.24. The initial NC is the same as in the preceding Figs. 3-5, and pr is the phenotype drawn in red in Fig. 1.
Fig. 7.
Fig. 7.
Overdispersion affects fixation probabilities in a landscape with two fitness maxima. a) Sketch of the fitness landscape (scenario from Schaper and Louis 2014). The population initially starts with phenotype p0 and can evolve toward one of two local maxima, phenotype pf or pr. pr is the global fitness maximum but is less likely to arise through mutations (thus r for mutationally rare with ϕprp02.3×104 and f for frequent with ϕpfp07.4×103). b) Sketch of the full mutational network relevant to this fitness landscape. c) For each of the GP map models from Fig. 3, as well as for an “average-rate” model, where pf and pr are introduced with constant probabilities, we record the probability that the fitter, but mutationally rarer phenotype pr goes into fixation first. This probability is plotted against the selective bias toward pr, i.e. the ratio of the selective advantages sr and sf, both relative to p0. In all cases, a higher selective bias toward pr makes it more likely for pr to fix, but this trend is less pronounced for the overdispersed dynamics on the GP maps. The simulation results are well predicted by theoretical calculations both for the random GP map (cyan dashed line, Equation (10)) and for the average-rate model (gray dashed line, Equation (9)). Parameters: N=500, u=2×10⁵, probabilities based on 1,000 repetitions.
Fig. 8.
Fig. 8.
Strong deviations from Poisson statistics in two further GP maps, a protein lattice model and Richard Dawkins’s biomorphs. The analysis in Fig. 4 is repeated on two different GP maps: (left) the HP lattice model, a simple model of protein folding, where genotypes are mapped to phenotypes based on free-energy minimization. The initial and final phenotypes used in this specific analysis are shown in the top-right corner. (right) Richard Dawkins’s biomorphs, a toy model of development, where numeric phenotypes are mapped to 2D images as phenotypes based on a recursive growth process. The initial and final phenotypes used in this specific analysis are shown in the top-right corner. Data for further choices of phenotypes in each of these two maps are found in the supplementary Section S3, Supplementary Material online. Parameters: population size N=1,000, mutation rate u=2×10⁵, and total time 107 generations.

Similar articles

Cited by

References

    1. Aguilar-Rodríguez J, Payne JL, Wagner A. A thousand empirical adaptive landscapes and their navigability. Nat Ecol Evol. 2017:1(2):0045. 10.1038/s41559-016-0045 - DOI - PubMed
    1. Aguirre J, Buldú JM, Manrubia SC. Evolutionary dynamics on networks of selectively neutral genotypes: effects of topology and sequence stability. Phys Rev E. 2009:80(6):066112. 10.1103/PhysRevE.80.066112 - DOI - PubMed
    1. Aguirre J, Buldú JM, Stich M, Manrubia SC. Topological structure of the space of phenotypes: the case of RNA neutral networks. PLoS One. 2011:6(10):e26324. 10.1371/journal.pone.0026324 - DOI - PMC - PubMed
    1. Ahnert SE. Structural properties of genotype–phenotype maps. J R Soc Interface. 2017:14(132):20170275. 10.1098/rsif.2017.0275 - DOI - PMC - PubMed
    1. Alberch P. From genes to phenotype: dynamical systems and evolvability. Genetica. 1991:84(1):5–11. 10.1007/BF00123979 - DOI - PubMed