

Evaluating a river's ecological health: A multidimensional approach
- PMID: 38693993
- PMCID: PMC11061703
- DOI: 10.1016/j.ese.2024.100423
Evaluating a river's ecological health: A multidimensional approach
Abstract
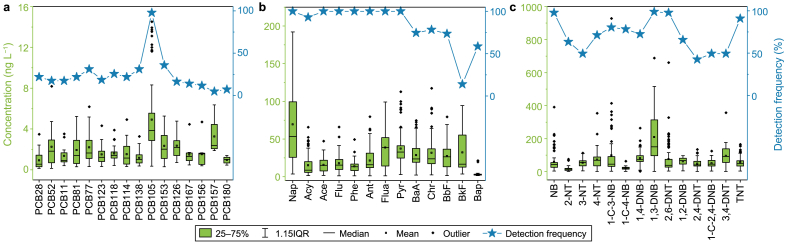
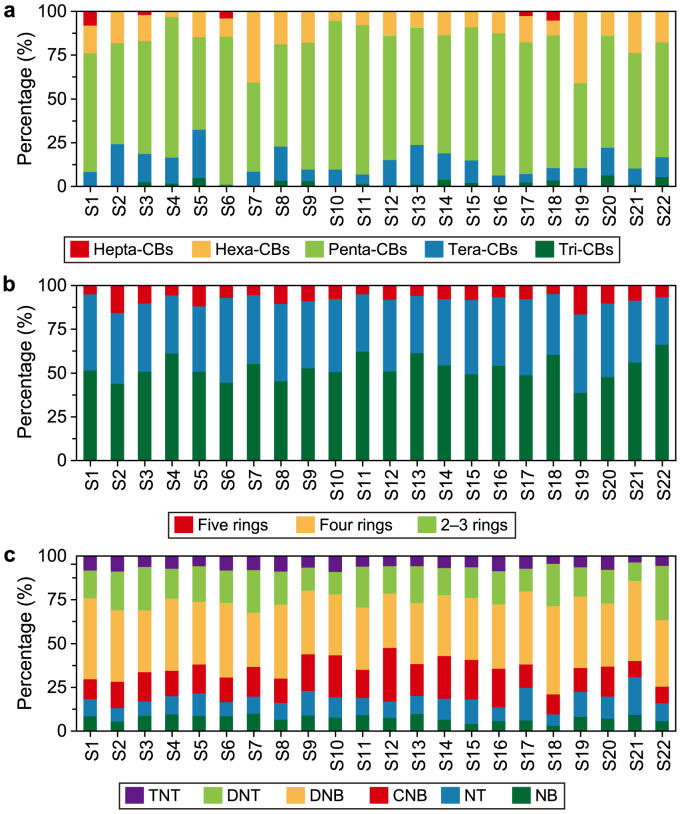
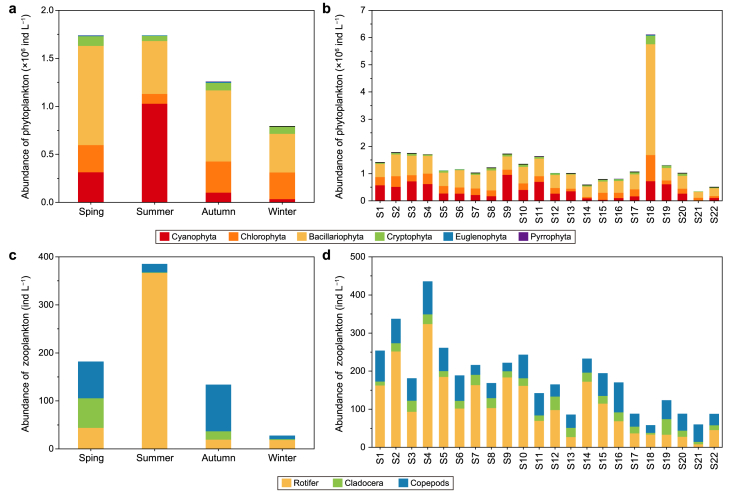
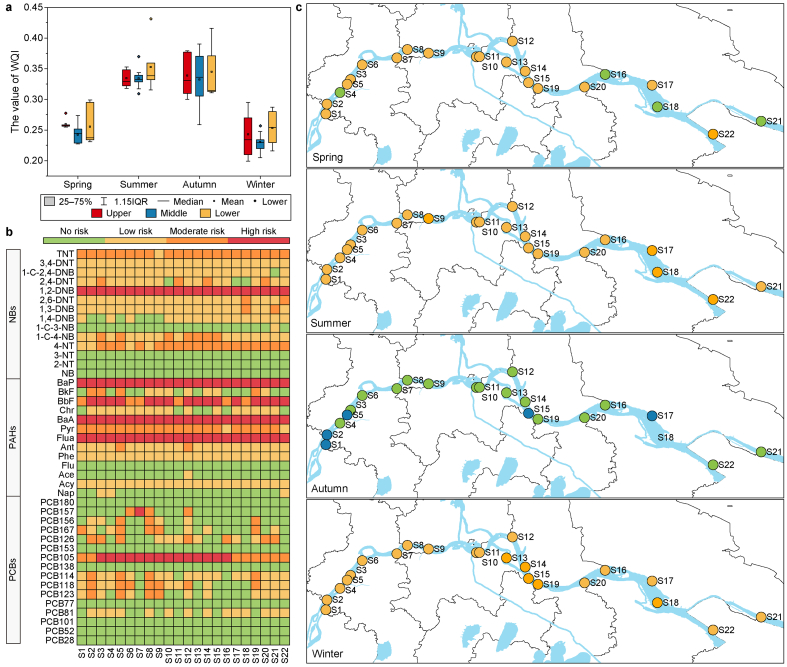
Evaluating the health of river surface water is essential, as rivers support significant biological resources and serve as vital drinking water sources. While the Water Quality Index (WQI) is commonly employed to evaluate surface water quality, it fails to consider biodiversity and does not fully capture the ecological health of rivers. Here we show a comprehensive assessment of the ecological health of surface water in the lower Yangtze River (LYR), integrating chemical and biological metrics. According to traditional WQI metrics, the LYR's surface water generally meets China's Class II standards. However, it also contains 43 high-risk emerging contaminants; nitrobenzenes are found at the highest concentrations, representing 25-90% of total detections, while polycyclic aromatic hydrocarbons present the most substantial environmental risks, accounting for 81-93% of the total risk quotient. Notably, the plankton-based index of biological integrity (P-IBI) rates the ecological health of the majority of LYR water samples (59.7%) as 'fair', with significantly better health observed in autumn compared to other seasons (p < 0.01). Our findings suggest that including emerging contaminants and P-IBI as additional metrics can enhance the traditional WQI analysis in evaluating surface water's ecological health. These results highlight the need for a multidimensional assessment approach and call for improvements to LYR's ecological health, focusing on emerging contaminants and biodiversity rather than solely on reducing conventional indicators.
Keywords: Biological integrity; Ecological risk; High-risk emerging contaminants; Plankton; The lower reaches of the Yangtze River.
© 2024 The Authors.
Conflict of interest statement
The authors declare that they have no known competing financial interests or personal relationships that could have appeared to influence the work reported in this paper.
Figures


References
-
- Wu C., Huang X., Witter J.D., Spongberg A.L., Wang K., Wang D., Liu J. Occurrence of pharmaceuticals and personal care products and associated environmental risks in the central and lower Yangtze river, China. Ecotoxicol. Environ. Saf. 2014;106:19–26. - PubMed
-
- Chong L., Zhong J., Sun Z., Hu C. Temporal variations and trends prediction of water quality during 2010–2019 in the middle Yangtze River, China. Environ. Sci. Pollut. Res. 2023;30(11):28745–28758. - PubMed
-
- Xiong F., Chen Y., Zhang S., Xu Y., Lu Y., Qu X., Gao W., Wu X., Xin W., Gang D.D., Lin L.S. Land use, hydrology, and climate influence water quality of China's largest river. J. Environ. Manag. 2022;318 - PubMed
-
- Zhao Y., Qin Y., Zhang L., Zheng B., Ma Y. Water quality analysis for the three Gorges reservoir, China, from 2010 to 2013. Environ. Earth Sci. 2016;75(17):1225.
-
- Wu Z., Wang X., Chen Y., Cai Y., Deng J. Assessing river water quality using water quality index in Lake Taihu Basin, China. Sci. Total Environ. 2018;612:914–922. - PubMed
LinkOut - more resources
Full Text Sources
Miscellaneous
