. 2024 Apr 30;3(5):pgae143.
doi: 10.1093/pnasnexus/pgae143. eCollection 2024 May.

Astronomy's climate emissions: Global travel to scientific meetings in 2019

Affiliations

Astronomy's climate emissions: Global travel to scientific meetings in 2019

Andrea Gokus et al. PNAS Nexus. .

Abstract

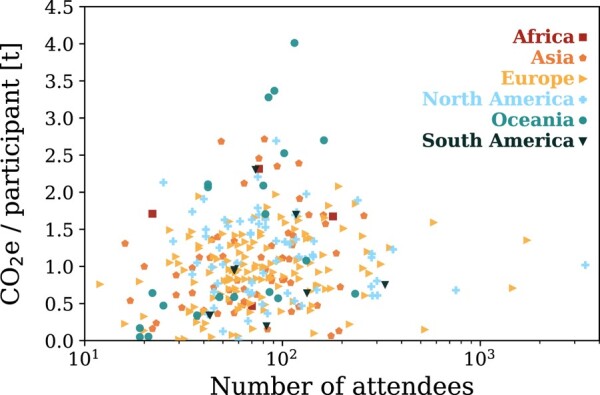
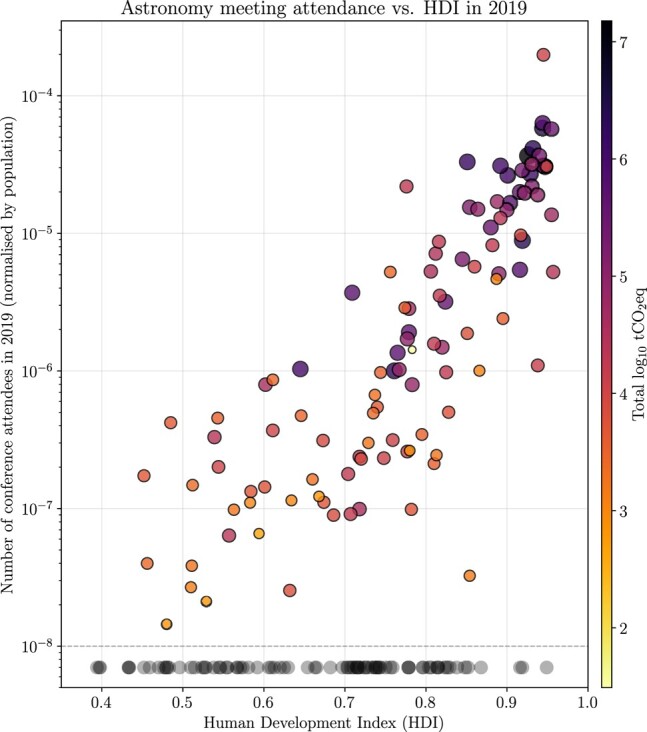
Travel to academic conferences-where international flights are the norm-is responsible for a sizeable fraction of the greenhouse gas (GHG) emissions associated with academic work. In order to provide a benchmark for comparison with other fields, as well as for future reduction strategies and assessments, we estimate the CO2-equivalent emissions for conference travel in the field of astronomy for the prepandemic year 2019. The GHG emission of the international astronomical community's 362 conferences and schools in 2019 amounted to 42,500 tCO2e, assuming a radiative-forcing index factor of 1.95 for air travel. This equates to an average of 1.0 ± 0.6 tCO2e per participant per meeting. The total travel distance adds up to roughly 1.5 Astronomical Units, that is, 1.5 times the distance between the Earth and the Sun. We present scenarios for the reduction of this value, for instance with virtual conferencing or hub models, while still prioritizing the benefits conferences bring to the scientific community.

Keywords: astronomy and astrophysics; climate-change impacts; climate-change mitigation; conferences and meetings.


Figures

Fig. 1.
Fig. 1.
Distribution of all 2019 astronomy/astrophysics meetings around the globe. Conferences are shown as circles and schools are shown as squares. The size of each marker corresponds to the overall amount of GHG emissions related to travel to each meeting, while the color-scale indicates the mean emission per participant for each meeting. A darker shade implies a higher carbon footprint per person, which is related to travel over larger distances.
Fig. 2.
Fig. 2.
Stacked distribution of the mean travel emissions per participant for conferences (panel A) and schools (panel B) on different continents. The stacking order is set by the number of meetings per continent from large to small, i.e. Europe–North America–Asia–Oceania–South America–Africa for conferences, and Europe–Asia–North America–Oceania–South America–Africa for schools.
Fig. 3.
Fig. 3.
Localness vs. mean travel emissions per participants for the conferences. Different symbols indicate the continent on which a meeting took place.
Fig. 4.
Fig. 4.
Illustration of participant numbers vs. the CO2e emission per participant. Different symbols indicate the continent on which a meeting took place.
Fig. 5.
Fig. 5.
Geographical distribution of the meeting venues by continent for the 300 meetings with complete participant data (outer ring), and geographical distribution of the home institutions of all participants (inner ring). With regard to meeting venues and participants, Europe and North America dominate both distributions. Note: Individual scientists will be counted multiple times if participating in multiple meetings.
Fig. 6.
Fig. 6.
Global distribution of travel origins of conference and school participants (panel A). The area of the circles at each location represents the number of trips taken from there. A color scale gives the average CO2e intensity of individual trips per location. Zooms to Europe and North America with rescaled symbols are shown in panels B and C for better visibility.
Fig. 7.
Fig. 7.
Comparison of the HDI of each country of origin for conference participants with the total conference attendees from that country, normalized by population. The color scale and size of the markers show the total amount of GHG travel emissions of all participants for each country. Circles below the dashed line represent the distribution of the HDI for countries with no attendance at astronomy/astrophysics meetings in 2019.

Similar articles

References

    1. Eyring V, et al. 2021. Human influence on the climate system. Vol. 423. Cambridge, UK and New York (NY): Cambridge University Press.
    1. Intergovernmental Panel on Climate Change (IPCC) . 2023. Weather and climate extreme events in a changing climate. Cambridge, UK and New York (NY): Cambridge University Press. p. 1513–1766.
    1. International Air Transport Association (IATA) . 2019. Climate change and carbon offsetting and reduction scheme for international aviation (CORSIA) report.
    1. International Energy Agency (IEA) . 2020. Tracking transport 2020, international energy agency tracking transport report 2020.
    1. Avila D, Sherry L, Thompson T. 2019. Reducing global warming by airline contrail avoidance: a case study of annual benefits for the contiguous United States. TRIP. 2:100033.