. 2024 Apr 17:15:1386719.
doi: 10.3389/fimmu.2024.1386719. eCollection 2024.

The ion channel TRPV5 regulates B-cell signaling and activation

Affiliations

The ion channel TRPV5 regulates B-cell signaling and activation

Trisha Mahtani et al. Front Immunol. .

Abstract

Introduction: B-cell activation triggers the release of endoplasmic reticulum calcium stores through the store-operated calcium entry (SOCE) pathway resulting in calcium influx by calcium release-activated calcium (CRAC) channels on the plasma membrane. B-cell-specific murine knockouts of SOCE do not impact humoral immunity suggesting that alternative channels may be important.

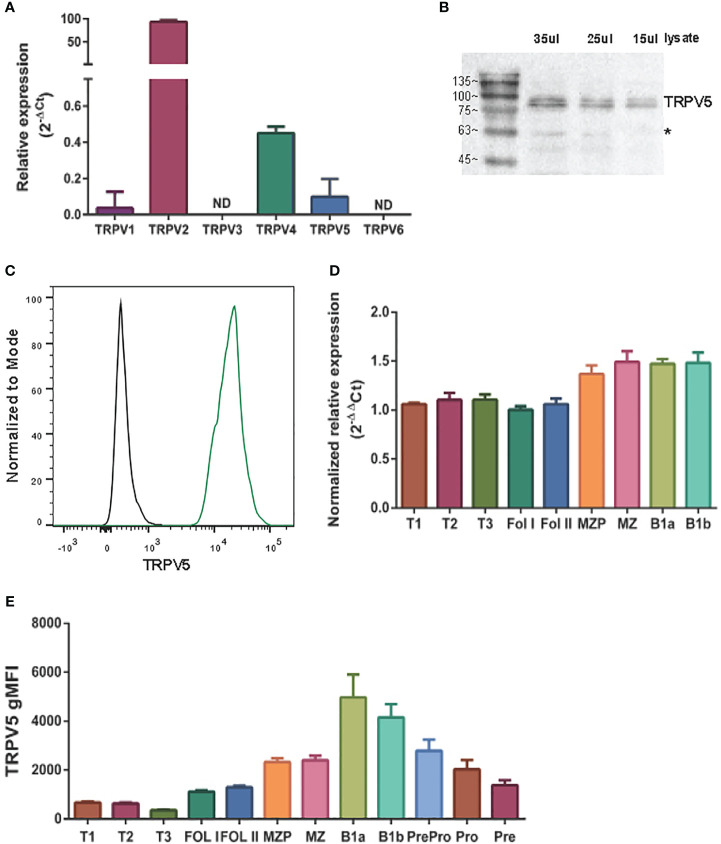
Methods: We identified a member of the calcium-permeable transient receptor potential (TRP) ion channel family, TRPV5, as a candidate channel expressed in B cells by a quantitative polymerase chain reaction (qPCR) screen. To further investigate the role of TRPV5 in B-cell responses, we generated a murine TRPV5 knockout (KO) by CRISPR-Cas9.

Results: We found TRPV5 polarized to B-cell receptor (BCR) clusters upon stimulation in a PI3K-RhoA-dependent manner. TRPV5 KO mice have normal B-cell development and mature B-cell numbers. Surprisingly, calcium influx upon BCR stimulation in primary TRPV5 KO B cells was not impaired; however, differential expression of other calcium-regulating proteins, such as ORAI1, may contribute to a compensatory mechanism for calcium signaling in these cells. We demonstrate that TRPV5 KO B cells have impaired spreading and contraction in response to membrane-bound antigen. Consistent with this, TRPV5 KO B cells have reduced BCR signaling measured through phospho-tyrosine residues. Lastly, we also found that TRPV5 is important for early T-dependent antigen specific responses post-immunization.

Discussion: Thus, our findings identify a role for TRPV5 in BCR signaling and B-cell activation.

Keywords: B cells; TRPV5; ion channels; signaling; transient receptor potential channel.


Conflict of interest statement

The authors declare that the research was conducted in the absence of any commercial or financial relationships that could be construed as a potential conflict of interest. The author(s) declared that they were an editorial board member of Frontiers, at the time of submission. This had no impact on the peer review process and the final decision.

Figures

Figure 1
Figure 1
TRPV5 is expressed in B cells. (A) RNA isolated from primary murine B cells was synthesized into cDNA for qPCR screening. ΔCt values represent the relative expression of genes normalized to the housekeeping gene GAPDH. N.D., not detected. (B) Primary murine B cells were lysed, and varying volumes of lysate were subjected to SDS-PAGE followed by immunoblotting with anti-TRPV5 antibody (4ADI). *Non-specific band. (C) Primary murine splenocytes were fixed and immunostained for TRPV5 (4ADI) and B220. B-cell expression of TRPV5 was analyzed using flow cytometry through gating on B220+ cells stained with anti-TRPV5 antibody (green) or secondary antibody only control (black). (D) RNA isolated from FACS-sorted primary murine WT splenic and peritoneal B cells was synthesized into cDNA for a qPCR screen. ΔΔCt values represent the relative expression normalized to the housekeeping gene, HPRT, and calibrated to the lowest-expressing FOL I subset. (E) Primary splenic, peritoneal, and bone marrow B cells were immunostained for surface markers to identify various B-cell subsets and fixed before immunostaining of TRPV5. Cells were analyzed using flow cytometry. All data are representative of three biological replicates, and error bars represent standard error.
Figure 2
Figure 2
TRPV5 localizes with BCR clusters upon stimulation. Representative confocal fluorescence microscopy images of fixed primary murine splenic B cells immunostained for TRPV5 [green, (A) Abcam, (B) 4ADI] either (A) unstimulated or stimulated for various periods with anti-IgM F(ab′)2 and immunostained for BCR (magenta) or (B) spread for 1.5 or 10 min on planar lipid bilayers with tethered surrogate antigen, anti-kappa light chain (magenta). Line ROIs (blue) were drawn on the cell using ImageJ. Line profiles were generated using ImageJ for the line ROIs and Plot Profile plugin and were plotted on GraphPad Prism. Scale bar represents 3 µm. Data are representative of two independent experiments and at least 30 cells per condition.
Figure 3
Figure 3
Membrane-localized TRPV5 polarizes to BCR clusters in a signaling-dependent manner. (A) Representative confocal fluorescence microscopy images of primary murine splenic B cells treated with either DMSO (vehicle), PP2, BAY61-3606, pictilisib, Rhosin, or Blebbistatin before stimulation for 5 min with anti-IgM F(ab′)2. Cells were fixed and immunostained for BCR (magenta) and TRPV5 (green). Scale bar represents 3 µm. Data are representative of two independent experiments and at least 30 cells per condition. (B, C) Primary murine splenic B cells were stimulated for various timepoints, and surface proteins were biotinylated. Cells were lysed, and membrane and intracellular protein fractions were separated. Lysates were subjected to SDS-PAGE followed by immunoblotting with (B) anti-TRPV5 antibody or (C) anti-IgM antibody.
Figure 4
Figure 4
TRPV5 deficiency does not impair B-cell development or mature B-cell subsets. (A) Primary C57BL/6 WT and TRPV5 KO murine splenic B cells were fixed and immunostained for TRPV5 and analyzed using flow cytometry; ***p < 0.001. (B) For qPCR, splenic B cells were purified from WT and TRPV5 KO mice and lysed in Trizol to extract RNA and synthesize cDNA. Gene expression was measured using qPCR; normalized relative gene expression of TRPV5 KO B cells compared to WT (displayed as 1/ΔCt, normalized expression) was calculated using the ΔΔCt method. HPRT was the housekeeping gene for normalization, and error bars represent the standard error; n = 4. Statistical analysis was performed using the Mann–Whitney test; *p = 0.0268. (C) Primary bone marrow (right panel), splenic (left panel), and peritoneal (right panel) B cells, (D) primary splenic (left panel) and thymic (right panel) T cells, and (E) splenic innate immune cells were immunostained for surface markers to identify various subsets and analyzed using flow cytometry. Data are representative of six biological replicates, and error bars represent standard error. Statistical analysis was performed using the Mann–Whitney test.
Figure 5
Figure 5
TRPV5 deficiency does not significantly impair calcium signaling upon BCR stimulation. Splenocytes were labeled with the calcium indicator Fluo-4AM and B220-APC. Calcium flux upon BCR stimulation in (A) RPMI or (B) HBSS, 1% FBS, 1 mM MgCl2, and 1 mM EGTA was monitored using flow cytometry. Black arrow indicates addition of (A, B) stimulating anti-kappa antibody at varying concentrations or (B) 1 mM Thapsigargin. Red arrow indicates the addition of 2 mM CaCl2. Fold change of Fluo-4 signal over time in WT (black line) and TRPV5 KO (purple line) B cells. Data are representative of six biological replicates; error bars represent standard error. Statistical analysis on peak calcium and area under the curve (AUC) were performed using Mann–Whitney test. (C) Splenic B cells were isolated from WT and TRPV5 KO mice and lysed to extract RNA and synthesize cDNA. Gene expression was measured using qPCR, and normalized relative gene expression of TRPV5 KO B cells compared to WT (displayed as 1/ΔCt normalized expression) was calculated using the ΔΔCt method. HPRT was the housekeeping gene for normalization, and error bars represent the standard error. Data are representative of the mean of two technical replicates per biological replicate; n = 4. Statistical analysis was performed using t-test and the Holm–Sidak method. *p<0.05.
Figure 6
Figure 6
TRPV5 is required for B-cell spreading and antigen aggregation upon stimulation with membrane-bound antigen. Representative total internal reflection fluorescence (TIRF) microscopy images of fixed WT or TRPV5 KO primary murine splenic B cells spread for (A) 1.5 or (B) 10 min on planar lipid bilayers with tethered surrogate antigen (Ag), anti-kappa light chain. BF, brightfield; IRM, interference reflection microscopy. Scale bar represents 3 μm. Data are representative of four independent experiments and at least 20 cells per condition. Cluster area and density were measured using ImageJ, and graphs represent the mean of four biological replicates; error bars represent standard error. Statistical analysis was performed using the Mann–Whitney test; ****p < 0.0001.
Figure 7
Figure 7
BCR signaling is compromised in TRPV5-deficient B cells. Splenocytes from WT (black) and TRPV5 KO (purple) mice were stimulated for various timepoints with 5 µg/ml of anti-IgM F(ab′)2. Cells were either immunostained with anti-B220 and anti-phospho antibodies specific to (A) tyrosine residues; (B) CD79α, Syk, CD19, AKT, PLC2, or ERK; or (C) anti-B220 and anti-NFAT. Cells were then immunostained with (A) streptavidin or (B, C) secondary antibody. Cells were analyzed using flow cytometry and the (A, B) gMFI of phosphorylated proteins, or fold change was determined through (B) normalization of gMFI to unstimulated cells or (C) normalization of cytosolic levels to unstimulated cells and subtracting this value from 1 to infer nuclear levels were plotted. Data are representative of the mean of six (A, B) or nine (C) biological replicates, and error bars represent standard error. Statistical analysis was performed using the Mann–Whitney test; *p = 0.026 (pCD79α 5 min), **p = 0.0087 (pAKT 5 min, PLC2 5 min), 0.0022 (pAKT 15 min, pCD19 15 min, pERK 15 min, pSyk 5 min), 0.0043 (pERK 5 min, pSyk 15 min), 0.0056 (NFAT 5 min).
Figure 8
Figure 8
TRPV5 is important for TD antigen-specific IgG production. WT and TRPV5 KO mice immunized with (A) DNP-Ficoll or (B) DNP-KLH and were bled at days 0, 7, and 14, boosted on day 28, and bled again at days 35 and 42. ELISAs were performed to determine antigen-specific IgM and IgG titers. (C, D) Splenocytes or (E) bone marrow cells were collected on day 42 (day 14 after boost) from NP-Ficoll- and NP-KLH-immunized WT and TRPV5 KO mice. Cells were immunostained with (C) anti-GL7, CD95, CD38, CD138, CCR6, and B220; (D) CD4, CD44, PD1, and CXCR5; or (E) CD38, CD80, IgD, IgG1, and B220 and were analyzed using flow cytometry. Data are representative of three biological replicates. Graphs for quantification of splenocytes (C) gated on B220+ to quantify CD38CD95+ GC B cells and CCR6+ GC B cells, gated on (B) B220+ or (E) single cells to quantify CD38+CD138+ antibody-secreting cells (ASCs), (C) gated on CD4+ to quantify PD1+CXCR5+ TFH cells and CD44 gMFI in TFH cells and (E) gated on B220+IgD to quantify IgG1+CD38+ memory B cells. Statistical analysis was performed using the Mann–Whitney test; n = 3.

Similar articles

Cited by

References

    1. Kurosaki T, Shinohara H, Baba Y. B cell signaling and fate decision. Annu Rev Immunol. (2010) 28:21–55. doi: 10.1146/annurev.immunol.021908.132541 - DOI - PubMed
    1. Scharenberg AM, Humphries LA, Rawlings DJ. Calcium signalling and cell-fate choice in B cells. Nat Rev Immunol. (2007) 7:778–89. doi: 10.1038/nri2172 - DOI - PMC - PubMed
    1. Feske S, Wulff H, Skolnik EY. Ion channels in innate and adaptive immunity. Annu Rev Immunol. (2015) 33:291–353. doi: 10.1146/annurev-immunol-032414-112212 - DOI - PMC - PubMed
    1. Matsumoto M, Fujii Y, Baba A, Hikida M, Kurosaki T, Baba Y. The calcium sensors STIM1 and STIM2 control B cell regulatory function through interleukin-10 production. Immunity. (2011) 34:703–14. doi: 10.1016/j.immuni.2011.03.016 - DOI - PubMed
    1. Tang H, Wang H, Lin Q, Fan F, Zhang F, Peng X, et al. . Loss of IP 3 receptor–mediated ca 2+ Release in mouse B cells results in abnormal B cell development and function. J Immunol. (2017) 199:570–80. doi: 10.4049/jimmunol.1700109 - DOI - PubMed

Publication types