. 2024 Apr 20:6:100130.
doi: 10.1016/j.crneur.2024.100130. eCollection 2024.

The type of inhibition provided by thalamic interneurons alters the input selectivity of thalamocortical neurons

Affiliations

The type of inhibition provided by thalamic interneurons alters the input selectivity of thalamocortical neurons

Deyl Djama et al. Curr Res Neurobiol. .

Abstract

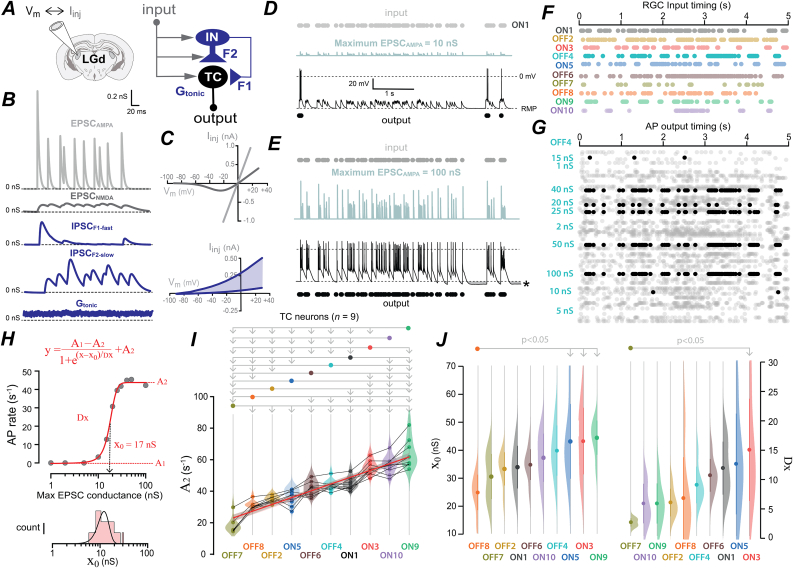
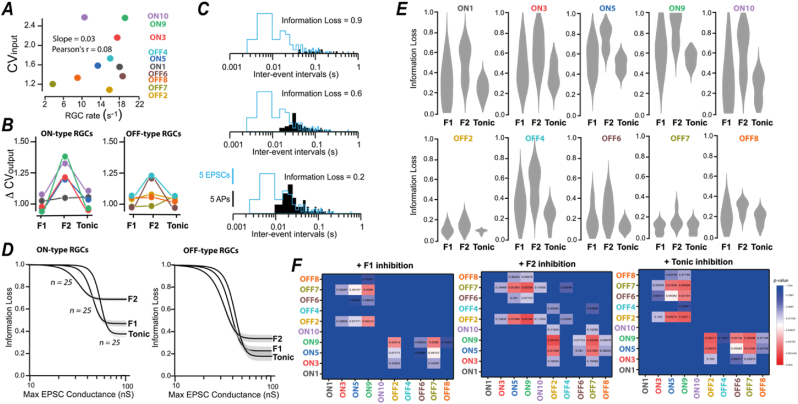
A fundamental problem in neuroscience is how neurons select for their many inputs. A common assumption is that a neuron's selectivity is largely explained by differences in excitatory synaptic input weightings. Here we describe another solution to this important problem. We show that within the first order visual thalamus, the type of inhibition provided by thalamic interneurons has the potential to alter the input selectivity of thalamocortical neurons. To do this, we developed conductance injection protocols to compare how different types of synchronous and asynchronous GABA release influence thalamocortical excitability in response to realistic patterns of retinal ganglion cell input. We show that the asynchronous GABA release associated with tonic inhibition is particularly efficient at maintaining information content, ensuring that thalamocortical neurons can distinguish between their inputs. We propose a model where alterations in GABA release properties results in rapid changes in input selectivity without requiring structural changes in the network.


Conflict of interest statement

The authors declare the following financial interests/personal relationships which may be considered as potential competing interests. This research was funded by the Biotechnology and Biological Sciences Research Council (BB/R007659/1)

Figures

Image 1
Graphical abstract
Fig. 1
Fig. 1
Slow-rising IPSCs are more prominent in TC neurons of the LGd. A, Full projection of two-photon imaging data obtained following automated block face imaging of the Sox14gfp/+ mouse brain. Each fluorescently labelled Sox14gfp/+ cell is colour-coded according to rostro-caudal location in accordance with the colour sequence key superimposed on the sagittal brain section in the bottom left-hand corner of the panel. Higher magnification images of the dataset concentrating on the dorsal lateral geniculate nucleus (LGd) region and the ventrobasal (VB) region of the thalamus are shown in panel i and ii. Note the high density of Sox14gfp/+ cells in the intergeniculate leaflet (IGL) and ventral portion of the lateral geniculate nucleus (LGv) and the much lower density of Sox14 cells in the adjacent VB. B, A continuous current trace obtained during a whole-cell voltage clamp recording showing GABAA receptor blockade in the presence of 10 μM SR95531. All point histograms (grey) were used to calculate the average holding current before and after GABAA receptor blockade. The change in holding current was subsequently used to estimate the tonic conductance in these cells. The initial brief section of the current shown below the full trace illustrates the location of transient events detected with our automated template fitting routine (grey circles). The single open circle illustrates a missed transient that was much faster than the template. C, Examples of transient events recorded in control conditions and during GABAA receptor blockade. Note the much faster kinetics of the transient events recorded in the presence of 10 μM SR95531. D, scatter plot of the sEPSC rates estimated in 9 cells during GABAA receptor blockade versus the putative sIPSC rates estimated from these same cells in control conditions. Note how the sIPSC rates are consistently greater than sEPSC rates in each cell. The plot on the right shows the tonic conductance estimates obtained from these same 9 cells (colour coded) with a violin plot in grey and a bar graph showing the 25% and 75% range and the median (white circle) and mean (white line) values. E, The scatter plots show the average sIPSC rate and average peak amplitude for sIPSCs calculated for 43 LGd relay neurons (red circles) and 32 VB relay neurons (blue circles) recorded in the presence of 1 mM kynurenate to block sEPSCs of the type shown in panel C. Note the use of a log scale for plotting sIPSC rates. F, Average sIPSC waveforms constructed from 445 sIPSCs recorded from an LGd relay neuron (red) compared to 462 sIPSCs recorded from a VB relay neuron (blue). The automated template fitting routine aligned events on the initial rising phase of the waveform as detected by a first derivative analysis. Note the faster monotonic rising phase of the VB waveform. The scatter plot below these traces indicates results from the entire population with 43 LGd cells and 32 VB cells with histograms aligned on the axis with Gaussian fits to illustrate the underlying distributions for rise-time and decay estimates. G, Illustration of the variational Dirichlet process (DP) Gaussian mixture model that was used to perform cluster analysis. The bubble plot demonstrates the probability that any point is associated with the 3 identified clusters. H, A scatter plot of the centroid estimate for all clusters identified following DP analysis for TC neurons in the LGd and VB of Sox14gfp/+ mice. I, Scatter plot of morphological differences detected for thalamic relay neurons in the LGd. I, Examples of three Biocytin fills along with a graphical representation of the three different relay neuron morphologies. Dendrite branch points were quantified using a three-dimensional analysis of the x,y,z co-ordinates with the centre of the soma set as 0,0,0 co-ordinates. The plot of ɵ and ɸ angles demonstrates the presence of two clear clusters for X-type relay neuron, consistent with a bi-polar distribution. The size of each circle denotes the distance from the soma. J, Scatter plots comparing the three morphological classes identified in the LGd (left panel) along with an analysis of the weighted decay and 10–90% rise time estimates for a subset of cells that had been classified based upon their morphology (right panel). (For interpretation of the references to colour in this figure legend, the reader is referred to the Web version of this article.)
Fig. 2
Fig. 2
Interneurons are responsible for the slow-rising IPSCs onto TC neurons. A, Images showing qualitative comparison of Sox14Gfp/+ and Sox14Gfp/Gfp brain sections at AP -2.4. Sox14Gfp/Gfp (a genetic knockdown) shows decreased GFP expression across midbrain, thalamic and hypothalamic regions. Labels indicate ventrobasal complex (VB), lateral posterior nucleus (LP), dorsal lateral geniculate nucleus (LGd), and the intergeniculate leaflet (IGL). Scale bars are 100 μm in length B, Quantification of nearest neighbour distances for Sox14 cells in the LGd and VB regions of the thalamus and comparison to the LGd region in Sox14Gfp/Gfp mice. The histograms are probability density functions for the nearest neighbour distances calculated for the LGd (purple) and VB (blue) regions of the Sox14Gfp/+ brain with bin widths of 10 μm reflecting the minimum sampling resolution used for these imaging experiments. The bottom histogram is the quantification of Sox14 neurons in the LGd of Sox14Gfp/Gfp mice (orange). C, Examples of detected sIPSCs recorded from TC relay neurons in the LGd of Sox14Gfp/+ (purple) and Sox14Gfp/Gfp (orange) mice recorded at a command voltage of −70mV. D, Scatter plot comparing 10–90% rise time and weighted decay between Sox14Gfp/+ (purple) and Sox14Gfp/Gfp (orange) LGd relay neuron population. Each dot represents averaged 10–90% rise time and weighted decay values for a single recorded neuron. Note that the Sox14Gfp/+ population has significantly slower 10–90% rise time compared to Sox14Gfp/Gfp neurons, while there is no significant difference in weighted decay. E, Data from cluster analysis. The scatter plots show the average values for each cluster centre for all data gathered from the two strains. Note the absence of slow-rising clusters in the Sox14Gfp/Gfp (orange) data. F, Illustration of the strategy used to deliver ChR2 into LGd interneurons (LGd-INs) in the Sox14Cre/+ mouse line and optical stimulation in the acute slice preparation. The 470 nm LED output (blue trace) recorded from the water immersion objective lens that was used to excite ChR2-expressing LGd-INs. The morphology of a single LGd-INs recorded from the Sox14Cre/+ line is also shown. G, Example of current traces recorded from a TC neuron responding to LGd-INs excitation following brief light pulses at 1 Hz in control condition and in the presence of 1 μM TTX. Note the slower kinetics and onset of the eIPSC recorded in the presence of TTX. This is consistent with the reported properties of dendro-dendritic GABA release. The scatter plot shows the latency of eIPSCs to brief 1Hz light pulse stimulation in control condition and in the presence of TTX in the same neurons. The open circles denote the median values obtained for these skewed distributions. H, Example traces recorded from the same TC neuron at the end of the 1 Hz and 10 Hz stimulation protocols recorded in control conditions. Note the long latency of the eIPSCs recorded at the higher stimulation rate. The right-hand plot shows the change in eIPSC latency during LED stimulation rates of 1, 10, 20 and 30 Hz. The solid line is the average fit to data from five individual recordings and the shaded areas are the SEM of these fits. (For interpretation of the references to colour in this figure legend, the reader is referred to the Web version of this article.)
Fig. 3
Fig. 3
TC neurons can distinguish between different RGC input patterns. A, Illustration of simultaneous voltage monitoring and current injection used to mimic the conductance changes associated with the thalamic circuitry. The retinogeniculate input pattern was used to control the conductance waveforms generated by the feedforward circuit associated with local interneurons at both axo-somatic F1 and dendro-dendritic F2 synapses. The final conductance waveform was designed to simulate the tonic conductance present on TC neurons. B, Time-varying conductance waveforms used to mimic the AMPA- and NMDA-type retinogeniculate synapses (EPSCAMPA and EPSCNMDA) are shown in the top 2 Gy traces, whereas the axo-somatic F1-type fast synapses (IPSCF1-fast), the dendro-dendritic F2-type slow synapses (IPSCF2-slow) and the persistent tonic conductance changes (Gtonic) are shown in blue. C, The upper I-V relationships were used to calculate the current injection at any given membrane voltage for the linear Ohmic relationship used to control the AMPA-type EPSC waveforms compared to the more complex Boltzmann function used to control the non-linear voltage-dependence of the NMDA-type EPSCs shown in B. The lower blue traces are the I-V plots of the GHK-type open rectification used to simulate the chloride ion flux through GABAA receptors. The shaded blue region depicts the range of I-V relationships used to control the IPSCF1-fast, IPSCF2-slow and Gtonic time varying conductance changes. D, Illustration of a dynamic-clamp experiment delivering an ON-type RGC input pattern (labelled ON1 in panel E) at a maximum conductance of 10 nS. The timing of the input pattern is shown with filled grey circles and the resulting time-varying conductance change used to mimic the retinogeniculate synapse onto this TC neuron is shown in with the light blue trace. The black trace is the membrane voltage recorded from the TC neuron during this stimulation pattern and the timing of each AP is shown with black circles below each trace. In this neuron, only 7 APs were elicited when the maximum excitatory conductance was delivered at 10 nS. E, The same cell shown in D, but the maximum excitatory conductance has been raised to 100 nS. An AP is now elicited in response to every EPSC. Note also how a prolonged membrane hyperpolarization was observed once this maximum excitation was removed (asterisk) that we assume reflects a Ca2+ activated potassium conductance triggered by sustained high frequency AP firing. F, Raster plot of the timings used to simulate the 10 different RGC input patterns used in subsequent experiments. Each input pattern is colour coded. G, Raster plots illustrating all AP timings recorded from a single relay neuron in response to 5 s dynamic clamp protocols simulating 10 separate RGC timing patterns delivered at varying maximum conductance values. The solid black circles mark the timing of this neuron to a single pattern of RGC inputs named OFF4 at maximum conductance values ranging from 1 to 100 nS. H, Plot of the input-output relationship constructed from the AP firing of a single relay neuron in response to the OFF4 RGC input pattern. This data was fitted with the Boltzmann function shown in red from which the maximum AP firing rate (A2), the inflection point of the curve (x0) and the slope coefficient (Dx) was extracted. Below the I-O plot is a histogram showing the distribution of x0 values obtained for 15 relay neurons stimulated with the same ON1 type input pattern. I, The A2 values obtained from 9 TC neurons that received all 10 RGC input patterns are plotted as scatter and violin plots. The solid lines connect data obtained from individual relay neurons. Data in this plot were ranked according to the mean A2 values and ANOVA followed by Bonferroni correction was used to determine significance between response types. The red line is the result of a linear regression with a Pearson's r of 0.9 indicating the ability of this ranking to explain much of the variability in the maximum firing rates. The shaded area around the regression line is the 95% confidence limits for this fit. J, Comparison of x0 and Dx distributions obtained for all 10 RGC input patterns delivered to the same 9 TC neurons in I. The RGC ranking was sorted based on either the mean x0 or mean Dx values and ANOVA demonstrated how few RGC patterns were significantly different from each other when considering either parameter. For example, based upon Dx values, only the TC neurons sensitivity to OFF7 and ON3 were significantly different. (For interpretation of the references to colour in this figure legend, the reader is referred to the Web version of this article.)
Fig. 4
Fig. 4
Tonic inhibition alters TC neuron input sensitivity with greater potency than phasic inhibition. A, Series of membrane voltage recordings obtained in response to an ON-type RGC input pattern delivered at the previously determined X0 value for excitation. The top trace is recorded with no inhibition present (Excitation only) whereas the next three traces include F1 inhibition, F2 inhibition and tonic inhibition that was delivered at a maximum conductance of 100, 50 & 5 nS respectively. B, The left-hand histogram is an inter-event interval (IEI) distribution constructed for all 10 RGC input patterns (grey bars). The input IEI distribution was well-described by the sum of three Gaussians (smooth grey line). The right-hand histogram is an IEI distribution constructed from all AP outputs recorded from a single TC neuron (black bars). This output IEI distribution was best fit with the sum of two Gaussians (smooth black line). The shaded blue region in each histogram denotes the high frequency region above 100 Hz. Note that for the output IEI there is a clear absence of events in this region even through these high frequency IEIs are present in the input histogram. This observation clearly illustrates the low pass filtering characteristics of TC neurons. C, Scatter plots comparing the effect of varying the maximum conductance of F1, F2 or tonic inhibition on the AP probability recorded for the cell shown in A. The solid lines are the results of exponential fits to the data. The dashed line illustrates our selection of equipotent levels of inhibition for use in subsequent experiments. D, Histogram of the AP probability calculated at all IEIs following delivery of all 10 RGC input patterns to a single TC neuron. The density of the shaded bars illustrates the number of events used to calculate the AP probability at each IEI. Similar plots were constructed following the delivery F1-type, F2-type and tonic inhibition at the equipotent levels of inhibition determined from panel C. E, X–Y error plots of the mean x0 and Dx values calculated from all TC neurons in response to each of the 10 different RGC patterns. For each RGC firing pattern, we show the input sensitivity with excitation alone and then in the presence of the equipotent levels of F1-type, F2-type and tonic inhibition that were determined in panel C. Note the consistent rightward shift in the x0 values that occurs with all types of inhibition is far more pronounced for tonic inhibition. However, the effect of inhibition on the slope coefficient, Dx, was far more variable and did not exhibit any obvious trends for any of the ON or OFF responses. (For interpretation of the references to colour in this figure legend, the reader is referred to the Web version of this article.)
Fig. 5
Fig. 5
Temporal precision and rate coding are sensitive to different types of inhibition. A, Histogram of the inter-event interval (IEI) distribution for an ON-type RGC input illustrating the method chosen for identifying clusters within the RGC input patterns. The mean IEI is used as the cut-off to identify each cluster shown on the conductance waveform below. In this example 13 clusters were identified. B, The top traces are conductance waveforms used to excite and inhibit the TC neurons. For illustrative purposes the inhibitory waveforms are reflected downwards. The voltage traces recorded from the TC neuron are shown below each set of conductance waveforms. In each case a single AP is initiated. The distribution of AP first latency measurements obtained for the first AP initiated in each cluster are shown in the histograms. Each TC neurons received excitation from all 10 RGC input patterns and first latency distributions were constructed with excitation alone (grey), and with F1-type (red), F2-type (purple) or tonic inhibition (green). C, Gaussian functions (smooth lines) were fitted to the resulting distributions obtained for each TC neuron. The scatter plot shows the mean values and SEM obtained for both the centre of each fitted Gaussian and the half-width for 5 TC neurons in each condition. D, Plot of the input sensitivity across all input cluster rates with excitation only (grey) and in the presence of F1-type (red), F2-type (purple) and tonic inhibition (green). E, Results of exponential fits to the relationship between input frequency and the output frequency for all clusters. The shaded areas are the 95% confidence limits for the fits. F, Histogram of the number of clusters at each input rate. The data has been fitted with the sum of two Gaussians. G, Input-output curves for two clusters at 8 s−1 and 35 s−1. The Boltzmann functions compares the sensitivity of these clusters to changing EPSC conductance with excitation only and in the presence of F2-type inhibition. H, Plot of the dynamic range across the input cluster rate for excitation only (grey) compared to addition of F1-type (red), F2-type (purple) and tonic inhibition (green). The dashed line indicates the division between low frequency and high frequency clusters as shown in F. I, Comparison of the mean dynamic range for the low and high frequency clusters for excitation only (grey) compared to addition of F1-type (red), F2-type (purple) and tonic inhibition (green). ANOVA followed by Bonferroni correction was used to determine significance between response types (p < 0.01: **; p < 0.001: ***; n.s.: not significant). (For interpretation of the references to colour in this figure legend, the reader is referred to the Web version of this article.)
Fig. 6
Fig. 6
Information loss is limited by tonic inhibition. A, Scatter plot illustrating the relationship between the RGC event rate and the coefficient of variability (CVinput) for each of the 10 input patterns used in this study. Linear regression analysis (not shown) indicated no relationship between these parameters with a slope of just 0.03 and a very low Pearson's r of 0.08. B, Line series plot illustrating the change in variability produced by TC neuron AP firing (CVoutput) in response to the 10 different RGC patterns following the delivery of F1, F2 and tonic inhibition at equipotent inhibition (as determined from Fig. 4C). Note how F2-type inhibition was most often associated with a greater change in variability compared to F1-type and tonic inhibition. C, Histograms of inter-event intervals obtained for a single RGC input pattern (blue) superimposed on the TC neuron AP output (black) at increasing synaptic drive. The difference between the input and the output distributions was used to quantify information loss in each case. D, Plots of information loss at increasing EPSC conductance. Information loss was reduced once AP threshold was reached by the synaptic conductance and the lowest degree of information loss was consistently observed when the EPSC conductance level was at a maximum value of 100 nS. Note how the OFF-type inputs were characterized by lower levels of information loss. Consistent with previous data on CV analysis, F2-type inhibition increased the information loss whereas tonic inhibition was associated with the lowest information loss for both ON- and Off-type RGC patterns. E, A series of violin plots showing information loss for each RGC input pattern. Note how the variability was greatest in the presence of F2-type inhibition but lower for the OFF-type RGC inputs (excepting OFF4). F, Heat maps showing the significant differences that were calculated between the RGC input patterns. Note how F1-type inhibition reduces the difference between RGC-types but tonic inhibition results in the greatest number of differences between RGC input patterns. (For interpretation of the references to colour in this figure legend, the reader is referred to the Web version of this article.)

Similar articles

Cited by

References

    1. Acuna-Goycolea C., Brenowitz S.D., Regehr W.G. Active dendritic conductances dynamically regulate GABA release from thalamic Interneurons. Neuron. 2008;57:420–431. - PubMed
    1. Arcelli P., Frassoni C., Regondi M.C., De Biasi S., Spreafico R. GABAergic neurons in mammalian thalamus: a marker of thalamic complexity? Brain Res. Bull. 1997;42:27–37. - PubMed
    1. Bakken T.E., van Velthoven C.T., Menon V., Hodge R.D., Yao Z., Nguyen T.N., Graybuck L.T., Horwitz G.D., Bertagnolli D., Goldy J., Yanny A.M., Garren E., Parry S., Casper T., Shehata S.I., Barkan E.R., Szafer A., Levi B.P., Dee N., Smith K.A., Sunkin S.M., Bernard A., Phillips J., Hawrylycz M.J., Koch C., Murphy G.J., Lein E., Zeng H., Tasic B. Single-cell and single-nucleus RNA-seq uncovers shared and distinct axes of variation in dorsal LGN neurons in mice, non-human primates, and humans. Elife. 2021;10 - PMC - PubMed
    1. Barbaresi P., Spreafico R., Frassoni C., Rustioni A. GABAergic neurons are present in the dorsal column nuclei but not in the ventroposterior complex of rats. Brain Res. 1986;382:305–326. - PubMed
    1. Belelli D., Peden D.R., Rosahl T.W., Wafford K.A., Lambert J.J. Extrasynaptic GABAA receptors of thalamocortical neurons: a molecular target for hypnotics. J. Neurosci. : the official journal of the Society for Neuroscience. 2005;25:11513–11520. - PMC - PubMed