

β-carbolines that enhance GABAA receptor response expressed in oligodendrocytes promote remyelination in an in vivo rat model of focal demyelination
- PMID: 38694535
- PMCID: PMC11061515
- DOI: 10.3389/fncel.2024.1369730
β-carbolines that enhance GABAA receptor response expressed in oligodendrocytes promote remyelination in an in vivo rat model of focal demyelination
Abstract
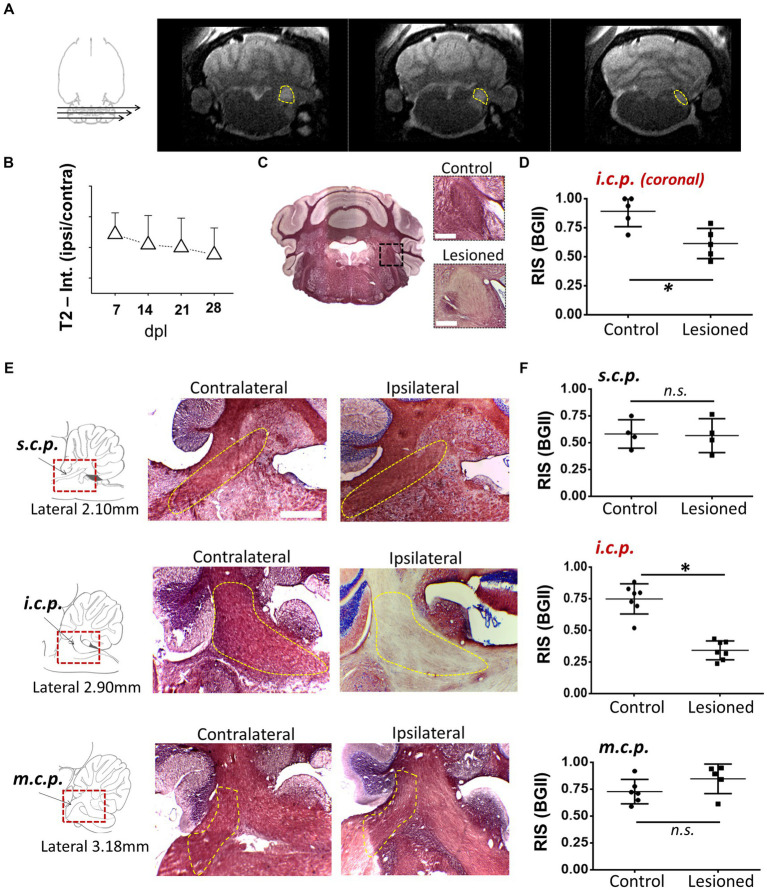
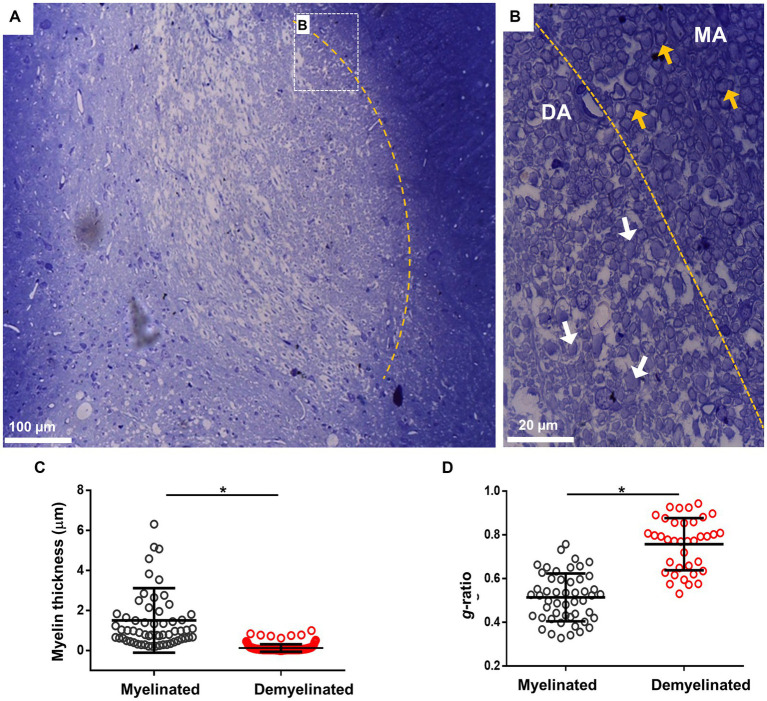
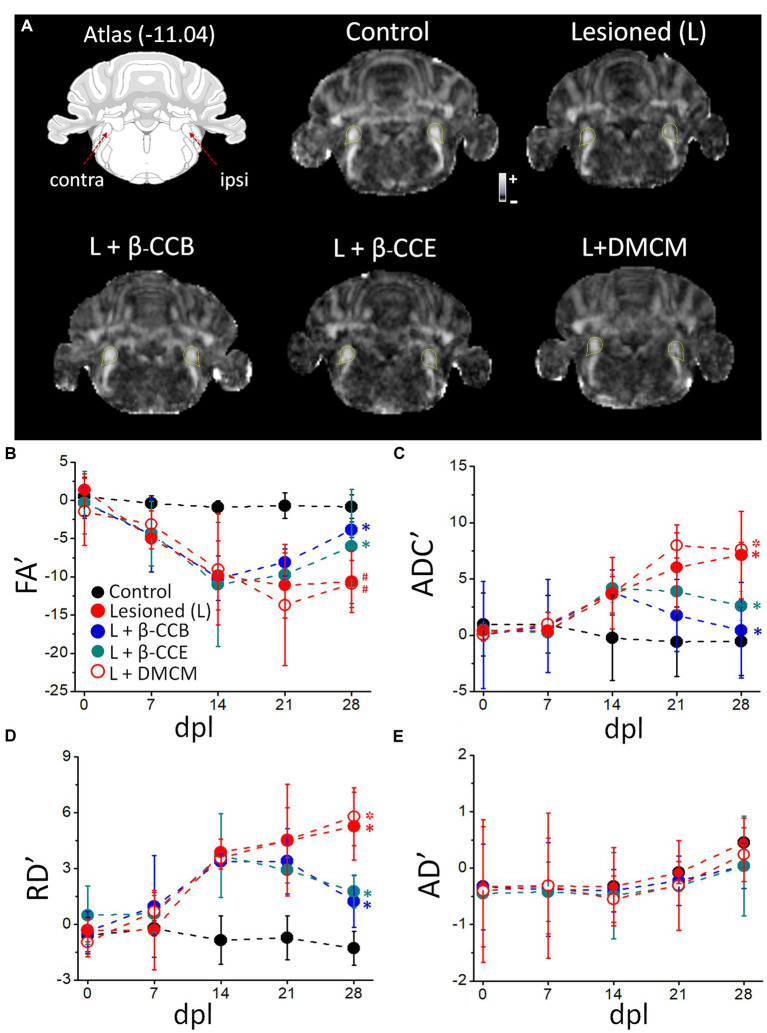
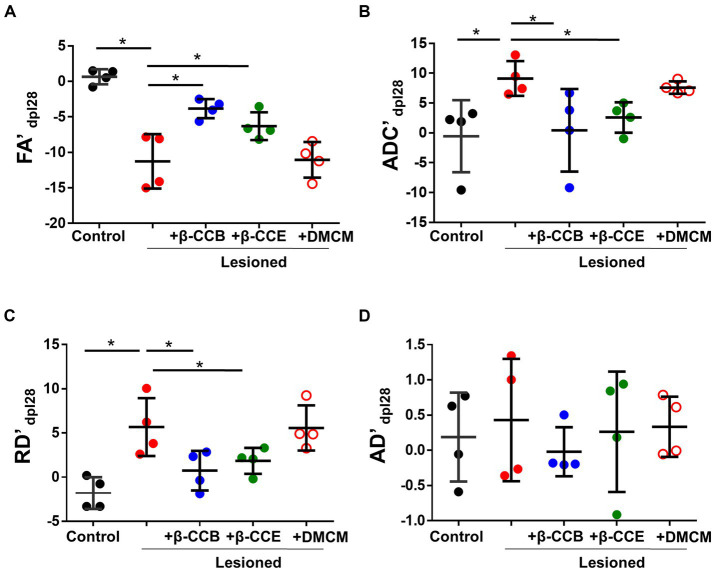
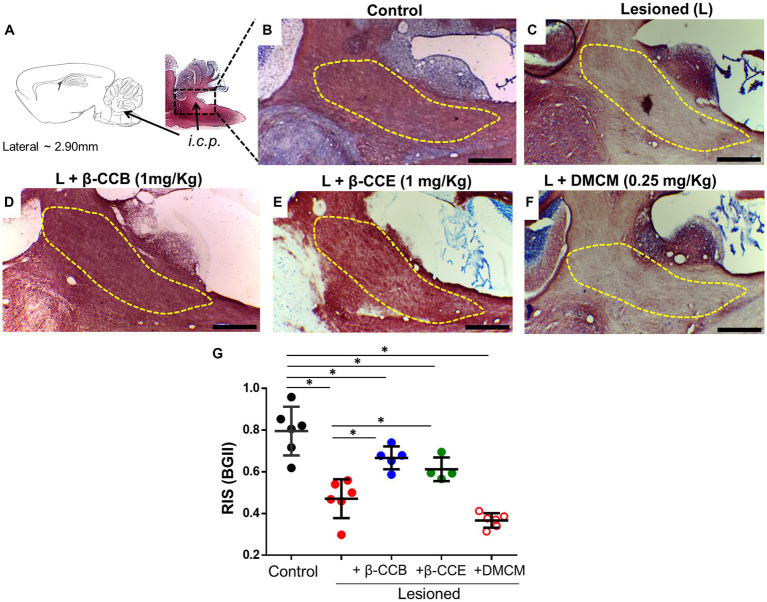
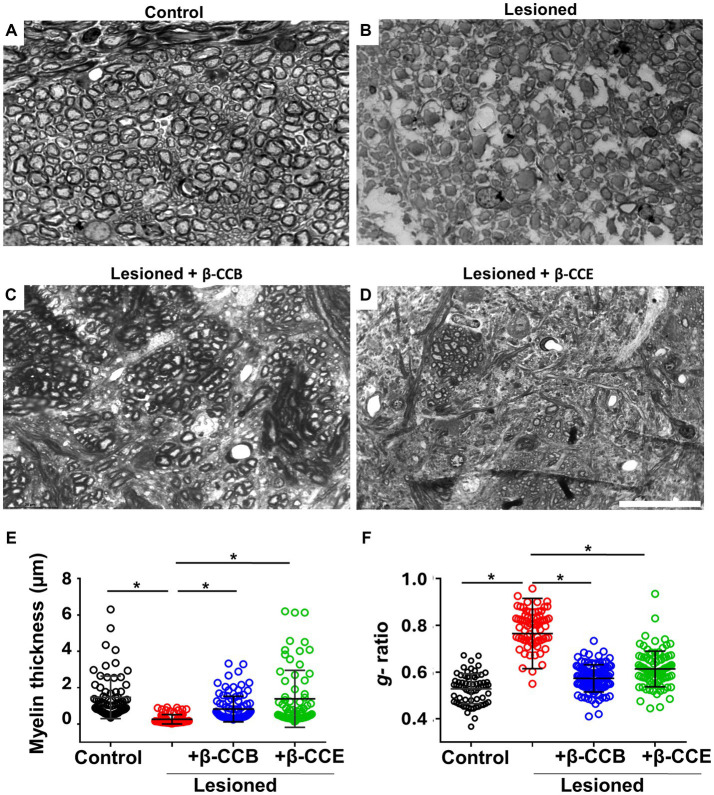
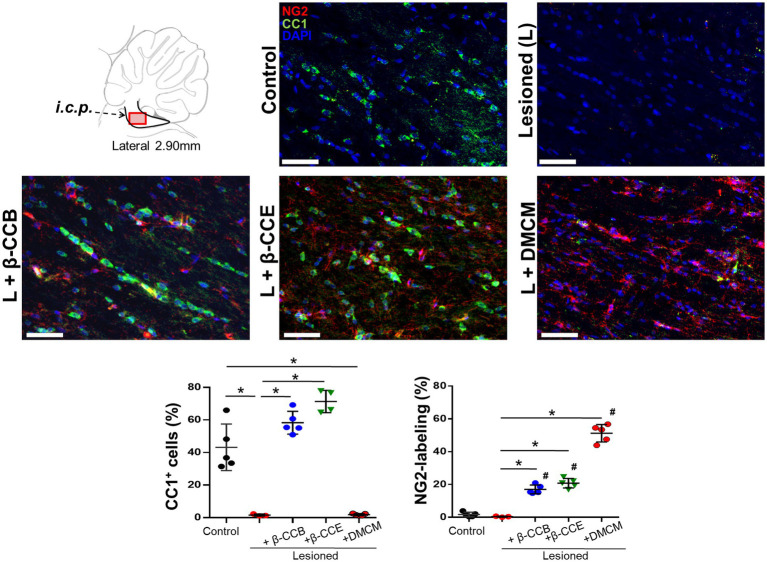
Demyelination is typically followed by a remyelination process through mature oligodendrocytes (OLs) differentiated from precursor cells (OPCs) recruited into the lesioned areas, however, this event usually results in uncompleted myelination. Potentiation of the remyelination process is an important target for designing effective therapeutic strategies against white matter loss. Here, it was evaluated the remyelinating effect of different β-carbolines that present differential allosteric modulation on the GABAA receptor expressed in OLs. For this, we used a focalized demyelination model in the inferior cerebellar peduncle (i.c.p.) of rats (DRICP model), in which, demyelination by ethidium bromide (0.05%) stereotaxic injection was confirmed histologically by staining with Black-Gold II (BGII) and toluidine blue. In addition, a longitudinal analysis with diffusion-weighted magnetic resonance imaging (dMRI) was made by computing fractional anisotropy (FA), apparent diffusion coefficient (ADC) and diffusivity parameters to infer i.c.p. microstructural changes. First, dMRI analysis revealed FA decreases together with ADC and radial diffusivity (RD) increases after demyelination, which correlates with histological BGII observations. Then, we evaluated the effect produced by three allosteric GABAA receptor modulators, the N-butyl-β-carboline-3-carboxylate (β-CCB), ethyl 9H-pyrido [3,4-b]indole-3-carboxylate (β-CCE), and 4-ethyl-6,7-dimethoxy-9H-pyrido [3,4-b]indole-3-carboxylic acid methyl ester (DMCM). The results indicated that daily systemic β-CCB (1 mg/Kg) or β-CCE (1 mg/Kg) administration for 2 weeks, but not DMCM (0.35 mg/Kg), in lesioned animals increased FA and decreased ADC or RD, suggesting myelination improvement. This was supported by BGII staining analysis that showed a recovery of myelin content. Also, it was quantified by immunohistochemistry both NG2+ and CC1+ cellular population in the different experimental sceneries. Data indicated that either β-CCB or β-CCE, but not DMCM, produced an increase in the population of CC1+ cells in the lesioned area. Finally, it was also calculated the g-ratio of myelinated axons and observed a similar value in those lesioned animals treated with β-CCB or β-CCE compared to controls. Thus, using the DRICP model, it was observed that either β-CCB or β-CCE, positive modulators of the GABAA receptor in OLs, had a potent promyelinating effect.
Keywords: GABAergic signaling; OPC; diffusion tensor imaging; myelin; oligodendrocyte; white matter; β-carbolines.
Copyright © 2024 Cisneros-Mejorado, Ordaz, Garay and Arellano.
Conflict of interest statement
The authors declare that the research was conducted in the absence of any commercial or financial relationships that could be construed as a potential conflict of interest.
Figures
Similar articles
-
N-butyl-β-carboline-3-carboxylate (β-CCB) systemic administration promotes remyelination in the cuprizone demyelinating model in mice.Sci Rep. 2024 Jun 18;14(1):13988. doi: 10.1038/s41598-024-64501-x. Sci Rep. 2024. PMID: 38886527 Free PMC article.
-
Demyelination-Remyelination of the Rat Caudal Cerebellar Peduncle Evaluated with Magnetic Resonance Imaging.Neuroscience. 2020 Jul 15;439:255-267. doi: 10.1016/j.neuroscience.2019.06.042. Epub 2019 Jul 9. Neuroscience. 2020. PMID: 31299350
-
Quantitative temporal changes in DTI values coupled with histological properties in cuprizone-induced demyelination and remyelination.Neurochem Int. 2018 Oct;119:151-158. doi: 10.1016/j.neuint.2017.10.004. Epub 2017 Oct 10. Neurochem Int. 2018. PMID: 29030079
-
The role of oligodendrocytes and oligodendrocyte progenitors in CNS remyelination.Adv Exp Med Biol. 1999;468:183-97. doi: 10.1007/978-1-4615-4685-6_15. Adv Exp Med Biol. 1999. PMID: 10635029 Review.
-
Therapeutic Potential of GABAergic Signaling in Myelin Plasticity and Repair.Front Cell Dev Biol. 2021 Apr 6;9:662191. doi: 10.3389/fcell.2021.662191. eCollection 2021. Front Cell Dev Biol. 2021. PMID: 33889577 Free PMC article. Review.
Cited by
-
N-butyl-β-carboline-3-carboxylate (β-CCB) systemic administration promotes remyelination in the cuprizone demyelinating model in mice.Sci Rep. 2024 Jun 18;14(1):13988. doi: 10.1038/s41598-024-64501-x. Sci Rep. 2024. PMID: 38886527 Free PMC article.
-
Age-related auditory nerve deficits propagate central gain throughout the auditory system: Associations with cortical microstructure and speech recognition.bioRxiv [Preprint]. 2025 May 21:2025.05.19.654964. doi: 10.1101/2025.05.19.654964. bioRxiv. 2025. PMID: 40475667 Free PMC article. Preprint.
References
LinkOut - more resources
Full Text Sources
Miscellaneous