. 2024 Apr 17:6:1373003.
doi: 10.3389/ftox.2024.1373003. eCollection 2024.

The MexTAg collaborative cross: host genetics affects asbestos related disease latency, but has little influence once tumours develop

Affiliations

The MexTAg collaborative cross: host genetics affects asbestos related disease latency, but has little influence once tumours develop

Scott A Fisher et al. Front Toxicol. .

Abstract

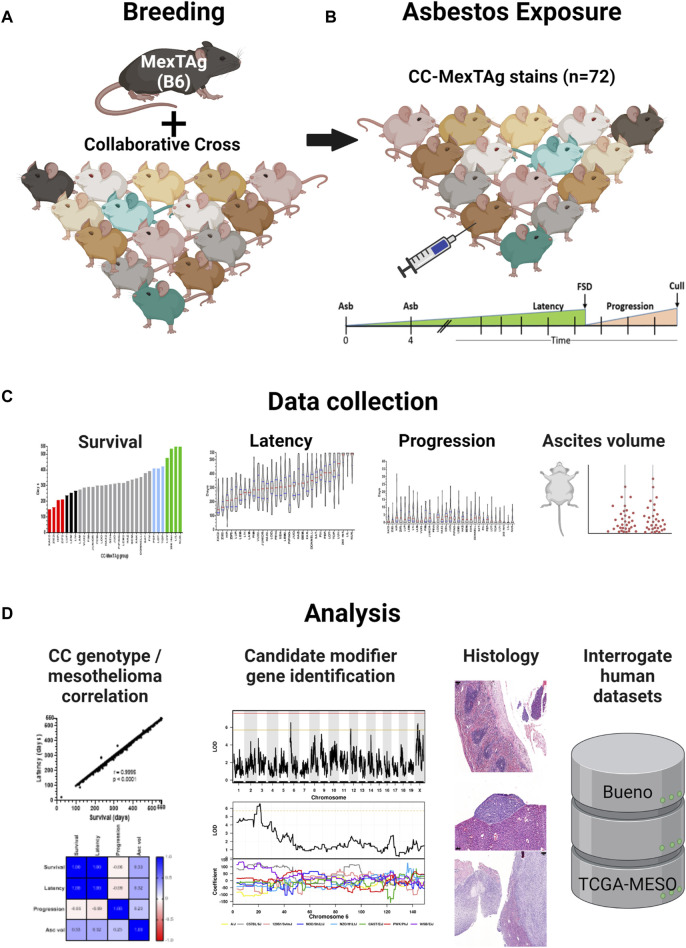
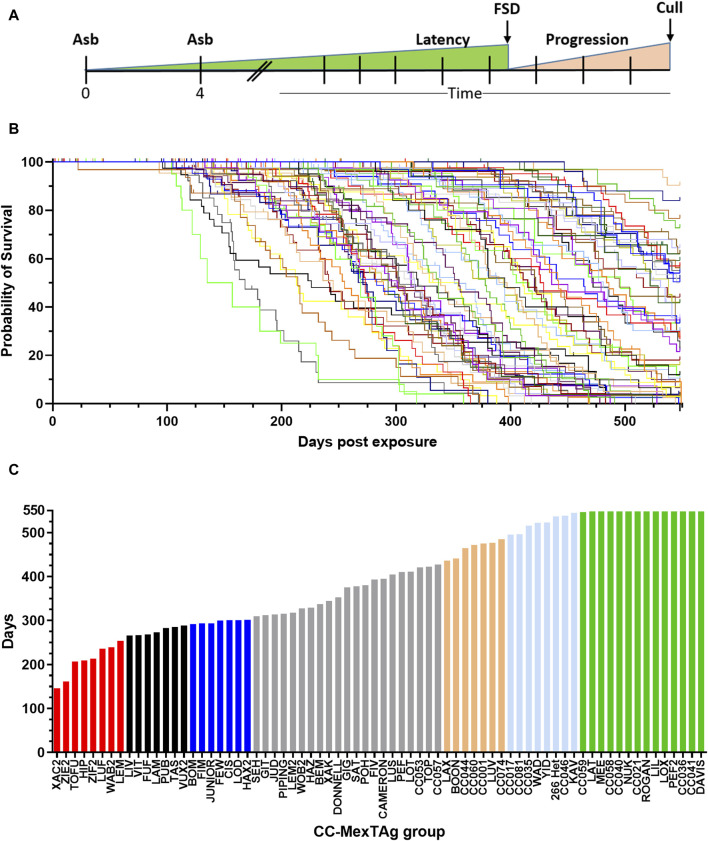
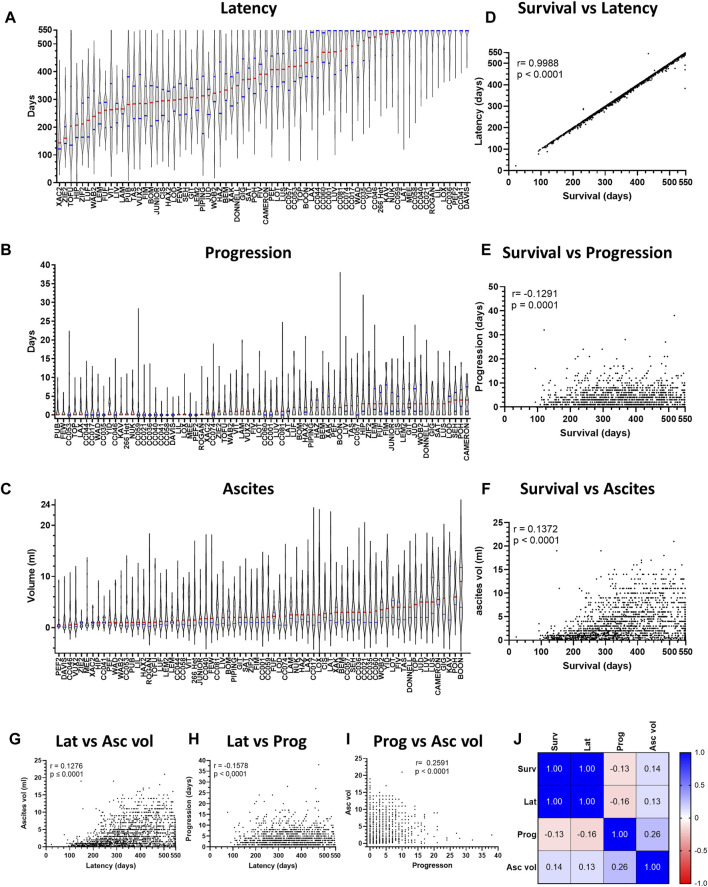
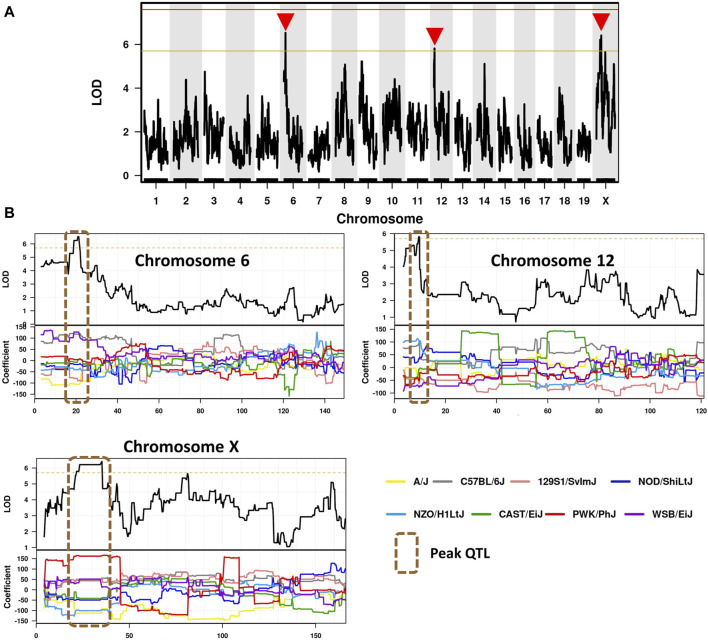
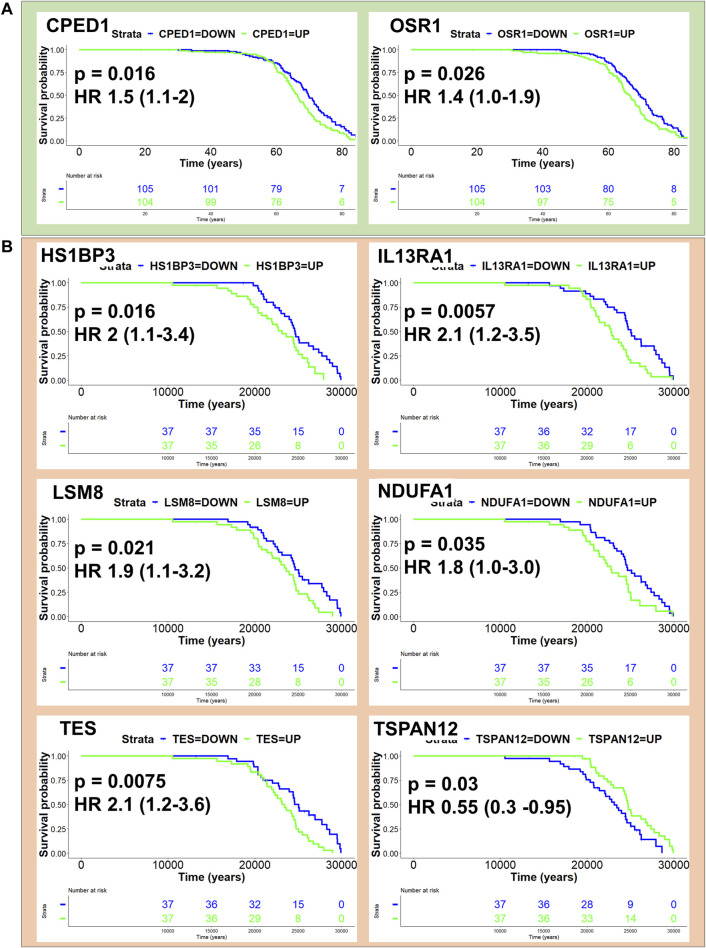
Objectives: This study combines two innovative mouse models in a major gene discovery project to assess the influence of host genetics on asbestos related disease (ARD). Conventional genetics studies provided evidence that some susceptibility to mesothelioma is genetic. However, the identification of host modifier genes, the roles they may play, and whether they contribute to disease susceptibility remain unknown. Here we report a study designed to rapidly identify genes associated with mesothelioma susceptibility by combining the Collaborative Cross (CC) resource with the well-characterised MexTAg mesothelioma mouse model. Methods: The CC is a powerful mouse resource that harnesses over 90% of common genetic variation in the mouse species, allowing rapid identification of genes mediating complex traits. MexTAg mice rapidly, uniformly, and predictably develop mesothelioma, but only after asbestos exposure. To assess the influence of host genetics on ARD, we crossed 72 genetically distinct CC mouse strains with MexTAg mice and exposed the resulting CC-MexTAg (CCMT) progeny to asbestos and monitored them for traits including overall survival, the time to ARD onset (latency), the time between ARD onset and euthanasia (disease progression) and ascites volume. We identified phenotype-specific modifier genes associated with these traits and we validated the role of human orthologues in asbestos-induced carcinogenesis using human mesothelioma datasets. Results: We generated 72 genetically distinct CCMT strains and exposed their progeny (2,562 in total) to asbestos. Reflecting the genetic diversity of the CC, there was considerable variation in overall survival and disease latency. Surprisingly, however, there was no variation in disease progression, demonstrating that host genetic factors do have a significant influence during disease latency but have a limited role once disease is established. Quantitative trait loci (QTL) affecting ARD survival/latency were identified on chromosomes 6, 12 and X. Of the 97-protein coding candidate modifier genes that spanned these QTL, eight genes (CPED1, ORS1, NDUFA1, HS1BP3, IL13RA1, LSM8, TES and TSPAN12) were found to significantly affect outcome in both CCMT and human mesothelioma datasets. Conclusion: Host genetic factors affect susceptibility to development of asbestos associated disease. However, following mesothelioma establishment, genetic variation in molecular or immunological mechanisms did not affect disease progression. Identification of multiple candidate modifier genes and their human homologues with known associations in other advanced stage or metastatic cancers highlights the complexity of ARD and may provide a pathway to identify novel therapeutic targets.

Keywords: MexTAg; asbestos related disease; collaborative cross; gene discovery; host genetics; mesothelioma; mouse model.


Conflict of interest statement

The authors declare that the research was conducted in the absence of any commercial or financial relationships that could be construed as a potential conflict of interest.

Figures

FIGURE 1
FIGURE 1
CC-MexTAg (CCMT) experimental schema: (A) Female 266Hom MexTAg mice were crossed with male mice from 71 distinct collaborative cross (CC) strains and, (B) the resultant CCMT progeny (n = 2,565 mice total) exposed to crocidolite asbestos via two intraperitoneal injections (6 mg total) 4 weeks apart. Mice were assessed for asbestos related disease (ARD) development and culled at predefined welfare endpoints or at a maximum of 18 months (548 days) after first asbestos exposure, whichever occurred first. (C) Phenotypic data were collected on overall survival, asbestos related disease latency/progression and ascites volume. (D) Asbestos related disease was confirmed on histology and correlative analyses on phenotypic traits performed. Figure created with BioRender.com.
FIGURE 2
FIGURE 2
Variable overall survival in asbestos exposed CCMT mice. 71 groups of CCMT mice and the heterozygous parental 266-MexTAg (266-Het) control group were exposed to asbestos and monitored for asbestos related disease (ARD) development over 18 months (548 days). (A) Experimental schematic, (B) Kaplan-Myer plot (each line represents a CCMT or MexTAg (B6) control group) and (C) ranked median survival data demonstrating a 3.75-fold difference in overall median survival between asbestos exposed CCMT groups. (B,C) Data shows asbestos related disease associated median survival (days from first asbestos exposure to cull, n = 2,245 mice. Non-ARD deaths have been censored). For ranked median survival (C) percentiles indicated by colour; red ≤10%, black 11%–20%, blue 21%–30%, gold = 70–79%, light blue = 80–89% and green ³ 90%. FSD = first signs of disease.
FIGURE 3
FIGURE 3
Variation in overall survival is revealed during ARD latency, but not progression. Violin plots depicting variation in disease (A) latency and (B) progression and (C) ascites volume for asbestos exposed CCMT groups. Data ranked by Red bars = median. Blue bars = quartiles. (D–F) Plots depict correlation between overall survival (x-axis) and ARD latency, progression, and ascites volume respectively. (G–I) Plots depict correlation between respective phenotypic traits. For plots D to I, each dot represents an individual mouse with ARD. (J) Heat map correlation matrix for respective phenotypic traits. r = Pearson’s coefficient. Asc vol = ascites volume, Lat = latency, Prog = progression, Surv = survival.
FIGURE 4
FIGURE 4
CCMT asbestos related disease histology. Representative images of benign (A,C,E,G,I) and malignant (B,D,F,H,J) features (red arrows) from histological assessment of 403 asbestos exposed CCMT mice. Benign features include (A) thickening, (C) plaque formation, (E) paucicellular regions, (G) giant cell presence and (I) regular nuclei. Malignant features include (B) overt tumour, (D) hypercellularity, (F) nuclear atypia (multiple nucleoli, coarse chromatin), (H) mitotic figures and (J) invasion. Scale bars; 20 µm (F,G,H,I); 50 µm (D); 100 µm (A,C,E); 200 µm (J) and 500 µm (B). Overt tumour (B,J) is of sarcomatoid subtype.
FIGURE 5
FIGURE 5
Identification of CCMT candidate modifier genes. (A) Genome-wide scan based on median survival/latency in 71 asbestos exposed CCMT strains depicting highly suggestive QTL on chromosomes 6, 12 and X (red arrows). Genotyping, construction of CC strain haplotypes, and linkage analysis were performed as previously described (Ram et al., 2014). Phenotype data was analysed using the GeneMiner MugaQTL(as is) setting. The x-axis shows the chromosomal position, and the y-axis shows the 2log10(P) values; the p-values were derived from the linkage haplotype data. (B) Top: Plot of LOD scores along chromosomes 6, 12 and X. Bottom: Founder allele coefficients: plot of the calculated log-odds ratio of eight founder alleles over the chromosome where the founders are color-coded. Dotted line highlights chromosomal region containing peak QTL.
FIGURE 6
FIGURE 6
Homologues of CCMT candidate modifier genes influence human mesothelioma. Kaplan Myer plots depicting human homologues of CCMT candidate modifier genes with p-value < 0.05 and their effect on patient outcome in (A) Bueno (green) and (B) TCGA mesothelioma cohorts. KM survival analysis performed using the “survminer” R package.

Similar articles

Cited by

References

    1. Akarsu M., Ak G., Dundar E., Metintas M. (2023). Genetic analysis of familial predisposition in the pathogenesis of malignant pleural mesothelioma. J. Cancer Res. Clin. Oncol. 149 (10), 7767–7778. 10.1007/s00432-023-04730-1 - DOI - PMC - PubMed
    1. Au H. C., Seo B. B., Matsuno-Yagi A., Yagi T., Scheffler I. E. (1999). The NDUFA1 gene product (MWFE protein) is essential for activity of complex I in mammalian mitochondria. Proc. Natl. Acad. Sci. U. S. A. 96 (8), 4354–4359. 10.1073/pnas.96.8.4354 - DOI - PMC - PubMed
    1. Australia Co: Australian code for the care and use of animals for scientific purposes. In. Edited by N. H. M. R. Council, 8th edn. Canberra: Commonwaealth or Australia; 2013.
    1. Behrouzfar K., Burton K., Mutsaers S. E., Morahan G., Lake R. A., Fisher S. A. (2021). How to better understand the influence of host genetics on developing an effective immune response to thoracic cancers. Front. Oncol. 11, 679609. 10.3389/fonc.2021.679609 - DOI - PMC - PubMed
    1. Benjamini Y., Drai D., Elmer G., Kafkafi N., Golani I. (2001). Controlling the false discovery rate in behavior genetics research. Behav. Brain Res. 125 (1-2), 279–284. 10.1016/s0166-4328(01)00297-2 - DOI - PubMed

LinkOut - more resources