. 2024 Mar 4:11:20556683241234858.
doi: 10.1177/20556683241234858. eCollection 2024 Jan-Dec.

Is a portable pressure plate an alternative to force plates for measuring postural stability and interlimb coordination of quiet standing balance control?

Affiliations

Is a portable pressure plate an alternative to force plates for measuring postural stability and interlimb coordination of quiet standing balance control?

Jonas Schröder et al. J Rehabil Assist Technol Eng. .

Abstract

Introduction: Center-of-pressure (COP) synchronization and symmetry can inform adaptations in balance control following one-sided sensorimotor impairments (e.g., stroke). As established force plates are impossible to transport, we aimed to criterion validate a portable pressure plate for obtaining reliable COP synchronization and symmetry measures, next to conventional postural stability measures.

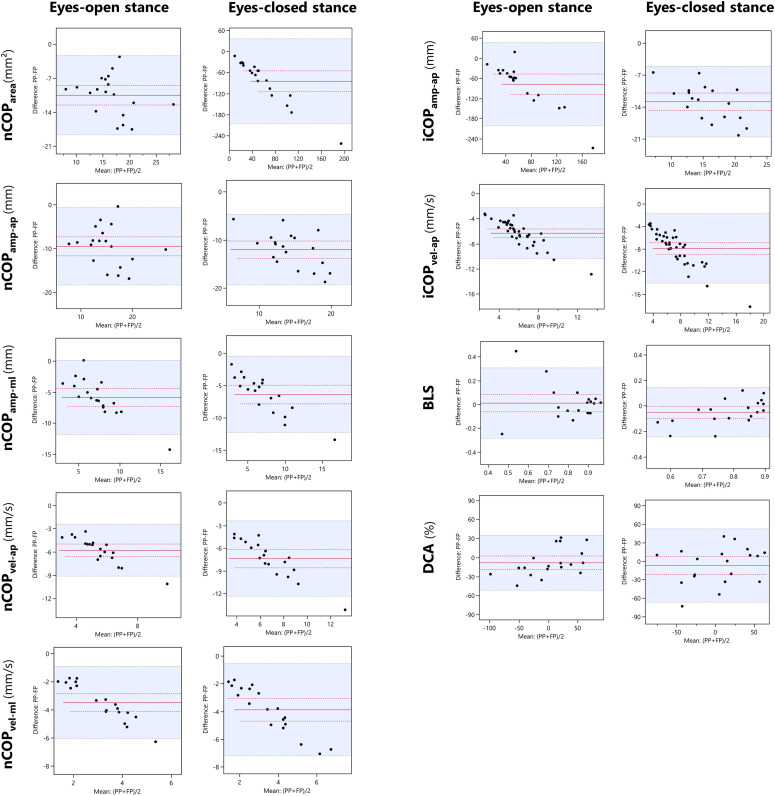
Methods: Twenty healthy adults participated. In a single session, three 40-s eyes-open and eyes-closed quiet stance trials were performed per plate-type, randomly ordered. Individual-limb COPs were measured to calculate between-limb synchronization (BLS) and dynamic control asymmetry (DCA). Net COP (i.e., limbs combined) area, amplitude, and velocity were used to describe anteroposterior (AP) and mediolateral (ML) postural stability. Criterion validity was evaluated using Spearman correlations (r) and Bland-Altman plots. Test-retest reliability was tested using intraclass correlation coefficients (ICC).

Results: Strong correlations (r > 0.75) and acceptable reliability (ICC > 0.80) were found regarding individual-limb COP velocity and DCA, net COP ML amplitude and AP and ML velocities. Bland-Altman plots yielded possible proportional bias; the pressure plate systematically underestimated COP scores by force plates and a larger error associated with a larger measurement.

Conclusions: Despite correlations between instruments and sufficient reliability for measuring postural stability and DCA, this technical note strongly suggests, due to a systematic deviation, using the same plate-type to accurately assess performance change within subjects longitudinally over time.

Keywords: Reliability and validity; biomechanics; center of pressure; force plate; postural balance; posturography.


Conflict of interest statement

The author(s) declared no potential conflicts of interest with respect to the research, authorship, and/or publication of this article.

Figures

Figure 1.
Figure 1.
Mean COP scores per participant measured with either a pressure plate or gold standard force plates. Peak-to-peak amplitude (amp, shown in purple) and root mean square velocity (vel, shown in green) of the COP in anteroposterior and mediolateral directions, recorded at the limbs separately (ie, left-sided and right-sided) and combined (ie, net), are plotted per individual subject (N = 19). Thicker bars reflect pressure plate scores and thinner bars reflect force plates as the gold standard. These bars are overlapped per participant to visually compare outcomes obtained from both instrument types for measuring COP when quiet standing.
Figure 2.
Figure 2.
Bland-Altman plots with subject-specific differences and mean scores between a pressure plate and two force plates as the gold standard. The Y-axis shows the subject-specific difference scores between the two measurement instruments, and the X-axis represents the mean scores per subject. Solid red lines represent the mean difference score of the entire group of healthy participants (N = 19), dotted red lines represent the standard error of the mean score, and blue dotted lines and the blue-colored area in-between represent the upper and lower ends of the limits of agreement. On the left, the net COP metrics reflecting postural stability are displayed. On the right, individual-limb COP and interlimb coordination metrics are displayed. A downwards shift of the mean scores deviating from the zero score, as can be observed in most of the shown figures, reflect a systematic difference with lower pressure plate value compared with force plates that increases relative to the magnitude of the measure (ie, proportional bias). PP, pressure plate; FP, force plates.

Similar articles

References

    1. Batchelor FA, Mackintosh SF, Said CM, et al. Falls after stroke. Int J Stroke 2012; 7: 482–490. DOI: 10.1111/j.1747-4949.2012.00796.x. - DOI - PubMed
    1. Buvarp D, Rafsten L, Abzhandadze T, et al. A cohort study on longitudinal changes in postural balance during the first year after stroke. BMC Neurol 2022; 22: 324–2022. DOI: 10.1186/s12883-022-02851-7. - DOI - PMC - PubMed
    1. Blum L, Korner-Bitensky N. Usefulness of the Berg balance scale in stroke rehabilitation: a systematic review. Phys Ther 2008; 88: 559–566. DOI: 10.2522/ptj.20070205. - DOI - PubMed
    1. Garland SJ, Ivanova TD, Mochizuki G. Recovery of standing balance and health-related quality of life after mild or moderately severe stroke. Arch Phys Med Rehabil 2007; 88: 218–227. DOI: 10.1016/j.apmr.2006.11.023. - DOI - PubMed
    1. Patterson KK, Inness E, McIlroy WE, et al. A retrospective analysis of post-stroke Berg balance scale scores: how should normal and at-risk scores be interpreted? Physiother Can 2017; 69: 142–149. DOI: 10.3138/ptc.2015-73. - DOI - PMC - PubMed