. 2024 Apr 17:15:1366453.
doi: 10.3389/fgene.2024.1366453. eCollection 2024.

Identification of immune-related biomarkers for glaucoma using gene expression profiling

Affiliations

Identification of immune-related biomarkers for glaucoma using gene expression profiling

Dangdang Wang et al. Front Genet. .

Abstract

Introduction: Glaucoma, a principal cause of irreversible vision loss, is characterized by intricate optic neuropathy involving significant immune mechanisms. This study seeks to elucidate the molecular and immune complexities of glaucoma, aiming to improve our understanding of its pathogenesis. Methods: Gene expression profiles from glaucoma patients were analyzed to identify immune-related differentially expressed genes (DEGs). Techniques used were weighted gene co-expression network analysis (WGCNA) for network building, machine learning algorithms for biomarker identification, establishment of subclusters related to immune reactions, and single-sample gene set enrichment analysis (ssGSEA) to explore hub genes' relationships with immune cell infiltration and immune pathway activation. Validation was performed using an NMDA-induced excitotoxicity model and RT-qPCR for hub gene expression measurement. Results: The study identified 409 DEGs differentiating healthy individuals from glaucoma patients, highlighting the immune response's significance in disease progression. Immune cell infiltration analysis revealed elevated levels of activated dendritic cells, natural killer cells, monocytes, and immature dendritic cells in glaucoma samples. Three hub genes, CD40LG, TEK, and MDK, were validated as potential diagnostic biomarkers for high-risk glaucoma patients, showing increased expression in the NMDA-induced excitotoxicity model. Discussion: The findings propose the three identified immune-related genes (IRGs) as novel diagnostic markers for glaucoma, offering new insights into the disease's pathogenesis and potential therapeutic targets. The strong correlation between these IRGs and immune responses underscores the intricate role of immunity in glaucoma, suggesting a shift in the approach to its diagnosis and treatment.

Keywords: WGCNA; biomarkers; glaucoma; immune cell infiltration; immune-related genes; machine learning; subclusters.


Conflict of interest statement

The authors declare that the research was conducted in the absence of any commercial or financial relationships that could be construed as a potential conflict of interest.

Figures

FIGURE 1
FIGURE 1
DEGs between POAG and CON samples. (A,B) Principal component analysis (PCA) of the GSE2378 and GSE9944 dataset. The points of the scatter diagrams diaplay the samples based on the top two principal components (PC1 and PC2) of gene expression profiles without (A) and with (B) the removal of batch effect. The dots in the graph represent samples, and the colors represent corresponding samples different datasets. (C,D) Volcano plot showing DEGs in POAG patients versus healthy controls (C) and the heatmap of TOP40 differential genes (upregulated and downregulated, (D). POAG, primary open-angle glaucoma; CON, healthy controls.
FIGURE 2
FIGURE 2
Construction of the co-expression network. (A) The sample dendrogram and feature heat map were drawn based on the Euclidean distance using the average clustering method for hierarchical clustering of samples, with each branch representing a sample, Height in the vertical coordinate being the clustering distance, and the horizontal coordinate being the clinical grouping information. (B) Soft threshold (power = 20). (C) Gene hierarchy tree-clustering diagram. The graph indicates different genes horizontally and the uncorrelatedness between genes vertically, the lower the branch, the less uncorrelated the genes within the branch, i.e., the stronger the correlation. (D) Heatmap showing the relations between the module and POAG features. The values in the small cells of the graph represent the two-calculated correlation values cor coefficients between the eigenvalues of each trait and each module as well as the corresponding statistically significant p-values. Color corresponds to the size of the correlation; the darker the red, the more positive the correlation; the darker the blue, the more negative the correlation. (E) Scatter plot between gene significance (GS) and module membership (MM) in salmon.
FIGURE 3
FIGURE 3
Screening for Immune-related signature genes in POAG and functional enrichment analysis. (A) Venn diagram of the intersection of DEGs, salmon module genes, and Immune-related genes. (B) GO functional annotation of signature genes. (C) Functional annotation of the Kegg signaling pathway of signature genes. For all enriched GO and KEGG terms, p < 0.05.
FIGURE 4
FIGURE 4
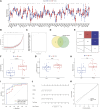
Screening of the Immune-related gene signature. (A) The expression of immune-related DEGs. (B,C) Construction of immune-related gene signature using LASSO and RF. (D) The overlap of genes in two machine learning. (E) Pairs plot showing the relationship between the immune-related gene signature. (F–H) Expression levels of three hub genes in POAG patients compared with healthy controls, *p < 0.05; ***p < 0.001. (I) ROC curve of immune-related hub genes in POAG diagnosis. DEGs, differentially expressed genes; LASSO, least absolute shrinkage and selection operator; RF, random forest; ROC, receiver operating characteristic. *p < 0.05; ***p < 0.001. (J) Nomogram for measuring the significance of immune in POAG based on hub genes. (K) Calibration curve plot for the nomogram. The X-axis represents the predictable probability, and the Y-axis represents the actual probability. Perfect prediction corresponds to the ideal dashed line. The apparent dashed line represents the entire queue, bias-corrected solid line is bias-corrected by bootstrapping (1,000 repetitions) and represents the observed performance of the nomogram. POAG, primary open-angle glaucoma; CON, healthy controls.
FIGURE 5
FIGURE 5
Analysis of immune infiltration in POAG patient samples and its correlation with hub genes using ssGSEA. (A) Box plot showing the immune proportion of 23 immune cells. (B) Correlation between immune cell infiltration and three hub genes. (C) Grouped box plot showing immune proportion of 23 immune cells in POAG patients and healthy controls. *p < 0.05, **p < 0.01, ***p < 0.001. POAG, primary open-angle glaucoma; CON, healthy controls.
FIGURE 6
FIGURE 6
Analysis of immune functions in POAG patient samples and their correlation with hub genes using ssGSEA. (A) Box plot showing immune proportion for 10 immune functions in POAG patients and healthy controls. (B) Association between immune cell function and three hub genes. (C) Grouped box plot showing immune proportion for 10 immune functions in POAG patients and healthy controls; *p < 0.05, **p < 0.01, ***p < 0.001. POAG, primary open-angle glaucoma; CON, healthy controls.
FIGURE 7
FIGURE 7
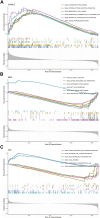
GSEA of KEGG enrichment analysis for the key genes. (A) GSEA of KEGG enrichment analysis for CD40LG. (B) GSEA of KEGG enrichment analysis for MDK. (C) GSEA of KEGG enrichment analyses for TEK. GSEA, gene set enrichment analysis. CD40 Ligand, CD40LG; Midkine, MDK; and TEK Receptor Tyrosine Kinase, TEK.
FIGURE 8
FIGURE 8
Identification of immune-related subtypes in glaucoma. Subclusters identified with the immune-related hub genes in dataset (A). Boxplot (B) showing the correlation between 18 immune cells and 10 immune functions in subtypes. CDF, cumulative distribution function. Cluster A, POAG with high risk; Cluster B, POAG with low risk.

Similar articles

Cited by

References

    1. Allison K., Patel D., Alabi O. (2020). Epidemiology of glaucoma: the past, present, and predictions for the future. Cureus 12, e11686. 10.7759/cureus.11686 - DOI - PMC - PubMed
    1. Bariş M., Tezel G. (2019). Immunomodulation as a neuroprotective strategy for glaucoma treatment. Curr. Ophthalmol. Rep. 7, 160–169. 10.1007/s40135-019-00212-1 - DOI - PMC - PubMed
    1. Baudouin C., Kolko M., Melik-Parsadaniantz S., Messmer E. M. (2021). Inflammation in Glaucoma: from the back to the front of the eye, and beyond. Prog. Retin Eye Res. 83, 100916. 10.1016/j.preteyeres.2020.100916 - DOI - PubMed
    1. Brigell M., Withers B., Buch A., Peters K. G. (2022). Tie2 activation via VE-PTP inhibition with razuprotafib as an adjunct to latanoprost in patients with open angle glaucoma or ocular hypertension. Transl. Vis. Sci. Technol. 11, 7. 10.1167/tvst.11.1.7 - DOI - PMC - PubMed
    1. Campbell W. A., Fritsch-Kelleher A., Palazzo I., Hoang T., Blackshaw S., Fischer A. J. (2021). Midkine is neuroprotective and influences glial reactivity and the formation of Müller glia-derived progenitor cells in chick and mouse retinas. Glia 69, 1515–1539. 10.1002/glia.23976 - DOI - PMC - PubMed