. 2024 Jun 12;15(6):e0073624.
doi: 10.1128/mbio.00736-24. Epub 2024 May 2.

Phenotypic and transcriptional changes in peripheral blood mononuclear cells during alphavirus encephalitis in mice

Affiliations

Phenotypic and transcriptional changes in peripheral blood mononuclear cells during alphavirus encephalitis in mice

Benjamin H Nguyen et al. mBio. .

Abstract

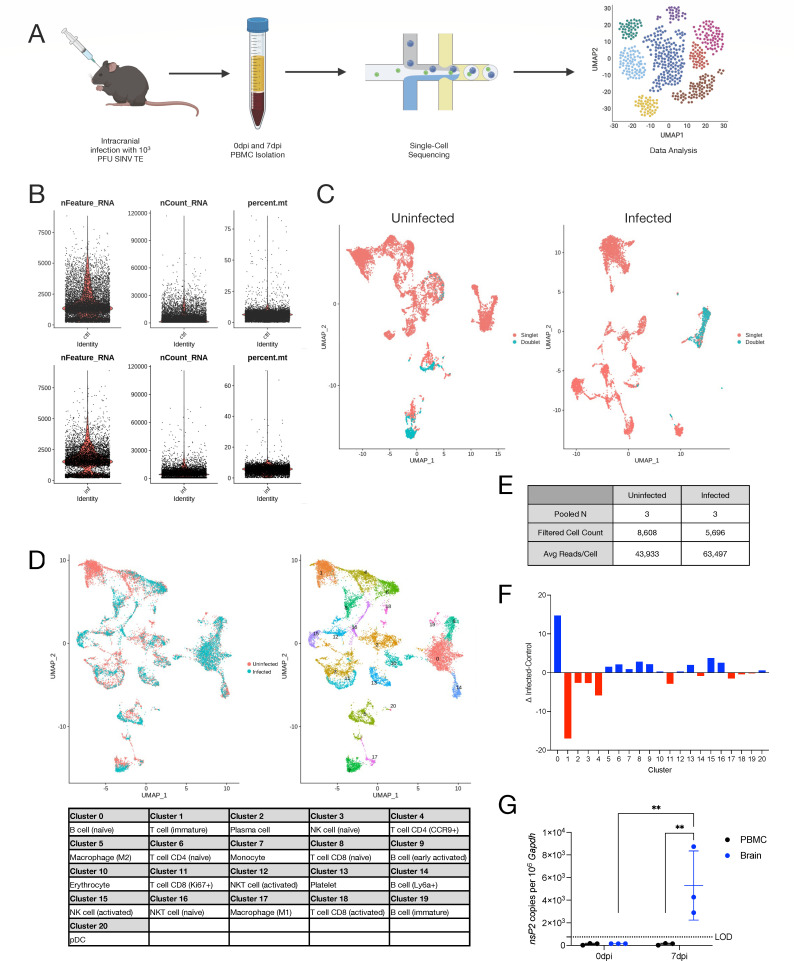
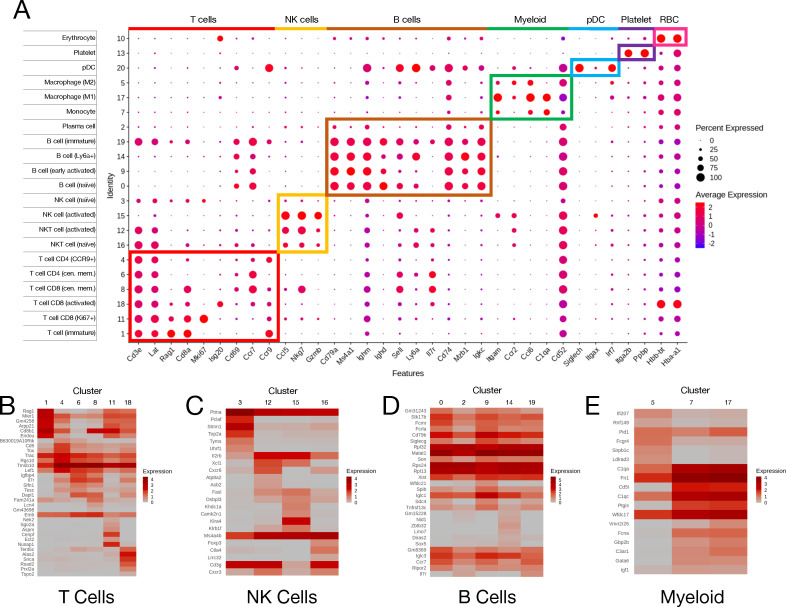
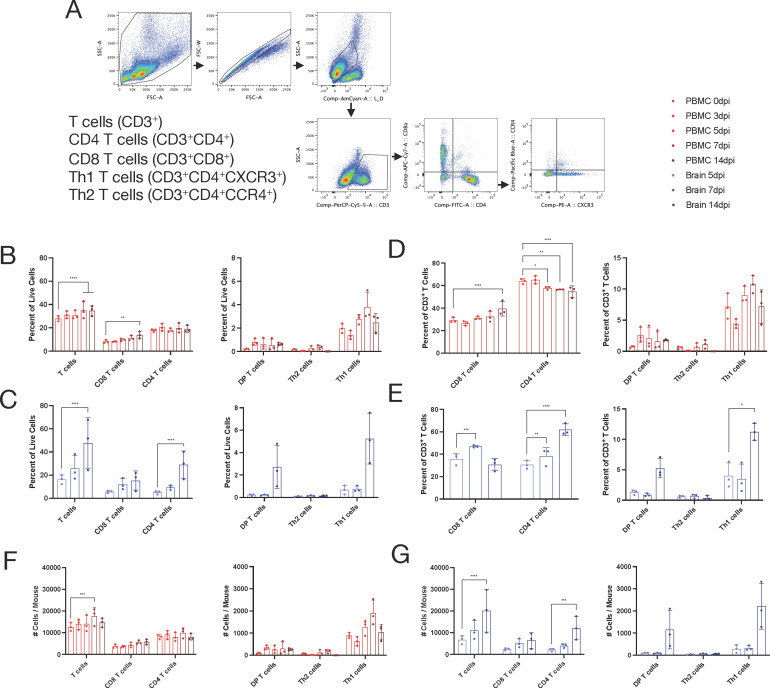
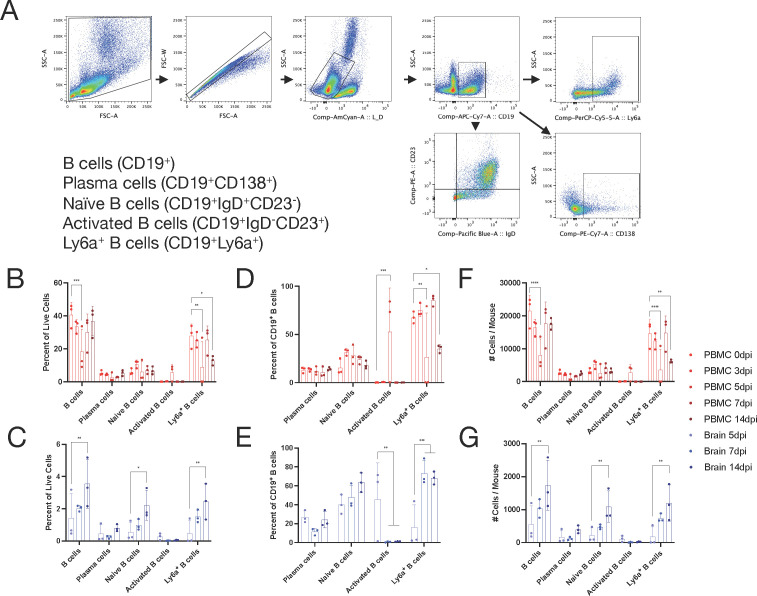
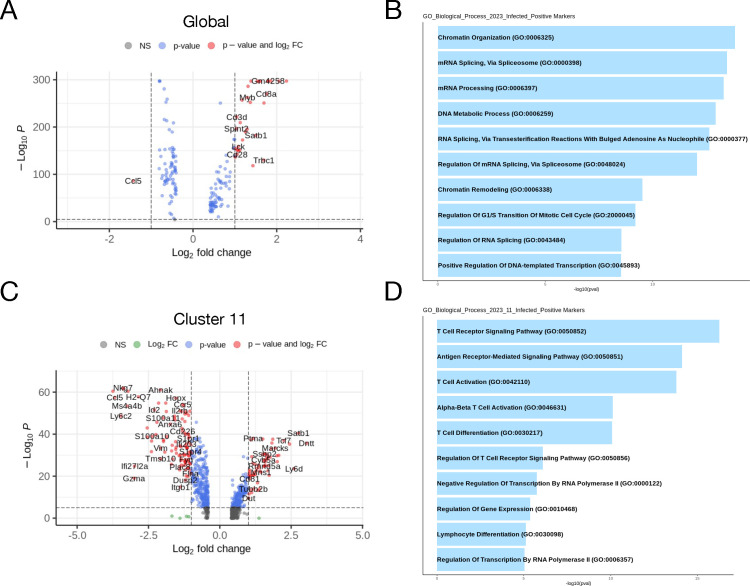
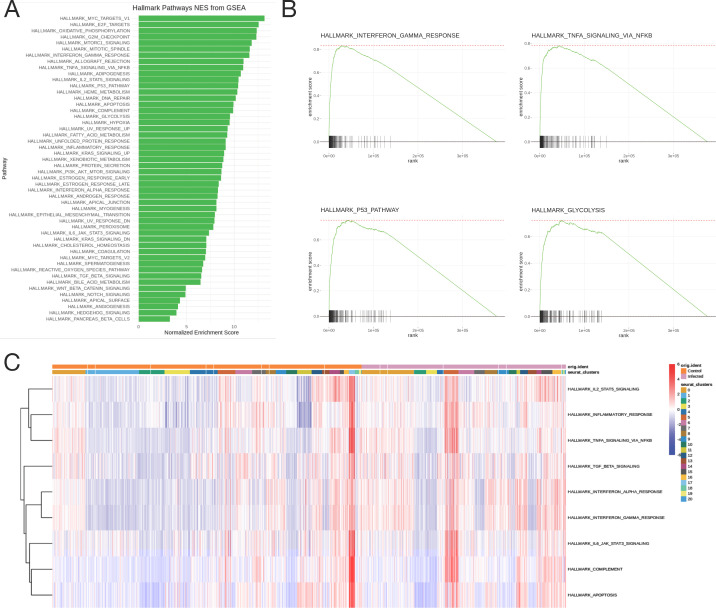
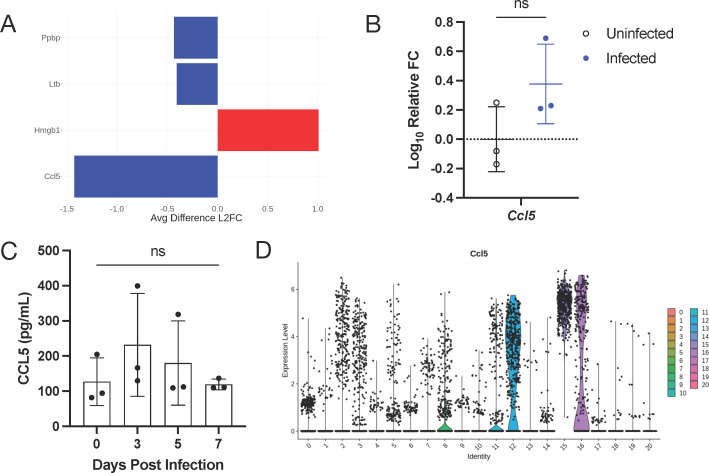
Sindbis virus (SINV) infection of mice provides a model system for studying the pathogenesis of alphaviruses that infect the central nervous system (CNS) to cause encephalomyelitis. While studies of human viral infections typically focus on accessible cells from the blood, this compartment is rarely evaluated in mice. To bridge this gap, single-cell RNA sequencing (scRNAseq) was combined with flow cytometry to characterize the transcriptional and phenotypic changes of peripheral blood mononuclear cells (PBMCs) from SINV-infected mice. Twenty-one clusters were identified by scRNAseq at 7 days after infection, with a unique cluster and overall increase in naive B cells for infected mice. Uninfected mice had fewer immature T cells and CCR9+ CD4 T cells and a unique immature T cell cluster. Gene expression was most altered in the Ki67+ CD8 T cell cluster, with chemotaxis and proliferation-related genes upregulated. Global analysis indicated metabolic changes in myeloid cells and increased expression of Ccl5 by NK cells. Phenotypes of PBMCs and cells infiltrating the CNS were analyzed by flow cytometry over 14 days after infection. In PBMCs, CD8 and Th1 CD4 T cells increased in representation, while B cells showed a transient decrease at day 5 in total, Ly6a+, and naive cells, and an increase in activated B cells. In the brain, CD8 T cells increased for the first 7 days, while Th1 CD4 T cells and naive and Ly6a+ B cells continued to accumulate for 14 days. Therefore, dynamic immune cell changes can be identified in the blood as well as the CNS during viral encephalomyelitis.

Importance: The outcome of viral encephalomyelitis is dependent on the host immune response, with clearance and resolution of infection mediated by the adaptive immune response. These processes are frequently studied in mouse models of infection, where infected tissues are examined to understand the mechanisms of clearance and recovery. However, studies of human infection typically focus on the analysis of cells from the blood, a compartment rarely examined in mice, rather than inaccessible tissue. To close this gap, we used single-cell RNA sequencing and flow cytometry to profile the transcriptomic and phenotypic changes of peripheral blood mononuclear cells (PBMCs) before and after central nervous system (CNS) infection in mice. Changes to T and B cell gene expression and cell composition occurred in PBMC and during entry into the CNS, with CCL5 being a differentially expressed chemokine. Therefore, dynamic changes occur in the blood as well as the CNS during the response of mice to virus infection, which will inform the analysis of human studies.

Keywords: Sindbis virus; inflammation; peripheral blood mononuclear cells; scRNAseq; viral encephalitis.


Conflict of interest statement

D.E.G. is on an advisory board for GSK and consulted for Merck.

Figures

Fig 1
Fig 1
Single-cell RNA sequencing of PBMCs from SINV-infected mice. (A) Graphical abstract detailing experimental setup for single-cell RNA sequencing. (B) Quality control parameters examined for filtering were gene counts (left), read counts (center), and mitochondrial genes (right) for control (top) and infected (bottom) mice. (C) Doublets in the sequencing data that were filtered out visualized on a UMAP plot for control (left) and infected (right) mice. (D) Aggregate UMAP plot showing cell clusters present in circulating PBMCs striated by infected status (left) and cell type (right) with cell type identities corresponding to each cluster number (bottom). (E) Data table summarizing sample details and sequencing metrics. (F) Compositional changes for each cell type calculated as the difference between infected and control proportions for each cluster. (G) qRT-PCR for SINV nsP2 expression in PBMCs and brains. Data are presented as the mean ± SD from two independent experiments with the cells pooled from four to seven mice. The limit of detection (LOD) is indicated with a dashed line. Samples with undetected transcripts were assigned a value of 150. No indicator, non-significant, *P < 0.05, **P < 0.01, ***P < 0.001, and ****P < 0.0001; Fisher’s LSD multiple comparisons test.
Fig 2
Fig 2
PBMC cluster annotation identifies seven major cell types. (A) DotPlot of markers used to identify super-cluster and subcluster identities. Dot size represents the frequency of cells expressing the gene in a cluster, while the color intensity represents the level of expression of that gene. Boxes highlight super-clusters and genes used to identify them and the subclusters within them. (B–E) Heatmaps of the top six genes used as markers for each cluster relative to the rest of the data set for T cells (B), NK cells (C), B cells (D), and myeloid cells (E).
Fig 3
Fig 3
T cell population changes in the blood correlate with infiltration into the brain. (A) T cell gating scheme for analysis. (B–G) Identification by flow cytometry of T cells in the blood (red) or brain (blue) over the course of infection at 0, 3, 5, 7, and 14 dpi (blood) or 5, 7, and 14 dpi (brain). The subpopulations are presented as either a percentage of all live cells (B and C), a percentage of CD3+ T cells (D and E), or the total number of cells per mouse (F and G) with the mean ± SD from three independent experiments with the cells pooled from four to seven mice. No indicator, non-significant, *P < 0.05, **P < 0.01, ***P < 0.001, and ****P < 0.0001; Dunnett’s multiple comparisons test.
Fig 4
Fig 4
B cell population dynamics in the blood and brain. (A) B cell gating scheme for analysis. (B–G) Identification by flow cytometry of B cells in circulating blood (red) or brain (blue) over the course of infection at 0, 3, 5, 7, and 14 dpi (blood) or 5, 7, and 14 dpi (brain). The subpopulations are presented as either a percentage of all live cells (B and C), a percentage of CD19+ B cells (D and E), or the total number of cells per mouse (F and G) with the mean ± SD from three independent experiments with the cells pooled from four to seven mice. No indicator, non-significant, *P < 0.05, **P < 0.01, ***P < 0.001, and ****P < 0.0001; Dunnett’s multiple comparisons test.
Fig 5
Fig 5
Transcriptomic signature of circulating immune cells during viral encephalitis. (A and C) Volcano plots representing differentially expressed genes between control and infected mice globally (A) or within cluster 11 (C). Results were calculated using the FindMarkers function in Seurat specifying the Wilcoxon rank-sum test with genes detected in 25% of cells and at least 1.5-log-fold change between groups. (B and D) Pathway visualization bar plot of differentially expressed genes using the GO biological process database.
Fig 6
Fig 6
Gene set enrichment analysis. (A) Normalized enrichment scores from GSEA of the 50 hallmark gene sets from the MSigDB. (B) Enrichment plots for key immune pathways—IFNγ pathway (top left), TNFα pathway via NF-κB (top right), p53 pathway (bottom left), and glycolysis pathway (bottom right). The black lines represent the position of genes in each pathway in a ranked list of differentially expressed genes, and the area under the curve represents the total enrichment of response genes. (C) Heatmap showing enrichment scores of hallmark immune pathways in individual cells striated by cluster and infection status.
Fig 7
Fig 7
Serum cytokines of viral encephalitis. (A) Differentially expressed cytokines in scSeq data with at least 1.5 LFC relative to the entire data set and expressed in at least 25% of cells. Data are presented as differences in LFC between control and infected, where negative numbers indicate higher expression in the infected mice. (B) qRT-PCR for Ccl5 expression in all PBMCs. Data are presented as the mean ± SD from two independent experiments with the cells pooled from four to seven mice. (C) Serum levels of CCL5 detected by ELISA. (D) Expression of Ccl5 striated by individual clusters. ns, non-significant; unpaired t-test (qRT-PCR) and Tukey’s multiple comparisons test (ELISA).

References

    1. Gubler DJ. 2002. The global emergence/resurgence of arboviral diseases as public health problems. Arch Med Res 33:330–342. doi:10.1016/s0188-4409(02)00378-8 - DOI - PubMed
    1. Salimi H, Cain MD, Klein RS. 2016. Encephalitic arboviruses: emergence, clinical presentation, and neuropathogenesis. Neurotherapeutics 13:514–534. doi:10.1007/s13311-016-0443-5 - DOI - PMC - PubMed
    1. Doughty CT, Yawetz S, Lyons J. 2017. Emerging causes of arbovirus encephalitis in North America: powassan, chikungunya, and zika viruses. Curr Neurol Neurosci Rep 17:12. doi:10.1007/s11910-017-0724-3 - DOI - PubMed
    1. Griffin DE. 2010. Emergence and re-emergence of viral diseases of the central nervous system. Prog Neurobiol 91:95–101. doi:10.1016/j.pneurobio.2009.12.003 - DOI - PMC - PubMed
    1. Griffin DE. 2011. Viral encephalomyelitis. PLoS Pathog 7:e1002004. doi:10.1371/journal.ppat.1002004 - DOI - PMC - PubMed

MeSH terms

LinkOut - more resources