. 2024 Jul 1;223(7):e202401041.
doi: 10.1083/jcb.202401041. Epub 2024 May 2.

Microglial TNFα controls daily changes in synaptic GABAARs and sleep slow waves

Affiliations

Microglial TNFα controls daily changes in synaptic GABAARs and sleep slow waves

Maria Joana Pinto et al. J Cell Biol. .

Abstract

Microglia sense the changes in their environment. How microglia actively translate these changes into suitable cues to adapt brain physiology is unknown. We reveal an activity-dependent regulation of cortical inhibitory synapses by microglia, driven by purinergic signaling acting on P2RX7 and mediated by microglia-derived TNFα. We demonstrate that sleep induces microglia-dependent synaptic enrichment of GABAARs in a manner dependent on microglial TNFα and P2RX7. We further show that microglia-specific depletion of TNFα alters slow waves during NREM sleep and blunt memory consolidation in sleep-dependent learning tasks. Together, our results reveal that microglia orchestrate sleep-intrinsic plasticity of synaptic GABAARs, sculpt sleep slow waves, and support memory consolidation.


Conflict of interest statement

Disclosures: The authors declare no competing financial interests.

Figures

Figure 1.
Figure 1.
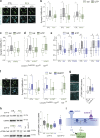
Plasticity of GABAAR in light versus dark is sleep- and microglia-dependent. (a) Experimental groups: mice in dark phase (ZT18), mice in light phase (ZT6), and mice submitted to sleep deprivation (dashed) in the light phase (SD6). Vertical bars: time of perfusion. (b) Representative images showing enrichment of GABAARγ2 (cyan) at cortical L1 inhibitory synapses in the light phase (ZT6). Arrowheads: GABAARγ2 clusters at gephyrin+VGAT+ synapses in control (CTL) or PLX3397-treated mice (PLX). Scale bars, 5 and 1 μm. The dashed box corresponds to CTL at ZT18. (c and d) Mean intensity of GABAARγ2 clusters at gephyrin+VGAT+ synapses (synaptic) and at extrasynaptic sites normalized to ZT18. n = 48–65 fields of view (FOVs) from 4 to 5 mice per group. *P < 0.05, nested two-tailed t test; **P < 0.01 compared with ZT18 and ##P < 0.01 compared with SD6, nested one-way ANOVA followed by Sidak’s multiple comparison test. (e) Left: Representative confocal images of VGAT and GABAARγ2 in cortical L5. Yellow line delineates soma identified by NeuN staining. Scale bar, 5 μm. Right: Mean intensity of GABAARγ2 at somatic VGAT+ clusters in L5 normalized to ZT18. n = 60 FOVs from five mice per group. No statistical significance by nested two-tailed t test. (c–e) Results are presented as minimum to maximum box plots.
Figure S1.
Figure S1.
AMPARs plasticity across the light/dark cycle. (a) Confocal images showing downregulation of GluA2 (cyan) at Homer1+ clusters (magenta, arrowheads) at ZT6 in cortical L1. Scale bars, 5 and 1 μm. (b) Left: Mean intensity of GluA2 clusters at Homer1+ clusters. No statistical significance by nested two-tailed t test. Right: Cumulative fraction of GluA2 clusters’ intensities at Homer1+ clusters in control CTL (black) and PLX3397 treated (green) mice. ****P < 0.0001, Kolmogorov–Smirnoff test. (c) Left: Mean intensity of GluA2 at extrasynaptic sites. No statistical significance by nested two-tailed t test. Right: Cumulative fraction of GluA2 clusters’ intensities at extrasynaptic sites in controls CTL (black) and PLX3397 treated (green) mice. No statistical significance by Kolmogorov–Smirnoff test. (d) Fraction of Homer1+ clusters colocalized with GluA2 in controls CTL (black) and PLX3397 treated (green) mice. No statistical significance by nested two-tailed t test. (b–d) n = 46-58 FOVs from four to five mice per group. Results are presented as minimum to maximum box plots and cumulative distributions.
Figure S2.
Figure S2.
GABAARs plasticity across the light/dark cycle. (a) Left: Confocal images of Iba1+ cells revealing partial depletion in the brain, but not in the spleen, by 2-wk feeding with PLX3397-containing food (PLX). Scale bars, 200 μm. Right: Density of Iba1+ cells normalized to CTL. n = 5 mice for CTL and PLX. **P < 0.01, unpaired two-tailed Mann–Whitney test. Data are mean ± SEM. (b) Left: Cumulative fraction of GABAARγ2 clusters’ intensities at gephyrin+VGAT+ synapses in cortical L1. ****P < 0.0001, Kolmogorov–Smirnoff. (c) Representative confocal images showing increase of GABAARα1 (cyan) at cortical L1 inhibitory synapses (arrowhead: gephyrin+VGAT+) at ZT6 in comparison to ZT18. Scale bars, 5 and 1 μm. Dashed box corresponds to enlarged detail in ZT18. (d) Left: Mean intensity of GABAARα1 clusters at gephyrin+VGAT+ synapses (synaptic) and at extrasynaptic sites. *P < 0.05, nested two-tailed t test. Right: Cumulative fraction of GABAARα1 clusters’ intensities at gephyrin+VGAT+ synapses. ****P < 0.0001, Kolmogorov–Smirnoff test. (e) Fraction of gephyrin+VGAT+ synapses colocalized to GABAARs clusters. *P < 0.05 and **P < 0.01, nested two-tailed t test. (f) Fraction of somatic VGAT+ cluster colocalized to GABAARγ2 clusters in cortical L5. No statistical significance by nested two-tailed t test. (g) Mean intensity of total GABAARγ2 (left) and GABAARα1 signal (right). No statistical significance by nested two-tailed t test. (b–g) n = 53-60 FOVs from 5 mice per group. Results are presented as minimum to maximum box plots. (h–j) Amounts of vigilance states over 24 h in controls CTL (black) and PLX3397 treated (green) mice in Wake (h), NREMS (i), and REMS (j). Left panels: Amounts were reported by 2 h segments. Two-way rANOVA; Wake: treatment, F(1,14) = 4.128, P = 0.062; time: F(4.253,59.54) = 46.97, P < 0.0001; interaction F(11,154) = 1.751, P = 0.067; NREMS, treatment, F(1,14) = 3.596, P = 0.079; time: F(11,154) = 15.32, P < 0.0001; interaction F(11,154) = 1.452, P = 0.155, REMS, treatment, F(1,14) = 1.578, P = 0.2296; time: F(3.267,45.73) = 22.47, P < 0.0001; interaction F(11,154) = 0.650, P = 0.7832. Right panels: amounts were reported by 12 h segments. Mann–Whitney tests, **P < 0.01 CTL versus PLX3397. CTL, seven mice; PLX3397 treated, nine mice. Data are represented as mean ± SEM. In agreement with previous work (Corsi et al., 2022; Liu et al., 2021) microglia depletion affects time in wake and NREM sleep only in the dark phase.
Figure 2.
Figure 2.
Microglial P2RX7-TNFα signaling drives GABAARs synaptic enrichment through CaMKIIα phosphorylation. (a) Representative confocal images showing increase of GABAARα1 (cyan) at gephyrin+ clusters (arrowheads) upon NMDA-induced inhibitory long-term potentiation (iLTP: 2 min 20 μM NMDA/10 μM CNQX plus 20 min recovery) in organotypic slices cortical L1 (CTL: control; bsl: baseline). Scale bars, 1 μm. (b–e) Mean intensity of GABAARα1 clusters at gephyrin+ cluster normalized to CTL at bsl. n = FOVs/independent experiments: (b) n = 44–69/5–6; (c) n = 47–53/5; (d) n = 66–102/5–7; (e) n = 49–68/7–9. *P < 0.05, **P < 0.01 and ***P < 0.001, nested one-way ANOVA followed by Sidak’s multiple comparison test. iLTP-induced synaptic GABAAR enrichment is abolished by: b, microglia depletion/inactivation (PLX: PLX3397; SAP: Mac1-saporin; minoc: minocycline); c, neutralization of TNFα (nTNFα); d, microglia-specific TNFα deletion through 4-hydroxy-tamoxifen (4-OHT)-induced recombination on CX3CR1CreERT2/+:TNFf/f but not on a TNFf/f background; e, ATP hydrolysis (apy), P2RX antagonist (PPADS) and P2RX7 antagonist (A74), but not P2Y12R inhibitor (PSB). (f) Left: Confocal images of GABAARα1 (cyan) at gephyrin+ clusters (arrowheads) in bsl and upon BzATP treatment. Scale bars, 1 μm. Right: Mean intensity of GABAARα1 clusters at gephyrin+ clusters normalized to CTL at bsl. n = 49–63/5–6. *P < 0.05, **P < 0.01, nested one-way ANOVA followed by Sidak’s multiple comparison test. (g) Left: Thr286-phosphorylated CaMKII is enhanced in L1 at the induction phase of plasticity (iLTP0’ or BzATP0’). Scale bars, 5 μm. Right: Mean intensity of Thr286-phosphorylated CaMKII puncta normalized to bsl. n = 25 to 33 FOVs from three independent experiments. *P < 0.05, one-way ANOVA followed by Sidak’s multiple comparison test. (h) Left: Western blot analysis showing iLTP0’-induced CaMKII Thr286-phosphorylation. Right: Ratio between Thr286-phosphorylated CaMKII and total CaMKII normalized to the respective iLTP-free control. n = 5–9 independent experiments. *P < 0.05 compared with respective control, Kruskal–Wallis test followed by Dunn’s multiple comparisons test. (b–h) Results are presented as minimum to maximum box plots. (i) Model. ATP released downstream NMDA-induced neuronal activity activates microglial P2RX7 which triggers the release of microglial TNFα. TNFα signaling gates CaMKIIα autophosphorylation which controls the enrichment of synaptic GABAARs in pyramidal neurons. Source data are available for this figure: SourceData F2.
Figure 3.
Figure 3.
P2RX7 and microglial TNFα promote daily changes in synaptic GABAAR content and CaMKII phosphorylation. (a) Representative confocal images of Thr286-phosphorylated CaMKII immunoreactivity in L1 show higher intensity at ZT6 than ZT18 in transgenic control mice (tCTL). Scale bars, 20 μm. (b) Mean intensity of Thr286-phosphorylated CaMKII signal in L1 normalized to ZT18 for tCTL, microglia-specific TNFα depletion (micTNFα-KO) and P2rx7-KO mice. n = 37–50 FOVs from four to five mice per group. (c) Mean intensity of GABAARγ2 clusters at gephyrin+VGAT+ synapses normalized to ZT18. n = 48 to 65 FOVs from four to five mice per group. (b and c) *P < 0.05 and **P < 0.01, nested two-tailed t-test. Results are presented as minimum to maximum box plots.
Figure S3.
Figure S3.
SOM-IN+ inputs are distributed similarly in adult brain and organotypic slices. (a) SOM-IN presynaptic boutons, identified in SOMCre/+:R26tdTom/+ adult mice as SOM-tdTomato+VGAT+ terminals, are denser in upper cortical layers of brain and organotypic slices. Scale bars, 10 μm. (b) Fraction of VGAT+ puncta colocalized to SOM-tdTomato+ boutons. Of note, the majority of VGAT+ puncta in adult brain and organotypic slices cortical L1 are SOM-IN inputs. Adult brain: n = 31 (L1) and 33 (L5) FOVs from three SOMCre/+:R26tdTom/+ mice. Organotypic slices: n = 24 (L1), 12 (L5) FOVs from 1 SOMCre/+:R26tdTom/+ culture. Results are presented as minimum to maximum box plots.
Figure S4.
Figure S4.
Microglia are required for iLTP-induced GABAARs plasticity. (a) Left: Iba1+ cells are depleted in organotypic slices by PLX3397 (PLX) or Mac1-Saporin (SAP) treatment. Scale bars, 100 μm. Right: Density of Iba1+ cells normalized to untreated slices (CTL). n = 4 to 1 independent experiments. Data are mean ± SEM. Each datapoint represents one independent experiment. (b) Confocal images of inhibitory synaptic markers gephyrin, VGAT and GABAARα1 in organotypic slices cortical L1. Scale bar, 5 μm. (c) Left: Cumulative fraction of the intensity of GABAARα1 clusters at gephyrin+ cluster. ****P < 0,0001, Kolmogorov–Smirnoff. Middle: Mean intensity of extrasynaptic GABAARα1. Right: Fraction of gephyrin+ clusters colocalized to GABAARα1. No statistical significance by nested one-way ANOVA followed by Sidak’s multiple comparison test. Results are presented as minimum to maximum box plots. n = 44 to 50 FOVs from six independent experiments. (d) Left: Mean intensity of GABAARγ2 clusters at VGAT+ clusters around NeuN+ cell bodies showing no changes in GABAARγ2 at putative somatic L5 synapses upon iLTP. Right: Fraction of VGAT+ clusters colocalized to GABAARγ2 cluster in putative L5. No statistical significance by nested two-tailed t test. n = 43 to 45 FOVs from six independent experiments. (e) Mean intensity of GABAARα1 clusters at gephyrin+ cluster showing no suppression of iLTP effect by CX3CL1 neutralizing antibody (n-CX3). n = 63 to 69 FOVs from six independent experiments. *P < 0.05 and **P < 0.01, nested one-way ANOVA followed by Sidak’s multiple comparison test. (d and e) Results are presented as minimum to maximum box-plots.
Figure S5.
Figure S5.
TNFα controls GABAAR plasticity. (a) Conditional deletion of TNFα from CX3CR1-expressing cells in organotypic slices and in vivo assessed by ELISA. Graphs show TNFα concentration (pg/ml) as mean ± SEM. Left: Complete lack of LPS-induced TNFα production by organotypic slices upon 4-OHT-induced recombination of microglial TNFα in a CX3CR1CreERT2/+:TNFf/f background but not control slices (TNFf/f). n = 2 replicates from two individual experiments. Middle: Following feeding with tamoxifen-containing food, LPS- or BzATP-induced TNFα release by adult mouse primary microglia observed in transgenic controls (tCTL, CX3CR1GFP/+:TNFf/f) but not on microglia-TNFα depleted mice (micTNFα-KO, CX3CR1CreERT2/+:TNFf/f). n = two to six mice per group. Right: On spleen cultures from tamoxifen-treated mice, LPS-induced TNFα release is not affected in both tCTL and micTNF-KO, demonstrating microglia-specific TNFα deletion in vivo. n = 3 mice per condition. (b) Mean intensity of GABAARα1 clusters at gephyrin+ clusters upon blockade of TNFα cleavage (TAPI), neutralization of TNFR1 (n-N1), TNFR2 (n-N2), and control IgGs (IgG). n = 62 to 89 FOVs from five to nine independent experiments. *P < 0.05, nested one-way ANOVA followed by Sidak’s multiple comparison test. (c) Representative images showing increase of GABAARα1 (cyan) at gephyrin+ clusters (arrowhead, green) after 20 min treatment with recombinant TNFα (rTNFα). Scale bars, 1 μm. (d) Effect of rTNFα and TNFR1 activating antibodies (TNFRA1), but not TNFR2 activating antibodies (TNFRA2), on GABAARα1 at L1 synapses. Left: Mean intensity of GABAARα1 clusters at gephyrin+ clusters. ***P < 0.001, nested two-tailed t test (bsl compared to rTNFα); and no statistical significance by nested one-way ANOVA followed by Sidak’s multiple comparison test (for bsl, TNFR1A and TNFR2A). Right: Cumulative fraction of the intensity of GABAARα1 clusters at gephyrin+ cluster. ****P < 0,0001, Kolmogorov–Smirnoff. (e) Mean intensity of GABAARα1 clusters at extrasynaptic sites. (f) Fraction of gephyrin+ clusters colocalized to GABAARα1. (e and f) No statistical significance by nested two-tailed t test (bsl compared to rTNFα) and nested one-way ANOVA followed by Sidak’s multiple comparison test (for bsl, TNFR1A, and TNFR2A). (d–f) n = 65 to 77 FOVs from eight independent experiments. (b and d–f) Results are presented as a minimum to maximum box plots.
Figure S6.
Figure S6.
BzATP-induced GABAAR synaptic enrichment. (a) Left: Cumulative fraction of GABAARα1 clusters’ intensities at gephyrin+ cluster. ****P < 0,0001, Kolmogorov–Smirnoff test. Middle: Mean intensity of extrasynaptic GABAARα1. Right: Fraction of gephyrin+ clusters colocalized to GABAARα1. No statistical significance by nested one-way ANOVA followed by Sidak’s multiple comparison test. n = 49 to 63 FOVs from five independent experiments. (b) Mean intensity of GABAARα1 clusters at gephyrin+ cluster. KN62, a CaMKII inhibitor, abolishes BzATP-induced synaptic upregulation of GABAARα1, indicative of a shared molecular mechanism at the neuronal level with iLTP. n = 53 to 57 FOVs from five independent experiments. *P < 0.05, nested one-way ANOVA followed by Sidak’s multiple comparison test. (c) BzATP has no effect on synaptic GABAAR at putative L5. Left: Mean intensity of GABAARγ2 clusters at VGAT+ clusters. Right: Fraction of VGAT+ clusters colocalized to GABAARγ2 cluster. No statistical significance by nested two-tailed t test. n = 42 to 45 FOVs from six independent experiments. (a–c) Results are presented as a minimum to maximum box plots.
Figure S7.
Figure S7.
Microglia control GABAAR plasticity and fluctuations of CaMKII phosphorylation across the light/dark cycle. (a) Left: Confocal images of L1 total CaMKII immunoreactivity showing no changes between ZT18 and ZT6 in transgenic control mice (tCTL). Scale bars, 20 µm. Right: Mean intensity of total CaMKII signal normalized to ZT18. No statistical significance by nested two-tailed t test. n = 40–50 FOVs from four to five mice per group. (b) Confocal images of L5 Thr286-phosphorylated CaMKII immunoreactivity. Scale bars, 20 µm. Right: Mean intensity of Thr286-phosphorylated CaMKII signal normalized to ZT18. No statistical significance by nested two-tailed t test. n = 32 to 40 FOVs from four to five mice per group. (c) Mean intensity of Thr286-phosphorylated CaMKII signal in L1 normalized to ZT18. n = 49 to 50 FOVs from 5 mice per group. *P < 0.05, nested two-tailed t test. (d) Left: Fraction of gephyrin+VGAT+ synapses colocalized to GABAAR cluster. Right: Mean intensity of GABAAR clusters at extrasynaptic sites. n = 48 to 65 FOVs from four to five mice per group. *P < 0.05, nested two-tailed t test. (a–d) Results are presented as minimum to maximum box-plots.
Figure 4.
Figure 4.
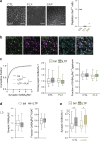
Microglial TNFα modulates slow waves during NREMS. (a) Amounts of vigilance states over 24 h reported by 2-h segments. Wake, NREMS, and REMS are not significantly different between tCTL and micTNFα-KO mice (n = 15 mice per group; two-way RM-ANOVA, P = 0.1490; P = 0.2784, P = 0.6838 respectively). (b) Left: Average spectral density (top) of tCTL and micTNFα-KO (lines: means; shaded area: SEM). Right: Ratio between power in faster delta frequencies (δ2, waves from 2.5 to 3.5 Hz) and slower delta frequencies (δ1, waves from 0.75 to 1.75 Hz) in NREM sleep (Mann-Whitney W = 169, P = 0.0043). (c) Left: Examples of EEG and 0.1–4 Hz filtered EEG during NREMS from a transgenic control tCTL; the positive and negative peaks of the delta-filtered signal are indicated by orange and blue points, respectively. Ticks on gray lines indicate large positive deflections corresponding to slow waves (SW). Right: Grand average SW for tCTL (black) showing duration (d) and maximum slope (s), and micTNFα-KO (green). (d) Characteristics of SW in a 24-h time period. micTNFα-KO mice exhibit significantly shorter peak onset slopes and longer SW duration than tCTL mice. Mann–Whitney W = 42 P = 0.005 and W = 153, P = 0.37 respectively. n = 14 tCTL and 15 micTNFα-KO respectively. (b [right] and d) Results are presented as minimum to maximum boxplots with the individual values of each mouse represented as datapoints.
Figure S8.
Figure S8.
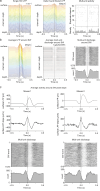
SWs coincide with cortical down-states and peak upward slope corresponds to the onset of down-states. (a) Example of single SW recorded across cortical layers by linear electrodes (with 20 µm spacing between the contacts). The channels are plotted and colored by depth. The top channel is located close to the surface, and the bottom channel (“depth”) is located 1,275 µm below. Left: Raw local field potential (LFP) traces. Middle: Delta-band filtered LFP. Right: Multiunit activity across all electrode channels; each line corresponds to a channel, and each dot represents the time of an extracellular spike detected on the channel. The density of spikes detected on all channels is evaluated using a 10 ms Gaussian kernel and plotted at the bottom. (b) Average LFP and multi-unit activity around the peak of all SW detected in a 2 h-recording session. Left: Average LFP trace for each depth. Middle: Spike count around the peak of the SW; each line corresponds to the cross-correlogram between the times of the peak of SW and the multiunit activity of a single channel. Right: Rasters of the total multi-unit activity detected across all channels for each individual SW (each line corresponds to a SW event, each dot on this line to an extracellular spike); a grand histogram is indicated at the bottom. Note that there is a clear drop in the density of spikes around the peak of each SW indicating the correspondence between the SW and cortical down-states. (c) The peak upward slope corresponds to the drop of multiunit cortical activity below the basal firing rate. The results of two mice are displayed. Top: Average SW waveform at the surface centered on the time of maximal slope of the SW. Middle: Average derivative of the surface LFP around the time of maximal slope of the SW. Bottom: Raster and histogram of the multi-unit activity for all SWs, centered on the maximal slope of each SW.
Figure 5.
Figure 5.
Microglial TNFα required for memory consolidation in sleep-dependent learning tasks. (a) Experimental design: Mice learn to run on the complex wheel (session 1, S1) and consolidation of memory is tested the following day (session 2, S2). Between S1 and S2, mice are left undisturbed in their cages. (b) Average latency to fall off the complex wheel in the first three and the last three trials of S1 and S2 from tCTL and micTNFα-KO. Gray area represents undisturbed sleep–wake cycle. Dashed line represents S1 to S2 consolidation. 8 tCTL and 10 micTNFα-KO mice. The data represent mean ± SEM. (c) Improvement within each session was measured as the ratio between the mean of the best three trials and first three trials. No statistical significance (ns) by unpaired two-tailed Mann–Whitney test. (d) Performance improvement across sessions was measured as the ratio between the mean of S2 and S1 trials. *P < 0.05, unpaired two-tailed Mann–Whitney test. (e) Consolidation of motor learning across sessions was measured in two ways: the ratio between the mean of the first three trials of S2 and mean of the last three trials of S1 (first S2/last S1) or ratio between mean of first three trials of S2 and mean of S1 trials (first S2/mean S1). *P < 0.05 and **P < 0.01, unpaired two-tailed Mann–Whitney test. (c–e) 8 tCTL and 10 micTNFα-KO mice. Results are presented as minimum to maximum box-plots with the individual values of each mouse represented as datapoints. (f and h) Novelty preference in the novel floor-texture recognition (FTR) (f) or the Novel Object Recognition (NOR) task (h). Fractional preference is expressed as a function of cumulative time of exploration (see Materials and methods). The data represent the mean ± SEM of the preference for the object placed on the novel floor texture (f) or for the novel object (h) computed for each animal. #P < 0.05, ##P < 0.01, and ###P < 0.001 preference for one object versus no preference and *P < 0.05, **P < 0.01, and ***P < 0.001 CTL versus micTNFα-KO. Unpaired t tests. The fractional preference is equal to 1 or −1 when the animal only explored respectively the object placed on the novel or familiar floor texture in the FTR and the novel or familiar object in the NOR, and 0 when the animal spent exactly the same amount of time on the two objects. (g and i) Total duration of exploration of the novel floor (FTR; g) and of the novel object (NOR; i). Boxes represent quartiles and whiskers correspond to the range of data; points are singled as outliers if they deviate more than 1.5 × inter-quartile range from the nearest quartile. (g) °P = 0.0674 CTL versus micTNFα-KO, Unpaired t tests. (i) P = 0.44 CTL versus. micTNFα-KO. Unpaired t tests; (f–i) n = 11 tCTL and 8 (f and g) or 16 (h and i) micTNFα-KO mice.
Figure S9.
Figure S9.
Microglial TNFα does not modulate locomotor activity and anxiety-like behaviors. (a) No significant differences were measured between tCTL and micTNFα-KO mice in the open-field test for the distance covered (two-tailed unpaired t test, t(35) = 1.533, P = 0.1324). (b and c) Time spent in the central zone (two-tailed unpaired t test, t(35) = 0.7278, P = 0.4716); and velocity (two-tailed unpaired t test, t(35) = 1.587, P = 0.1214). (a–c) n = 17 tCTL and 20 micTNFα-KO mice. Data are expressed as means ± SEM.

References

    1. Adamantidis, A.R., Gutierrez Herrera C., and Gent T.C.. 2019. Oscillating circuitries in the sleeping brain. Nat. Rev. Neurosci. 20:746–762. 10.1038/s41583-019-0223-4 - DOI - PubMed
    1. Adler, A., Zhao R., Shin M.E., Yasuda R., and Gan W.-B.. 2019. Somatostatin-expressing interneurons enable and maintain learning-dependent sequential activation of pyramidal neurons. Neuron. 102:202–216.e7. 10.1016/j.neuron.2019.01.036 - DOI - PMC - PubMed
    1. Badimon, A., Strasburger H.J., Ayata P., Chen X., Nair A., Ikegami A., Hwang P., Chan A.T., Graves S.M., Uweru J.O., et al. . 2020. Negative feedback control of neuronal activity by microglia. Nature. 586:417–423. 10.1038/s41586-020-2777-8 - DOI - PMC - PubMed
    1. Bayer, K.U., and Schulman H.. 2019. CaM kinase: Still inspiring at 40. Neuron. 103:380–394. 10.1016/j.neuron.2019.05.033 - DOI - PMC - PubMed
    1. Beattie, E.C., Stellwagen D., Morishita W., Bresnahan J.C., Ha B.K., Von Zastrow M., Beattie M.S., and Malenka R.C.. 2002. Control of synaptic strength by glial TNFalpha. Science. 295:2282–2285. 10.1126/science.1067859 - DOI - PubMed

Publication types

Substances

LinkOut - more resources