. 2024 Jul 15;84(14):2364-2376.
doi: 10.1158/0008-5472.CAN-23-2352.

Multiplexed Imaging Mass Cytometry Analysis Characterizes the Vascular Niche in Pancreatic Cancer

Affiliations

Multiplexed Imaging Mass Cytometry Analysis Characterizes the Vascular Niche in Pancreatic Cancer

Jonathan H Sussman et al. Cancer Res. .

Abstract

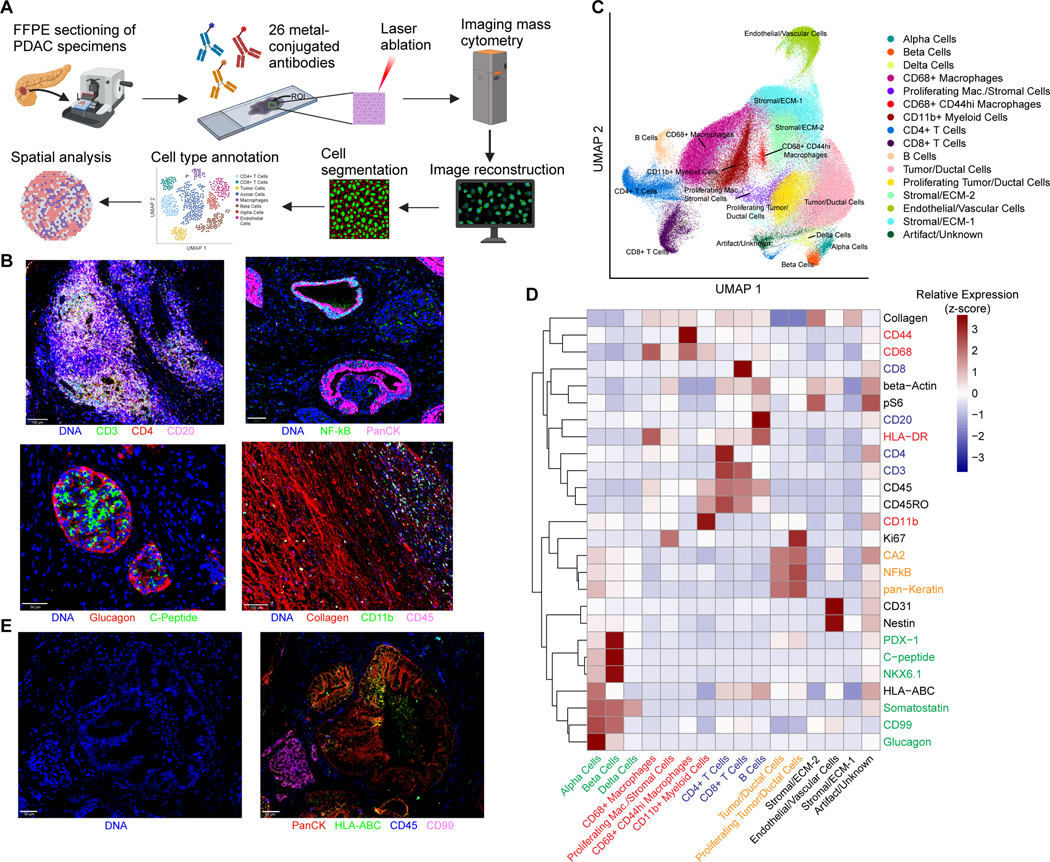
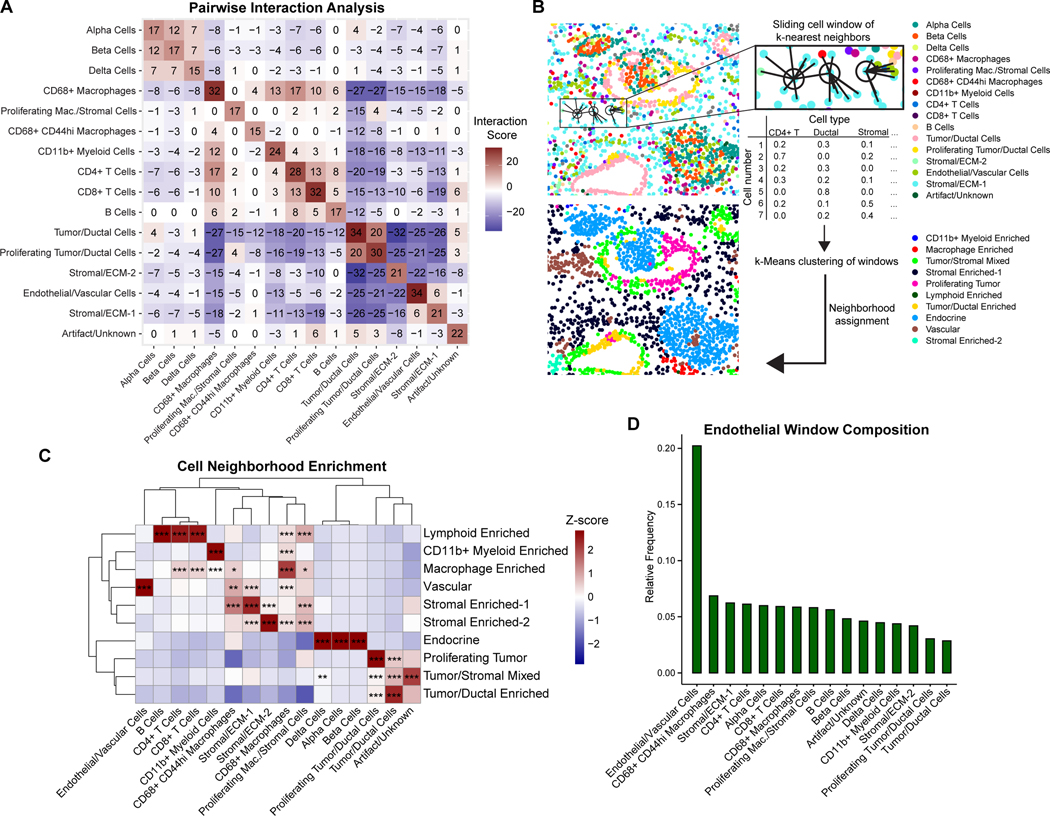
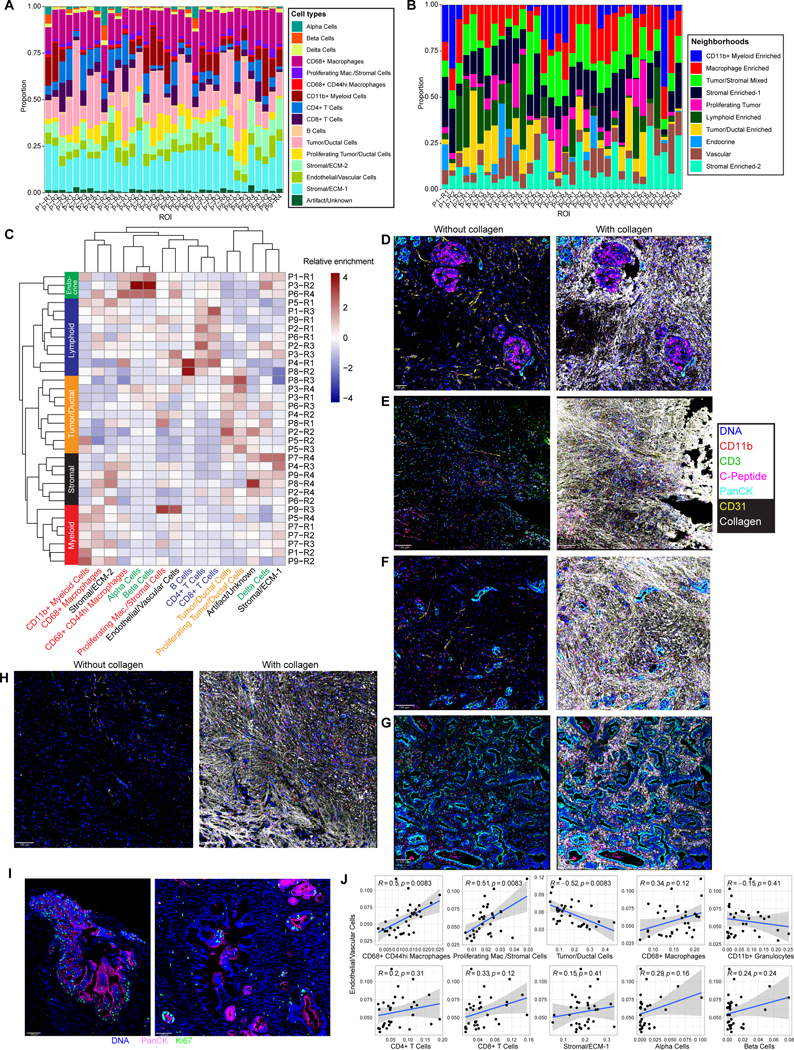
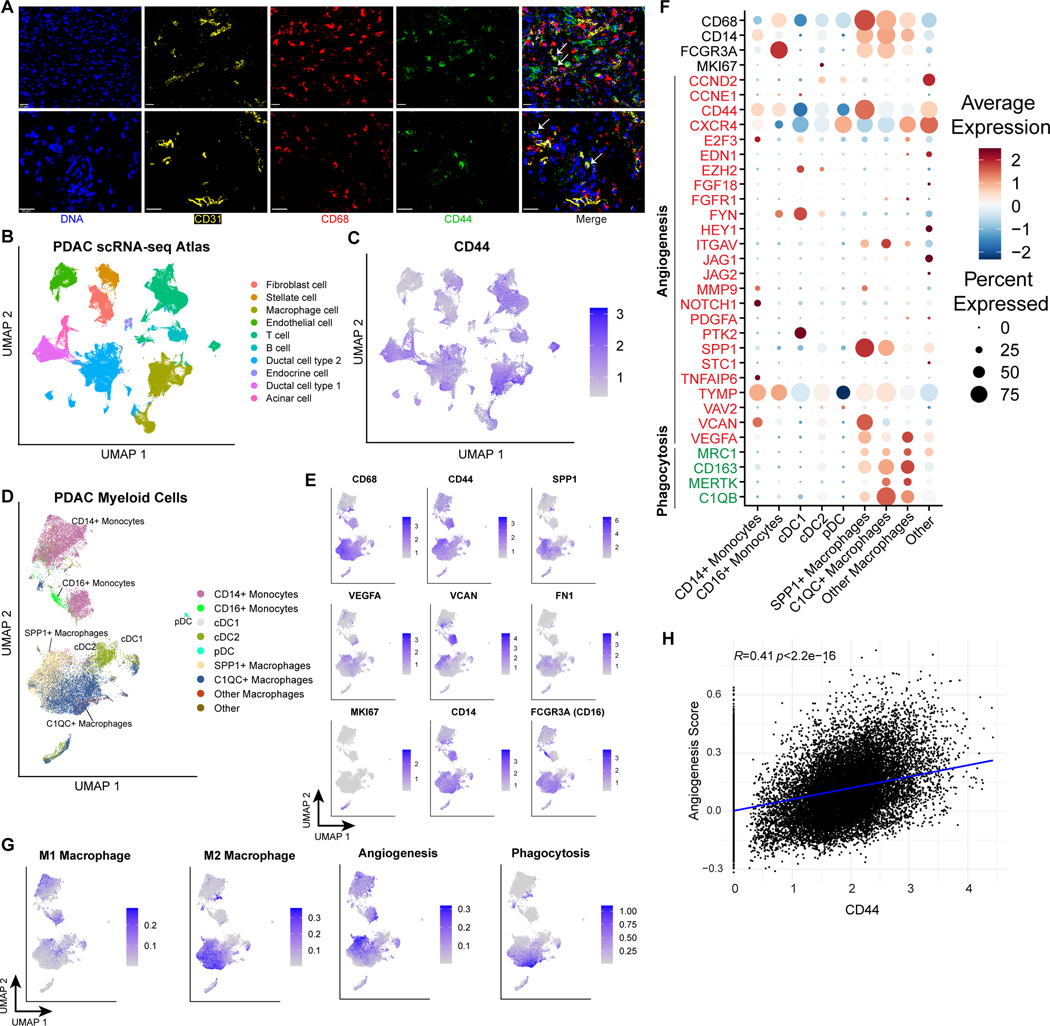
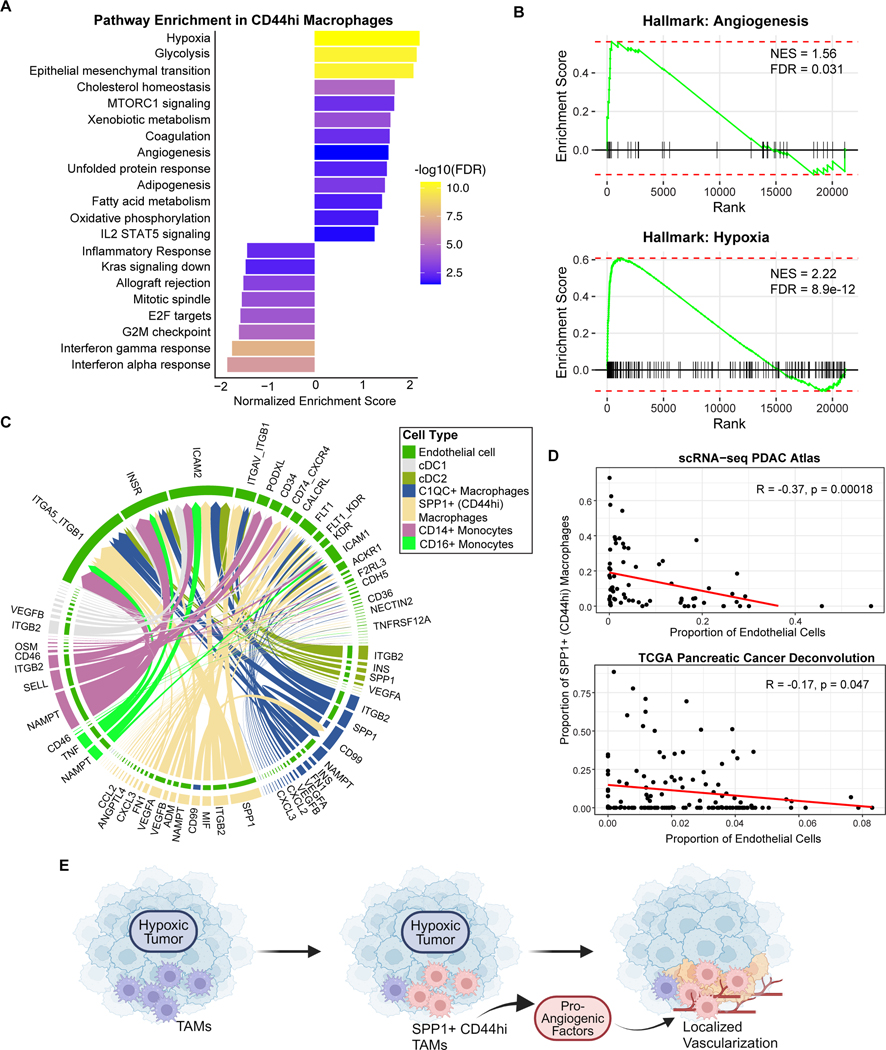
Oncogenesis and progression of pancreatic ductal adenocarcinoma (PDAC) are driven by complex interactions between the neoplastic component and the tumor microenvironment, which includes immune, stromal, and parenchymal cells. In particular, most PDACs are characterized by a hypovascular and hypoxic environment that alters tumor cell behavior and limits the efficacy of chemotherapy and immunotherapy. Characterization of the spatial features of the vascular niche could advance our understanding of inter- and intratumoral heterogeneity in PDAC. In this study, we investigated the vascular microenvironment of PDAC by applying imaging mass cytometry using a 26-antibody panel on 35 regions of interest across 9 patients, capturing more than 140,000 single cells. The approach distinguished major cell types, including multiple populations of lymphoid and myeloid cells, endocrine cells, ductal cells, stromal cells, and endothelial cells. Evaluation of cellular neighborhoods identified 10 distinct spatial domains, including multiple immune and tumor-enriched environments as well as the vascular niche. Focused analysis revealed differential interactions between immune populations and the vasculature and identified distinct spatial domains wherein tumor cell proliferation occurs. Importantly, the vascular niche was closely associated with a population of CD44-expressing macrophages enriched for a proangiogenic gene signature. Taken together, this study provides insights into the spatial heterogeneity of PDAC and suggests a role for CD44-expressing macrophages in shaping the vascular niche. Significance: Imaging mass cytometry revealed that pancreatic ductal cancers are composed of 10 distinct cellular neighborhoods, including a vascular niche enriched for macrophages expressing high levels of CD44 and a proangiogenic gene signature.


Conflict of interest statement

Conflict of interest: B.Z.S. receives research funding from Boehringer Ingelheim Pharmaceuticals and Revolution Medicines and holds equity in iTeos Therapeutics. G.L.B. reports prior or active roles as a consultant/advisory board member for Boehinger Ingelheim, Adicet Bio, Aduro Biotech, AstraZeneca, BiolineRx, BioMarin Pharmaceuticals, Boehinger Ingelheim, Bristol-Myers Squibb, Cantargia, Cour Pharmaceuticals, Genmab, HiberCell, HotSpot Therapeutics, Incyte, Janssen, Legend Biotech, Merck, Monopteros, Molecular Partners, Nano Ghosts, Opsona, Pancreatic Cancer Action Network, Seagen, Shattuck Labs, and Verastem, and; reports receiving commercial research grants from Alligator Biosciences, Arcus, Bristol-Myers Squibb, Genmab, Gilead, Halozyme, HiberCell, Incyte, Janssen, Newlink, Novartis, and Verastem. G.L.B. is an inventor of intellectual property (U.S. patent numbers 10,640,569 and 10,577,417) and recipient of royalties related to CAR T cells that is licensed by the University of Pennsylvania to Novartis and Tmunity Therapeutics. All other authors declare no potential conflicts of interest.

Figures

Figure 1.
Figure 1.. Imaging mass cytometry captures the major cell types in the PDAC microenvironment
(A) Schematic of IMC workflow and data processing. FFPE sections of human PDAC samples are labeled simultaneously with heavy metal-conjugated antibodies. Regions of interest up to 1 mm x 1 mm are selected for laser ablation. Plumes of particles are carried over to CyTOF for signal quantification. Antibody labeling patterns are reconstructed and output as 32-bit images. Signal compensation, hot pixel removal, and cell segmentation are performed, followed by quantitation of marker intensity in each cell, which enables downstream analysis. (B) Representative images from imaging mass cytometry demonstrating identification of a lymphoid aggregate, ductal structures, islets, and fibrous stroma. (C) UMAP projection of 144,976 cells captured across 34 ROIs labeled by cell type, revealing multiple populations of parenchymal and stromal cells including several myeloid and lymphoid populations. A single cluster with high expression of all markers captures putative cell doublets and imaging artifact (“Artifact/Unknown”). (D) Mean levels of each of the 26 markers used in the final analysis are shown for each of the manually annotated cell types. Values are displayed as z-score-normalized intensities for each row. (E) Representative IMC images of markers utilized for whole cell segmentation: nuclear channel (left) and 4 markers included in the composite membrane channel (right).
Figure 2.
Figure 2.. PDAC is composed of distinct cellular neighborhoods
(A) Heatmap of pairwise interaction-avoidance scores summed across ROIs. Cells are defined as interacting if the distance between centroids is <10 μm in distance. Significance is assessed by comparing the number of interactions in each ROI to a null distribution of randomly permuted cell-type labels, with a threshold of p<0.01 for interaction (+1) or avoidance (–1) for the ROI. (B) Schematic of cellular neighborhood analysis. A sliding window captures each cell along with its 20 nearest neighboring cells as measured by the Euclidean distance between X/Y coordinates. The cell type composition for each window is clustered by k-means clustering and manually annotated. (C) Heatmap of cell type proportions across 10 neighborhoods discovered across ROIs. Values are z-score normalized by column. Statistical significance for cell type enrichment in each neighborhood was calculated using a hypergeometric test comparing the cell type-neighborhood preference to a random distribution of the cell type across neighborhoods, adjusted using the Benjamini-Hochberg method. * p < 0.01, ** p < 0.001, *** p < 0.0001. (D) Relative enrichment of cell types in endothelial cell windows. Enrichment is calculated for each cell type as the sum of its proportion in the 20-nearest neighbor cell window for each endothelial cell, divided by the total number of that cell type in the dataset.
Figure 3.
Figure 3.. Heterogeneity across PDAC ROIs
(A) Cell type proportions for each ROI. (B) Proportions of neighborhood assignments for each ROI. (C) Heatmap showing hierarchical clustering of cell type proportions for each ROI. Values are z-score normalized by column. (D-H) Representative images from each cluster of ROIs identified in (C): endocrine-enriched (D), lymphoid-enriched (E), myeloid enriched (F), tumor/ductal-enriched (G), and stromal-enriched (H) shown with (right panels) and without (left panels) collagen staining included. The same markers are shown for each ROI. (I) Representative images demonstrating spatially localized Ki67 staining surrounding ductal structures. (J) Correlations between the proportions of indicated cell types and endothelial cells across ROIs, with Pearson’s correlation. Gray bands represent standard error of the linear regression line. P-values are adjusted for multiple hypothesis testing using the Benjamini-Hochberg correction.
Figure 4.
Figure 4.. CD44hi tumor-associated macrophages (TAMs) in PDAC harbor pro-angiogenic features
(A) Representative IMC images from two ROIs (top and bottom rows) demonstrating identification of CD68/CD44 double-positive cells (indicated with white arrows) in proximity to endothelial cells. (B) UMAP projection of cells from PDAC scRNA-seq atlas (136,163 cells) (20). (C) CD44 expression across PDAC scRNA-seq atlas. Color indicates expression value truncated at the 1st and 99th percentiles. (D) Predicted cell type annotation for macrophage subset identified in PDAC scRNA-seq atlas after integration and projection onto reference atlas of pan-cancer tumor myeloid cells (23,703 cells)22. (E) Expression of selected angiogenesis-related genes in the PDAC myeloid cells, colored by expression truncated at the 1st and 99th percentiles. (F) M1, M2 macrophage, angiogenesis, and phagocytosis scores in PDAC myeloid cells, truncated at the 1st and 90th percentiles for visualization. (G) Dotplot showing expression of macrophage identity genes and signature genes included in the angiogenesis and phagocytosis gene signatures from (F). (H) Correlation between normalized CD44 expression and the angiogenesis signature scores across all myeloid populations.
Figure 5.
Figure 5.. CD44hi TAMs are associated with a hypoxic tumor microenvironment
(A) Gene Set Enrichment Analysis (GSEA) of Hallmark pathways comparing pathway-level differences in gene expression between SPP1+ (CD44hi) macrophages and all other PDAC myeloid populations shown in Figure 4D. GSEA is based on all expressed genes in the scRNA-seq data (Methods). (B) GSEA enrichment plots of Angiogenesis and Hypoxia pathways from (A). (C) Chord diagram showing predicted receptor-ligand interactions from myeloid populations to endothelial cells from the PDAC scRNA-seq atlas shown in Figure 4B. The thickness of arrows represents the strength of the inferred interaction. Color of outer bars and arrows indicate sender cell type, and color of inner bars indicate the receiver cell type. (D) Correlations between endothelial cell fraction and SPP1+ (CD44hi) macrophages (as a fraction of all myeloid populations) across patients from the PDAC scRNA-seq atlas (top) or from the TCGA-PAAD cohort after deconvolution with CIBERSORTx (bottom), with Pearson’s correlation and significance p-value shown. (E) Schematic of proposed model for pro-angiogenic tumor associated macrophages (TAMs) in PDAC. Global tumor hypoxia is associated with a shift towards the CD44hi macrophage phenotype within the myeloid population. These TAMs secrete multiple pro-angiogenic factors and interact with endothelial cells leading to regions of localized vascularization that contain both endothelial cells and CD44hi macrophages.

References

    1. Ho WJ, Jaffee EM, Zheng L. The tumour microenvironment in pancreatic cancer — clinical challenges and opportunities. Nat Rev Clin Oncol. 2020;17(9):527–540. doi:10.1038/s41571-020-0363-5 - DOI - PMC - PubMed
    1. Schürch CM, Bhate SS, Barlow GL, Phillips DJ, Noti L, Zlobec I, et al. Coordinated Cellular Neighborhoods Orchestrate Antitumoral Immunity at the Colorectal Cancer Invasive Front. Cell. 2020;182(5):1341–1359.e19. doi:10.1016/j.cell.2020.07.005 - DOI - PMC - PubMed
    1. Keren L, Bosse M, Marquez D, Angoshtari R, Jain S, Varma S, et al. A Structured Tumor-Immune Microenvironment in Triple Negative Breast Cancer Revealed by Multiplexed Ion Beam Imaging. Cell. 2018;174(6):1373–1387.e19. doi:10.1016/j.cell.2018.08.039 - DOI - PMC - PubMed
    1. Liudahl SM, Betts CB, Sivagnanam S, Morales-Oyarvide V, da Silva A, Yuan C, et al. Leukocyte Heterogeneity in Pancreatic Ductal Adenocarcinoma: Phenotypic and Spatial Features Associated with Clinical Outcome. Cancer Discov. 2021;11(8):2014–2031. doi:10.1158/2159-8290.CD-20-0841 - DOI - PMC - PubMed
    1. Tsujikawa T, Kumar S, Borkar RN, Azimi V, Thibault G, Chang YH, et al. Quantitative multiplex immunohistochemistry reveals myeloid-inflamed tumor-immune complexity associated with poor prognosis. Cell Rep. 2017;19(1):203–217. doi:10.1016/j.celrep.2017.03.037 - DOI - PMC - PubMed

MeSH terms

Substances