. 2024 May 2;147(1):78.
doi: 10.1007/s00401-024-02727-9.

Characterisation of premature cell senescence in Alzheimer's disease using single nuclear transcriptomics

Affiliations

Characterisation of premature cell senescence in Alzheimer's disease using single nuclear transcriptomics

Nurun N Fancy et al. Acta Neuropathol. .

Abstract

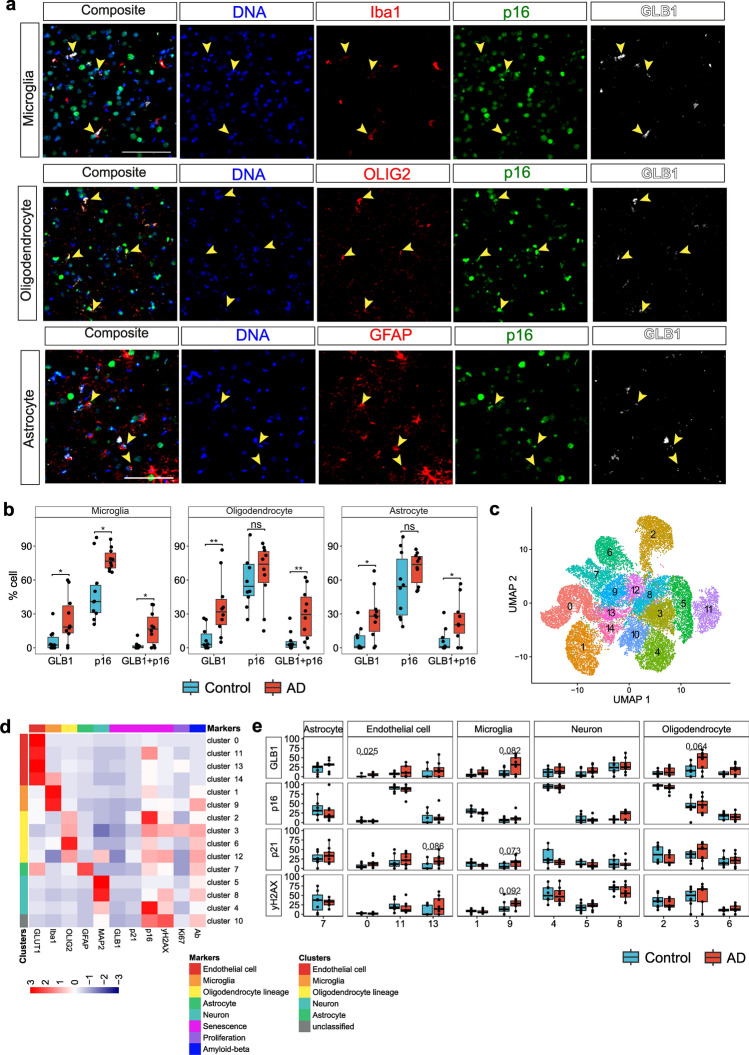
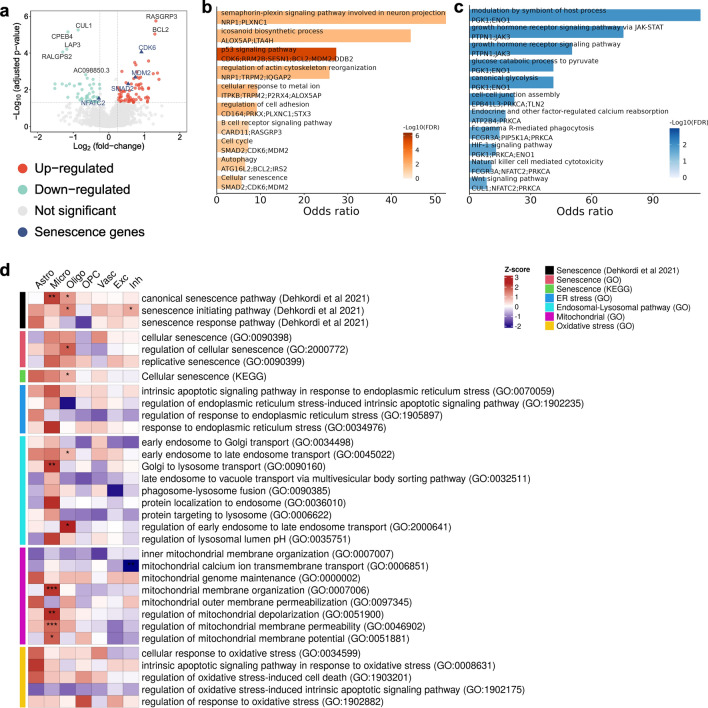
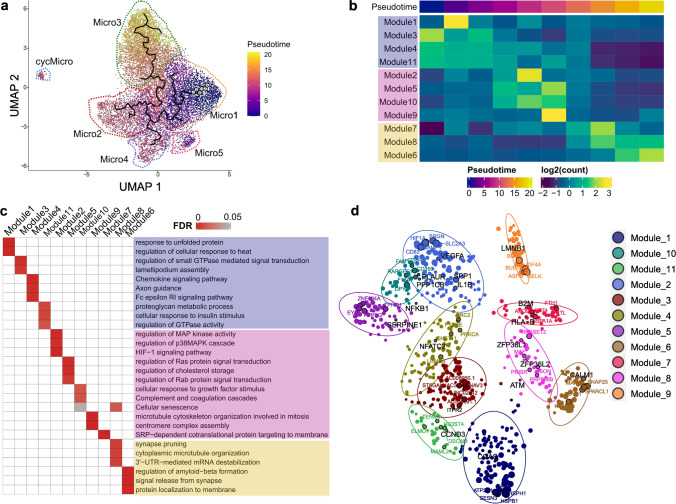
Aging is associated with cell senescence and is the major risk factor for AD. We characterized premature cell senescence in postmortem brains from non-diseased controls (NDC) and donors with Alzheimer's disease (AD) using imaging mass cytometry (IMC) and single nuclear RNA (snRNA) sequencing (> 200,000 nuclei). We found increases in numbers of glia immunostaining for galactosidase beta (> fourfold) and p16INK4A (up to twofold) with AD relative to NDC. Increased glial expression of genes related to senescence was associated with greater β-amyloid load. Prematurely senescent microglia downregulated phagocytic pathways suggesting reduced capacity for β-amyloid clearance. Gene set enrichment and pseudo-time trajectories described extensive DNA double-strand breaks (DSBs), mitochondrial dysfunction and ER stress associated with increased β-amyloid leading to premature senescence in microglia. We replicated these observations with independent AD snRNA-seq datasets. Our results describe a burden of senescent glia with AD that is sufficiently high to contribute to disease progression. These findings support the hypothesis that microglia are a primary target for senolytic treatments in AD.

Keywords: Aging; Alzheimer’s disease; Astrocyte; Cell stress; Glia; Image mass cytometry; Microglia; Neuron; Oligodendroglia; Senescence; Senolytics; Single cell transcriptomics.


Conflict of interest statement

This study also was partly funded by Biogen IDEC. PMM has received consultancy fees from Sudo Biosciences, Ipsen Biopharm Ltd., Rejuveron Therapeutics and Biogen. He has received honoraria or speakers’ fees from Novartis and Biogen and has received research or educational funds from BMS, Biogen, Novartis and GlaxoSmithKline.

Figures

Fig. 1
Fig. 1
Numbers of senescent glial cells are increased in brains of AD compared to those from NDC donors. (a, b: IMC data from cohort-1) a Multiplexed imaging mass cytometry (IMC) (scale bar = 50 µm) revealed overlapping expression of senescence (GLB1 and p16) and cell type specific markers (Iba1; microglia, OLIG2; oligodendrocyte lineage, GFAP; astrocyte) in cohort-1. b Proportions of GLB1+, p16+ and GLB1+p16+ microglia (Iba1+), oligodendrocyte (OLIG2+) and astrocyte (GFAP+) were calculated in AD and NDC using cohort-1 IMC data (Wilcoxon rank-sum test, *p ≤ 0.05. **p ≤  0.01). (ce: IMC data from cohort-2) c UMAP showing the cellular clusters generated by SIMPLI from cohort-2 IMC data. d Marker mean expression heatmap by clusters. e Proportion of nuclei of all clusters expressing senescence markers in AD and NDC (Wilcoxon rank-sum test, p ≤ 0.1 is reported)
Fig. 2
Fig. 2
The microglial transcriptome is enriched for senescence gene expression in AD. a Study design showing the three regions from each of the 17 brains from which nuclei were isolated to generate snRNAseq data. b UMAP of seven distinct cell type populations characterized from snRNAseq data generated from 49 brain blocks. c Dot plot showing average scaled expression of genes and percentage of cells expressed from the ‘canonical senescence pathway (CSP)’, the ‘senescence initiating pathway (SIP)’ [16] and a custom senescence set (Supplementary data S5) for each cell type. d Normalised aggregated expression of genes as in (c) projected on UMAP. Color gradient scale showing aggregated gene set score in each nuclei. e Box plot showing scaled mean expression of the CSP genes in each cell type (Wilcoxon rank-sum test). f Percentage of senescent nuclei between AD and NDC across all cell types stratified by brain regions (Wilcoxon rank-sum test, *p ≤ 0.05) (Astro, astrocytes; Micro, microglia; Oligo, oligodendrocytes; OPC, Oligodendrocyte progenitor cells; Vasc, vascular cells; Exc, excitatory neurons, Inh; inhibitory neurons)
Fig. 3
Fig. 3
Senescence-associated genes are differentially expressed in microglia from AD and NDC donors. a Volcano plot showing differentially expressed genes between AD and NDC in microglia; senescence genes are annotated in blue. Barplots showing up- b and down-regulated c gene pathway enrichments in microglia with AD relative to NDC. d Heatmap showing senescence and other relevant gene set enrichments in AD relative to NDC (adjusted p, *p ≤ 0.05, **p ≤ 0.01, ***p ≤ 0.001)
Fig. 4
Fig. 4
Senescence-associated genes are differentially expressed in microglia from AD and NDC donors. a IMC data (cohort-1) were used to quantify the number of cells positive for senescence markers GLB1, p16 or both by co-localizing them with the microglia marker Iba1 and 4G8+ β-amyloid plaque (yellow pixels). i and ii shows two plaque regions containing Iba1+positive cells. Iba1+ microglia within 10 μm of plaques were defined as peri-plaque microglia. b The proportion of peri-plaque microglia expressing senescence markers was significantly higher than for non-plaque microglia in AD (Wilcoxon rank-sum test, *p ≤ 0.05, **p ≤ 0.01, ***p ≤ 0.001). c Heatmap showing top 5 differentially expressed genes by logFC (adjusted p value 0.05) against β-amyloid loads measured by 4G8+ immunohistochemical staining densities in all cell types in snRNAseq data. d The gene expression graph illustrates its correlation with β-amyloid (4G8+) densities. The upper section displays the log2-normalized expression of each gene in individual nuclei, with median expression denoted by a black circle. The lower section indicates the percentage of non-zero nuclei in each sample
Fig. 5
Fig. 5
Sub-populations of microglia differentially express senescence gene signatures. a UMAP dimensionality reduction plot showing microglial sub-populations b Odds-ratio estimates of microglial sub-populations associated with AD (circle; OR estimate obtained from MASC [22], bars; 95% CI). c Differences in relative numbers of each of the microglial sub-populations isolated from AD and NDC cortical brain tissue. d Percentages of microglial sub-populations as a function of β-amyloid (4G8+) load (Micro2 Pearson’s R = 0.63, p value = 1.4e−06). e Boxplot showing normalised mean expression of the CSP gene set in the different microglial sub-populations (Wilcoxon rank-sum test). f Bar plots comparing the proportions of senescent nuclei between AD and Control for Micro1-3 (Wilcoxon test, **p value<0.01). g Correlations of the proportions of Micro1-3 senescent nuclei with β-amyloid (4G8+) immunostained areas in sampled region of each brain (Micro1 Pearson’s R = 0.34, p value = 0.021). h Boxplots showing the scaled mean expression of CSP gene set across microglial sub-population grouped by TREM2 genotype (CV, common allele, or the R47H AD risk variant)
Fig. 6
Fig. 6
Sub-clustering of oligodendrocytes and astrocytes. Sub-clustering of oligodendrocytes a, b and astrocytes c, d show diverse functional sub-populations. UMAP dimensionality reduction plots describing these sub-populations for oligodendroglia (a) and astrocytes (c). Normalised mean expression of CSP between AD and Control across sub-populations of oligodendrocytes (b) and astrocytes (d)
Fig. 7
Fig. 7
Premature senescence of microglia with greater pseudo-time in AD is associated with gene signatures for inflammatory activation. a UMAP plot colored by microglial pseudo-time trajectory calculated by Monocle3 [71]. b Heatmap showing the relative enrichment of gene co-expression modules differentially expressed with increasing pseudo-time. Module names are colored according to pseudotime progression: Purple, early-; lilac, mid-; yellow, late-pseudotime c Significantly enriched pathway of the co-expression module genes. Pathway names are colored according to plot (b). d Network plot showing hub genes for each module (distinguished by colours) with senescence pathway associated genes highlighted (black circle)

Comment in

References

    1. Askew K, Li K, Olmos-Alonso A, Garcia-Moreno F, Liang Y, Richardson P, Tipton T, Chapman MA, Riecken K, Beccari S, Sierra A, Molnár Z, Cragg MS, Garaschuk O, Perry VH, Gomez-Nicola D. Coupled proliferation and apoptosis maintain the rapid turnover of microglia in the adult brain. Cell Rep. 2017;18:391. doi: 10.1016/J.CELREP.2016.12.041. - DOI - PMC - PubMed
    1. Bernadotte A, Mikhelson VM, Spivak IM. Markers of cellular senescence. Telomere shortening as a marker of cellular senescence. Aging (Albany NY) 2016;8:3. doi: 10.18632/aging.100871. - DOI - PMC - PubMed
    1. Bhat R, Crowe EP, Bitto A, Moh M, Katsetos CD, Garcia FU, Johnson FB, Trojanowski JQ, Sell C, Torres C. Astrocyte senescence as a component of Alzheimer’s disease. PLoS ONE. 2012;7:e45069–e45069. doi: 10.1371/journal.pone.0045069. - DOI - PMC - PubMed
    1. Biczo G, Vegh ET, Shalbueva N, Mareninova OA, Elperin J, Lotshaw E, Gretler S, Lugea A, Malla SR, Dawson D, Ruchala P, Whitelegge J, French SW, Wen L, Husain SZ, Gorelick FS, Hegyi P, Rakonczay Z, Gukovsky I, Gukovskaya AS. Mitochondrial dysfunction, through impaired autophagy, leads to endoplasmic reticulum stress, deregulated lipid metabolism, and pancreatitis in animal models. Gastroenterology. 2018;154:689–703. doi: 10.1053/J.GASTRO.2017.10.012. - DOI - PMC - PubMed
    1. Bielak-Zmijewska A, Wnuk M, Przybylska D, Grabowska W, Lewinska A, Alster O, Korwek Z, Cmoch A, Myszka A, Pikula S, Mosieniak G, Sikora E. A comparison of replicative senescence and doxorubicin-induced premature senescence of vascular smooth muscle cells isolated from human aorta. Biogerontology. 2014;15:47–64. doi: 10.1007/s10522-013-9477-9. - DOI - PMC - PubMed

Publication types

Substances