

Multivariate analysis applied to X-ray fluorescence to assess soil contamination pathways: case studies of mass magnetic susceptibility in soils near abandoned coal and W/Sn mines
- PMID: 38696051
- PMCID: PMC11065930
- DOI: 10.1007/s10653-024-01988-3
Multivariate analysis applied to X-ray fluorescence to assess soil contamination pathways: case studies of mass magnetic susceptibility in soils near abandoned coal and W/Sn mines
Abstract
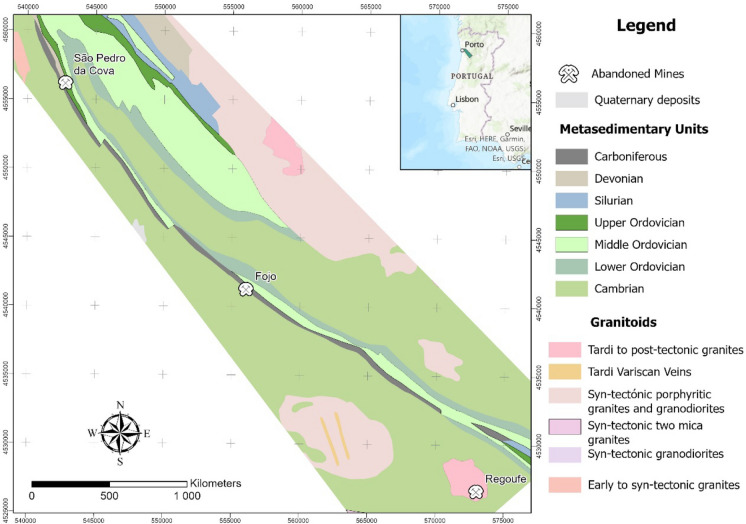
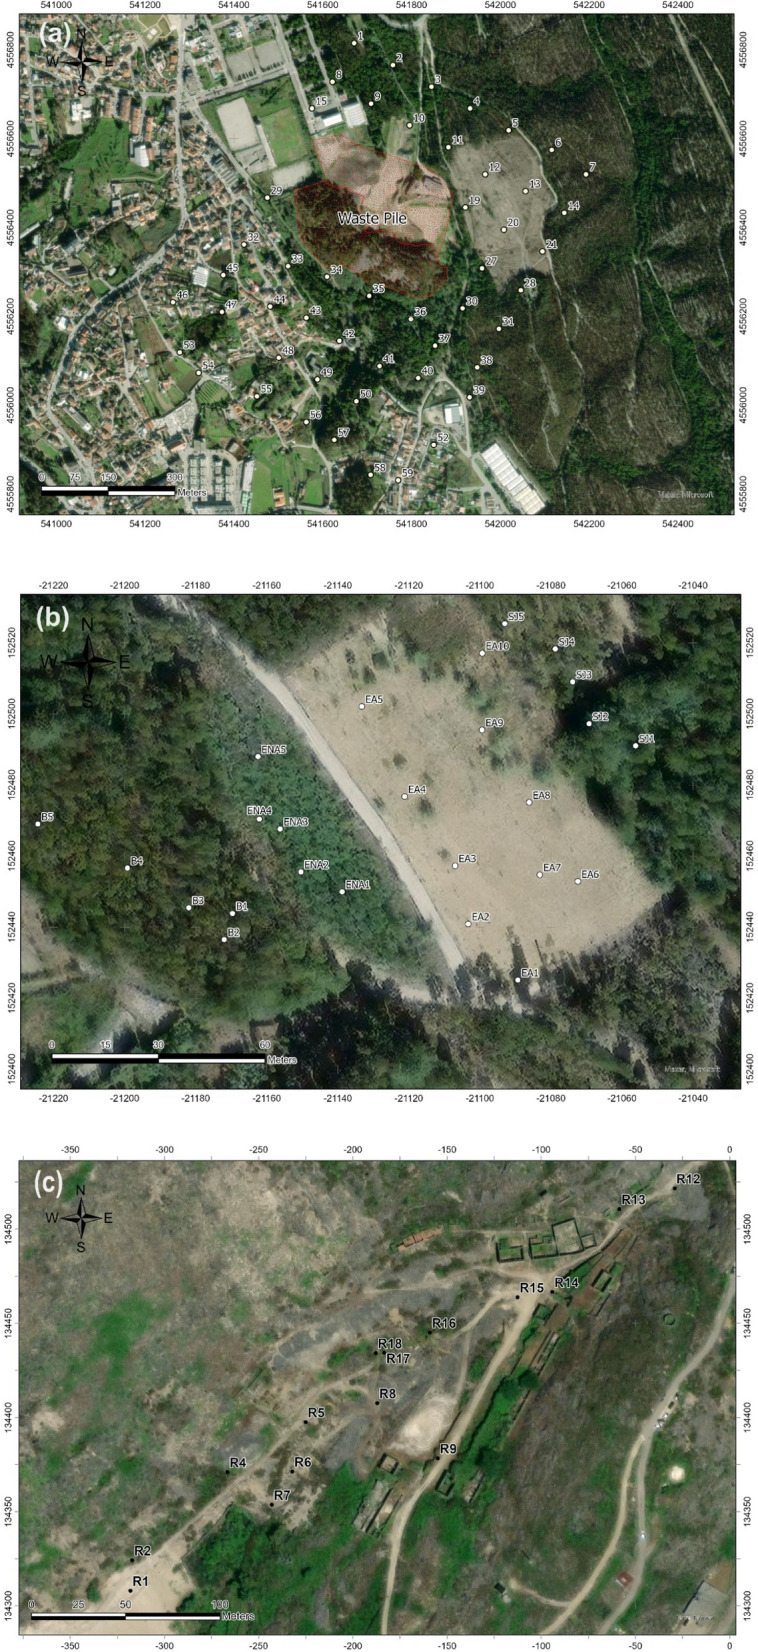
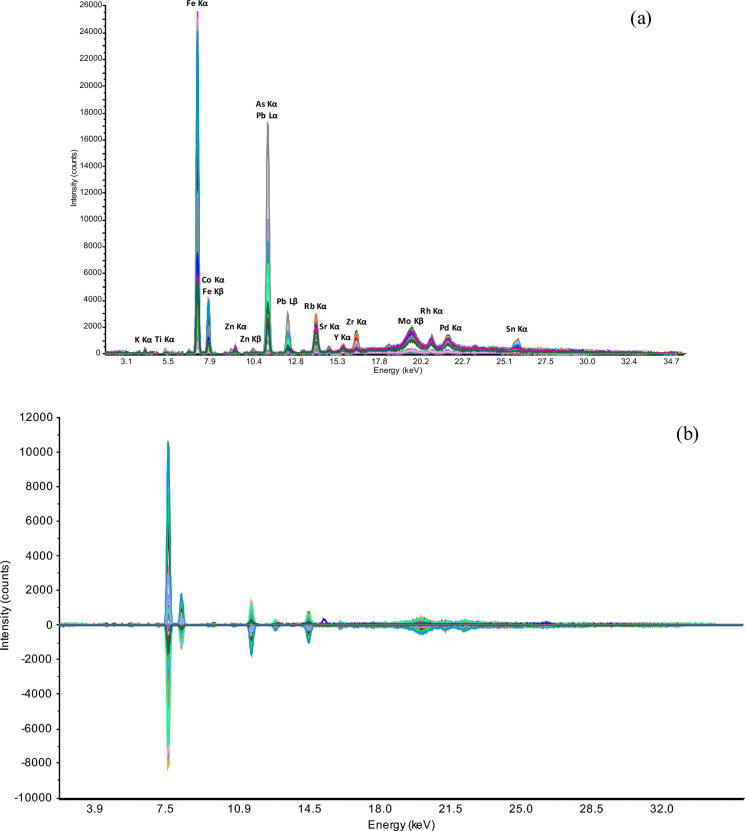
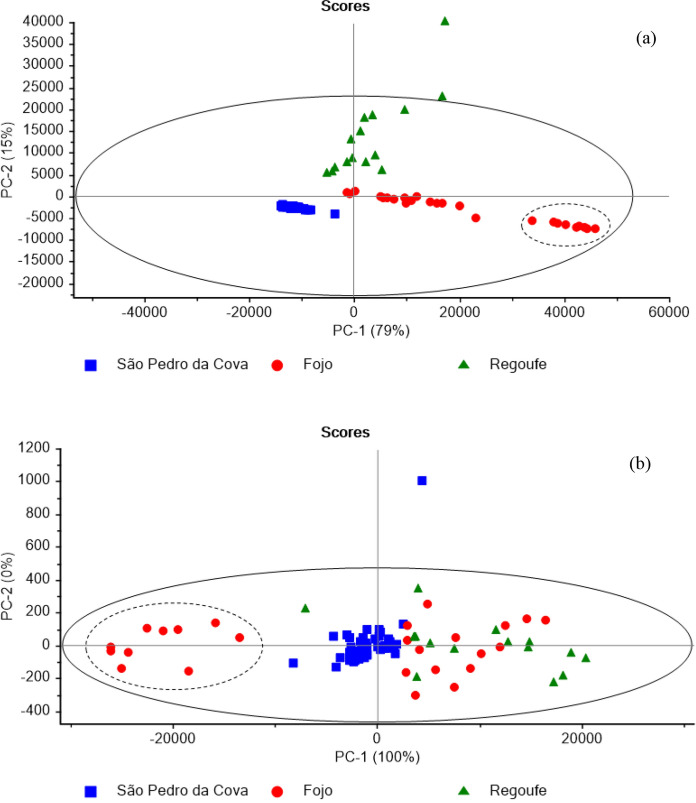
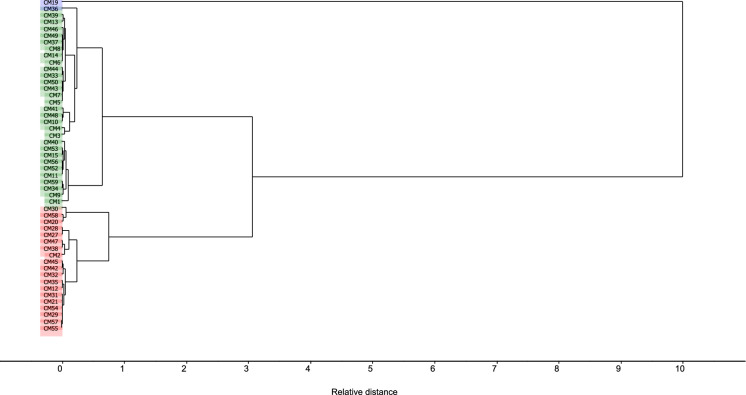
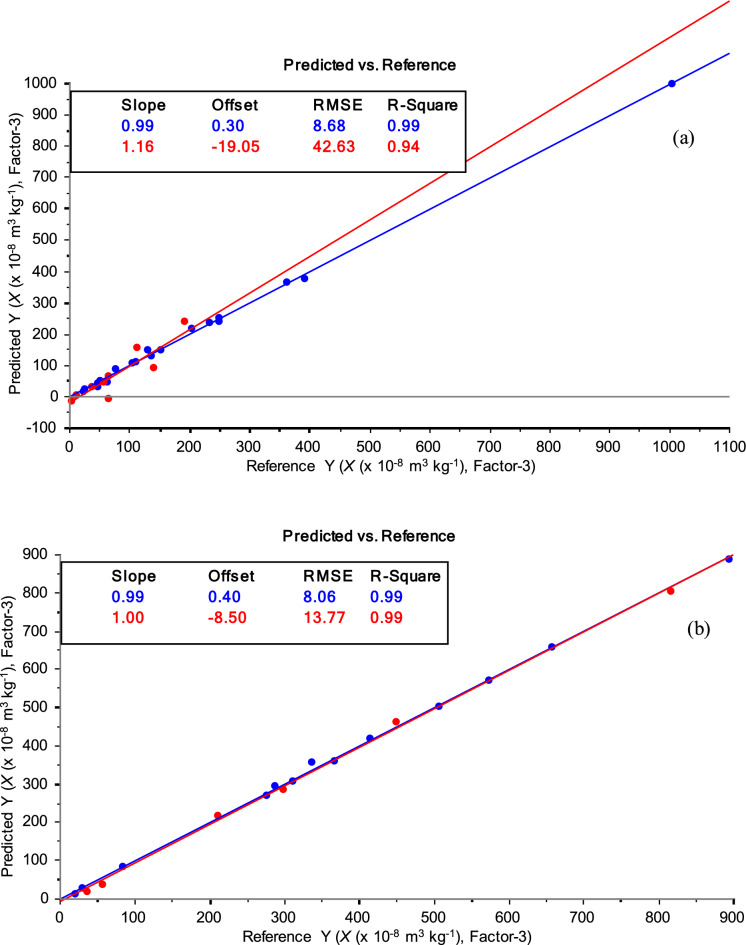
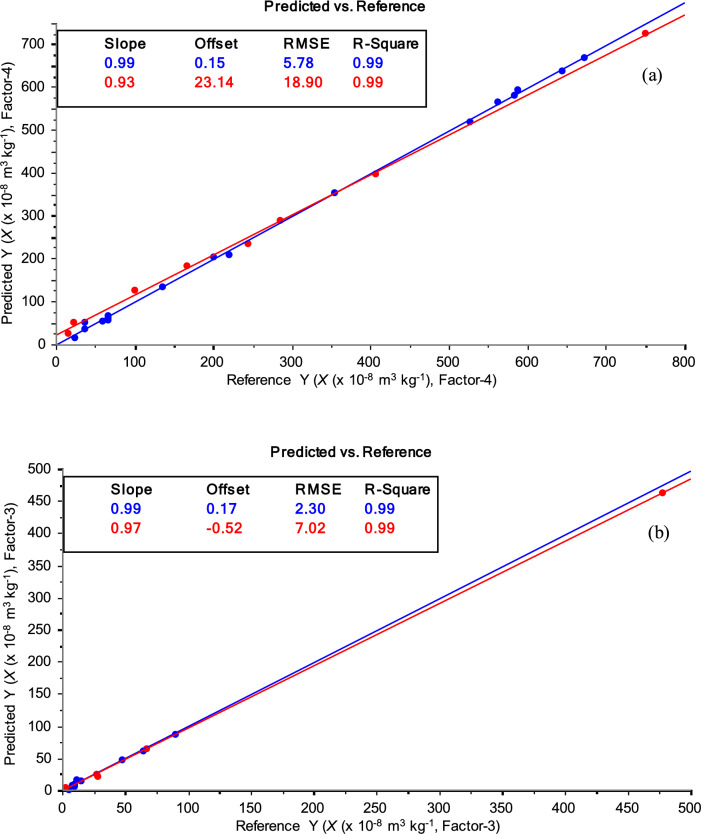
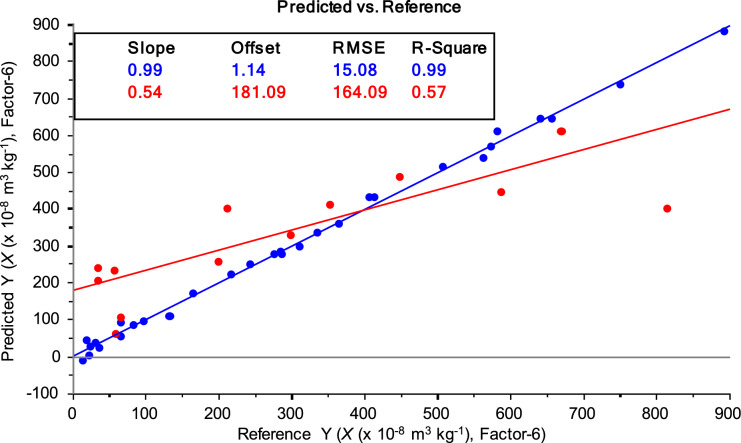
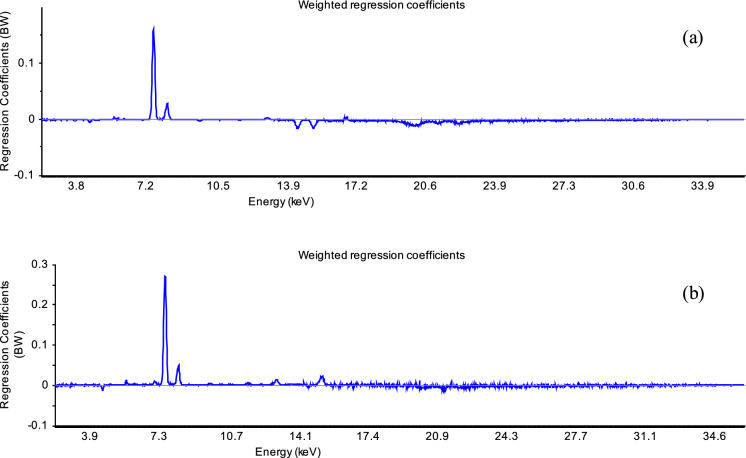
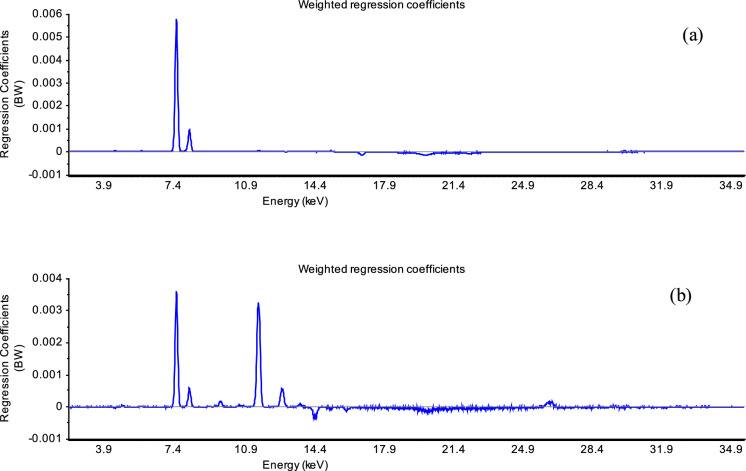
Determining the origin and pathways of contaminants in the natural environment is key to informing any mitigation process. The mass magnetic susceptibility of soils allows a rapid method to measure the concentration of magnetic minerals, derived from anthropogenic activities such as mining or industrial processes, i.e., smelting metals (technogenic origin), or from the local bedrock (of geogenic origin). This is especially effective when combined with rapid geochemical analyses of soils. The use of multivariate analysis (MVA) elucidates complex multiple-component relationships between soil geochemistry and magnetic susceptibility. In the case of soil mining sites, X-ray fluorescence (XRF) spectroscopic data of soils contaminated by mine waste shows statistically significant relationships between magnetic susceptibility and some base metal species (e.g., Fe, Pb, Zn, etc.). Here, we show how qualitative and quantitative MVA methodologies can be used to assess soil contamination pathways using mass magnetic susceptibility and XRF spectra of soils near abandoned coal and W/Sn mines (NW Portugal). Principal component analysis (PCA) showed how the first two primary components (PC-1 + PC-2) explained 94% of the sample variability, grouped them according to their geochemistry and magnetic susceptibility in to geogenic and technogenic groups. Regression analyses showed a strong positive correlation (R2 > 0.95) between soil geochemistry and magnetic properties at the local scale. These parameters provided an insight into the multi-element variables that control magnetic susceptibility and indicated the possibility of efficient assessment of potentially contaminated sites through mass-specific soil magnetism.
Keywords: Geochemistry; Magnetic minerals; Metal contamination; PCA and cluster analysis; Regression analyses; XRF spectra.
© 2024. The Author(s).
Conflict of interest statement
The authors declare that they have no known competing financial interests or personal relationships that could have appeared to influence the work reported in this paper.
Figures
Similar articles
-
Nanominerals and potentially hazardous elements from coal cleaning rejects of abandoned mines: Environmental impact and risk assessment.Chemosphere. 2017 Feb;169:725-733. doi: 10.1016/j.chemosphere.2016.09.125. Epub 2016 Oct 6. Chemosphere. 2017. PMID: 27720476
-
Geochemical position of Pb, Zn and Cd in soils near the Olkusz mine/smelter, South Poland: effects of land use, type of contamination and distance from pollution source.Environ Monit Assess. 2012 Apr;184(4):2517-36. doi: 10.1007/s10661-011-2135-2. Epub 2011 Jun 15. Environ Monit Assess. 2012. PMID: 21674226
-
Integrated approach to assess the environmental impact of mining activities: estimation of the spatial distribution of soil contamination (Panasqueira mining area, Central Portugal).Environ Monit Assess. 2015 Mar;187(3):135. doi: 10.1007/s10661-015-4343-7. Epub 2015 Feb 22. Environ Monit Assess. 2015. PMID: 25702148
-
An integrated overview of metals contamination, source-specific risks investigation in coal mining vicinity soils.Environ Geochem Health. 2023 Nov;45(11):7425-7458. doi: 10.1007/s10653-023-01672-y. Epub 2023 Jul 14. Environ Geochem Health. 2023. PMID: 37452259 Review.
-
Integrated GIS and multivariate statistical analysis for regional scale assessment of heavy metal soil contamination: A critical review.Environ Pollut. 2017 Dec;231(Pt 1):1188-1200. doi: 10.1016/j.envpol.2017.07.021. Epub 2017 Sep 19. Environ Pollut. 2017. PMID: 28939126 Review.
References
-
- Agyeman PC, Ahado SK, Kingsley J, Kebonye NM, Biney JKM, Boruvka L, Vasat R, Kocarek M. Source apportionment, contamination levels, and spatial prediction of potentially toxic elements in selected soils of the Czech Republic. Environmental Geochemistry and Health. 2021;43:601–620. doi: 10.1007/s10653-020-00743-8. - DOI - PubMed
-
- Attoucheik L, Jordanova N, Bayou B, Lagroix F, Jordanova D, Maouche S, Henry B, Boutaleb A. Soil metal pollution form former Zn–Pb mining assessed by geochemical and magnetic investigations: Case study of the Bou Caid area (Tissemsilt, Algeria) Environmental Earth Sciences. 2017;76:298. doi: 10.1007/s12665-017-6622-9. - DOI
-
- Biney JKM, Vašát R, Blöcher JR, Borůvka L, Němeček K. Using an ensemble model coupled with portable X-ray fluorescence and visible near-infrared spectroscopy to explore the viability of mapping and estimating arsenic in agricultural soil. Science of the Total Environment. 2022;818:151805. doi: 10.1016/j.scitotenv.2021.151805. - DOI - PubMed
-
- Blanco M, Coello J, Montoliu I, Romero MA. Orthogonal signal correction in near infrared calibration. Analytica Chimica Acta. 2001;434:125–132. doi: 10.1016/S0003-2670(01)00820-0. - DOI
-
- Bosco GL. Development and application of portable, hand-held x-ray fluorescence spectrometers. Trends in Analytical Chemistry. 2013;45:121–134. doi: 10.1016/j.trac.2013.01.006. - DOI
MeSH terms
Substances
LinkOut - more resources
Full Text Sources
Research Materials
Miscellaneous
