

Harnessing Consumer Wearable Digital Biomarkers for Individualized Recognition of Postpartum Depression Using the All of Us Research Program Data Set: Cross-Sectional Study
- PMID: 38696234
- PMCID: PMC11099816
- DOI: 10.2196/54622
Harnessing Consumer Wearable Digital Biomarkers for Individualized Recognition of Postpartum Depression Using the All of Us Research Program Data Set: Cross-Sectional Study
Abstract
Background: Postpartum depression (PPD) poses a significant maternal health challenge. The current approach to detecting PPD relies on in-person postpartum visits, which contributes to underdiagnosis. Furthermore, recognizing PPD symptoms can be challenging. Therefore, we explored the potential of using digital biomarkers from consumer wearables for PPD recognition.
Objective: The main goal of this study was to showcase the viability of using machine learning (ML) and digital biomarkers related to heart rate, physical activity, and energy expenditure derived from consumer-grade wearables for the recognition of PPD.
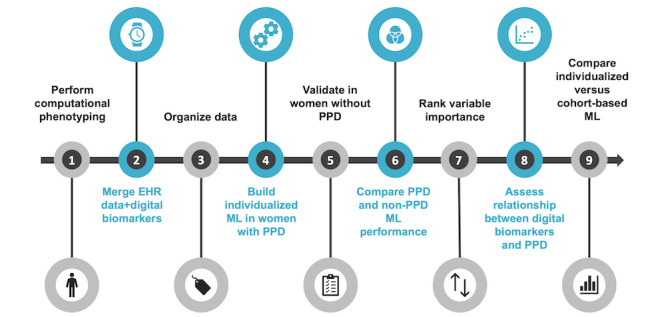
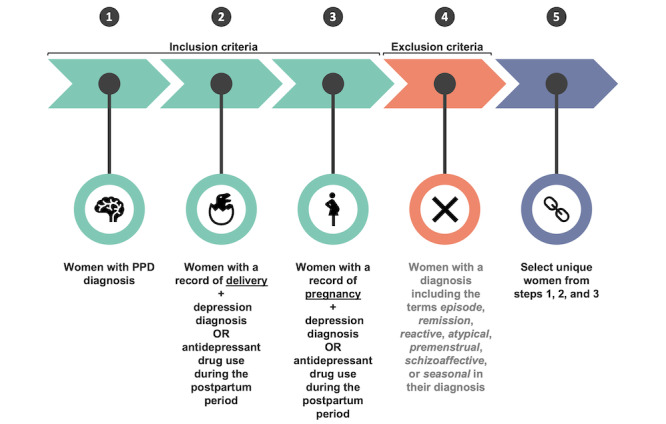
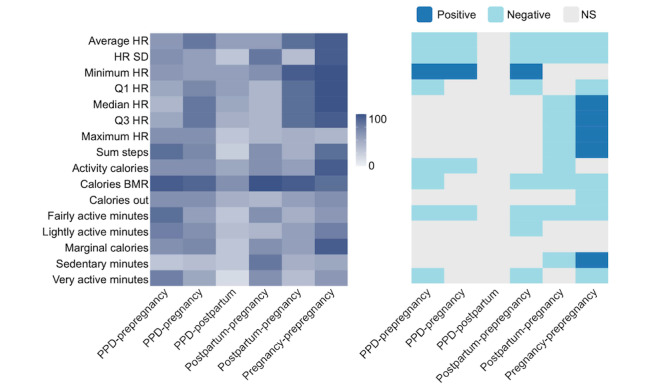
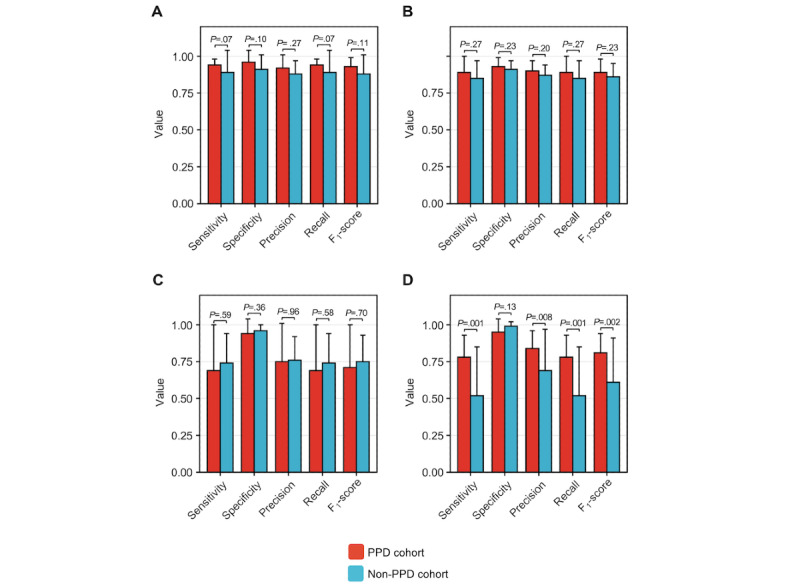
Methods: Using the All of Us Research Program Registered Tier v6 data set, we performed computational phenotyping of women with and without PPD following childbirth. Intraindividual ML models were developed using digital biomarkers from Fitbit to discern between prepregnancy, pregnancy, postpartum without depression, and postpartum with depression (ie, PPD diagnosis) periods. Models were built using generalized linear models, random forest, support vector machine, and k-nearest neighbor algorithms and evaluated using the κ statistic and multiclass area under the receiver operating characteristic curve (mAUC) to determine the algorithm with the best performance. The specificity of our individualized ML approach was confirmed in a cohort of women who gave birth and did not experience PPD. Moreover, we assessed the impact of a previous history of depression on model performance. We determined the variable importance for predicting the PPD period using Shapley additive explanations and confirmed the results using a permutation approach. Finally, we compared our individualized ML methodology against a traditional cohort-based ML model for PPD recognition and compared model performance using sensitivity, specificity, precision, recall, and F1-score.
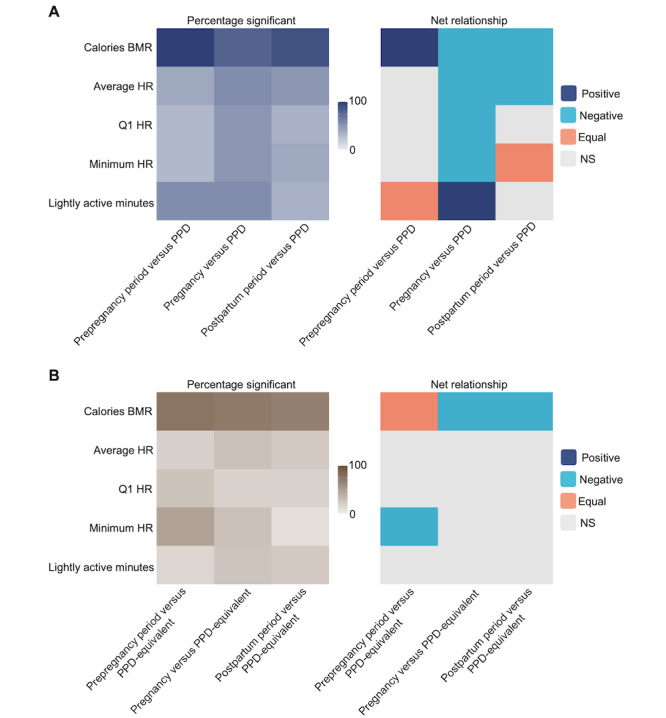
Results: Patient cohorts of women with valid Fitbit data who gave birth included <20 with PPD and 39 without PPD. Our results demonstrated that intraindividual models using digital biomarkers discerned among prepregnancy, pregnancy, postpartum without depression, and postpartum with depression (ie, PPD diagnosis) periods, with random forest (mAUC=0.85; κ=0.80) models outperforming generalized linear models (mAUC=0.82; κ=0.74), support vector machine (mAUC=0.75; κ=0.72), and k-nearest neighbor (mAUC=0.74; κ=0.62). Model performance decreased in women without PPD, illustrating the method's specificity. Previous depression history did not impact the efficacy of the model for PPD recognition. Moreover, we found that the most predictive biomarker of PPD was calories burned during the basal metabolic rate. Finally, individualized models surpassed the performance of a conventional cohort-based model for PPD detection.
Conclusions: This research establishes consumer wearables as a promising tool for PPD identification and highlights personalized ML approaches, which could transform early disease detection strategies.
Keywords: All of Us; Fitbit; machine learning; mobile phone; postpartum depression; wearable device.
©Eric Hurwitz, Zachary Butzin-Dozier, Hiral Master, Shawn T O'Neil, Anita Walden, Michelle Holko, Rena C Patel, Melissa A Haendel. Originally published in JMIR mHealth and uHealth (https://mhealth.jmir.org), 02.05.2024.
Conflict of interest statement
Conflicts of Interest: MAH is a founder of Alamya Health. All other authors declare no other conflicts of interest.
Figures
Update of
-
Harnessing consumer wearable digital biomarkers for individualized recognition of postpartum depression using the All of Us Research Program dataset.medRxiv [Preprint]. 2023 Oct 14:2023.10.13.23296965. doi: 10.1101/2023.10.13.23296965. medRxiv. 2023. Update in: JMIR Mhealth Uhealth. 2024 May 2;12:e54622. doi: 10.2196/54622. PMID: 37873471 Free PMC article. Updated. Preprint.
References
-
- Pearlstein T, Howard M, Salisbury A, Zlotnick C. Postpartum depression. Am J Obstet Gynecol. 2009 Apr;200(4):357–64. doi: 10.1016/j.ajog.2008.11.033. https://europepmc.org/abstract/MED/19318144 S0002-9378(08)02271-0 - DOI - PMC - PubMed
-
- Kavanaugh M, Halterman JS, Montes G, Epstein M, Hightower AD, Weitzman M. Maternal depressive symptoms are adversely associated with prevention practices and parenting behaviors for preschool children. Ambul Pediatr. 2006;6(1):32–7. doi: 10.1016/j.ambp.2005.09.002.S1530-1567(05)00007-9 - DOI - PubMed
-
- Duan Z, Wang Y, Jiang P, Wilson A, Guo Y, Lv Y, Yang X, Yu R, Wang S, Wu Z, Xia M, Wang G, Tao Y, Xiaohong L, Ma L, Shen H, Sun J, Deng W, Yang Y, Chen R. Postpartum depression in mothers and fathers: a structural equation model. BMC Pregnancy Childbirth. 2020 Sep 15;20(1):537. doi: 10.1186/s12884-020-03228-9. https://bmcpregnancychildbirth.biomedcentral.com/articles/10.1186/s12884... 10.1186/s12884-020-03228-9 - DOI - PMC - PubMed
Publication types
MeSH terms
Substances
Grants and funding
- OT2 OD026556/OD/NIH HHS/United States
- U2C OD023196/OD/NIH HHS/United States
- OT2 OD026551/OD/NIH HHS/United States
- U24 OD023121/OD/NIH HHS/United States
- OT2 OD026552/OD/NIH HHS/United States
- OT2 OD026549/OD/NIH HHS/United States
- OT2 OD025337/OD/NIH HHS/United States
- R24 OD011883/OD/NIH HHS/United States
- OT2 OD025277/OD/NIH HHS/United States
- OT2 OD026555/OD/NIH HHS/United States
- OT2 OD026550/OD/NIH HHS/United States
- OT2 OD026553/OD/NIH HHS/United States
- OT2 OD023205/OD/NIH HHS/United States
- OT2 OD025276/OD/NIH HHS/United States
- OT2 OD026557/OD/NIH HHS/United States
- OT2 OD026554/OD/NIH HHS/United States
- OT2 OD023206/OD/NIH HHS/United States
- U24 OD023176/OD/NIH HHS/United States
- OT2 OD026548/OD/NIH HHS/United States
- R01 MH131542/MH/NIMH NIH HHS/United States
- OT2 OD025315/OD/NIH HHS/United States
- U24 OD023163/OD/NIH HHS/United States
- RM1 HG010860/HG/NHGRI NIH HHS/United States
