. 2024 May 2;134(12):e176142.
doi: 10.1172/JCI176142.

BTK drives neutrophil activation for sterilizing antifungal immunity

Affiliations

BTK drives neutrophil activation for sterilizing antifungal immunity

Jigar V Desai et al. J Clin Invest. .

Abstract

We describe a previously unappreciated role for Bruton's tyrosine kinase (BTK) in fungal immune surveillance against aspergillosis, an unforeseen complication of BTK inhibitors (BTKi) used for treating B cell lymphoid malignancies. We studied BTK-dependent fungal responses in neutrophils from diverse populations, including healthy donors, patients who were treated with BTKi, and X-linked agammaglobulinemia patients. Upon fungal exposure, BTK was activated in human neutrophils in a TLR2-, Dectin-1-, and FcγR-dependent manner, triggering the oxidative burst. BTK inhibition selectively impeded neutrophil-mediated damage to Aspergillus hyphae, primary granule release, and the fungus-induced oxidative burst by abrogating NADPH oxidase subunit p40phox and GTPase RAC2 activation. Moreover, neutrophil-specific Btk deletion in mice enhanced aspergillosis susceptibility by impairing neutrophil function, not recruitment or lifespan. Conversely, GM-CSF partially mitigated these deficits by enhancing p47phox activation. Our findings underline the crucial role of BTK signaling in neutrophils for antifungal immunity and provide a rationale for GM-CSF use to offset these deficits in patients who are susceptible.

Keywords: Fungal infections; Immunology; Infectious disease; Innate immunity; Neutrophils.


Figures
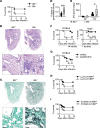
Figure 1
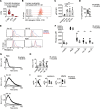
Figure 1. Neutrophil-specific BTK confers protection during pulmonary aspergillosis.
(A) Survival of WT and Btk–/– mice after infection with A. fumigatus (n = 10–14). (B and C) Representative micrographs of (B) H&E-stained and (C) Grocott’s methenamine silver–stained (GMS-stained) lung sections at day 4 after infection. Scale bars: 1 mm (upper panels, B and C), 250 μm (lower panel, B), 25 μm (lower panel, C) (n = 4). (D) Quantification of the proportion of germinating A. fumigatus conidia in GMS-stained lung sections. Each dot depicts an individual affected region of the lung; 4 such areas were randomly chosen per mouse (n = 4 mice) and germinated conidia were enumerated. (E) β-D-glucan levels in lung homogenates at steady state and day 2 after infection. Each dot depicts an individual mouse (n = 5–10). (F) Survival of ibrutinib- or vehicle-treated WT and Rag2–/– mice after infection with A. fumigatus (n = 11–21). (GI) Survival of the indicated mice after infection with A. fumigatus (G, n = 14–15, H, n = 18–28; I, n = 33–34). Box and whisker plots depict values ranging from minimum to maximum (D and E). *P<0.05, **P<0.01, ****P<0.0001, determined using log-rank test (A and FI), 2-sided Mann-Whitney U test (D and E), or 2-sided unpaired t test (E).
Figure 2
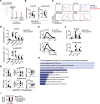
Figure 2. BTK is activated in human neutrophils upon fungal exposure, and pharmacologic BTK inhibition impairs antifungal effector functions.
(A) Transcript levels of BTK in human neutrophils. Also shown are CYBB and CD8A as positive and negative control genes, respectively. Data sourced from GSE145033 (49, 50). (B and C) Representative FACS histograms (B) and geometric mean fluorescence intensity (MFI) summary data (C) for phosphorylated BTK in healthy donor neutrophils at baseline and at the indicated time points after stimulation with serum-opsonized, heat-killed (HK) A. fumigatus (Af) conidia (n = 5). (D) A. fumigatus hyphal damage induced by vehicle- or ibrutinib-treated neutrophils at an effector:target ratio of 8:1 (n = 6). (E and F) Representative histograms (E) and MFI summary data (F) that depict dihydrorhodamine 123 oxidation to rhodamine, in vehicle- or ibrutinib-treated healthy donor neutrophils stimulated as indicated (n = 6). (G and H) Luminol-amplified chemiluminescence. (G) Temporal trace of chemiluminescence-based reactive oxygen species (ROS) (in relative light units: RLU) of vehicle- or ibrutinib-treated healthy donor neutrophils stimulated as indicated. (H) AUC summary data for luminol-amplified chemiluminescence RLU shown in G (n = 9). (I) Vehicle- or ibrutinib-treated healthy donor neutrophils were coincubated with A fumigatus hyphae at an 8:1 effector:target ratio and the indicated granule components were analyzed via ELISA in the supernatants of neutrophil-hyphal cocultures (n = 4). Each dot represents an individual healthy donor. Quantitative data are means ± SEM (C). Box and whisker plots depict values ranging from minimum to maximum (A and F). Ibrutinib concentration, 250 nM. FPM, fragments per million; MPO, myeloperoxidase; MMP-9, Matrix metalloproteinase-9; PMA, phorbol-12-myristate-13-acetate; Af, Aspergillus fumigatus; HK Af, heat-killed Aspergillus fumigatus. *P<0.05, **P<0.01, ***P<0.001, determined using 1-way ANOVA with Dunnett’s multiple comparisons test (C), or 2-sided paired t test (D, F, H, and I). Grubb’s outlier test applied with 1 outlier excluded (I: MPO).
Figure 3
Figure 3. BTK inhibition in vivo, in patients with lymphoma, reduces neutrophil hyphal damage, oxidative burst, and primary granule release.
(A) Schematic outline depicting treatment with BTKi (ibrutinib or acalabrutinib) and the timepoints of blood collection for neutrophil isolation in patients with lymphoma. (BG) Neutrophils were isolated from patients with lymphoma before and at day 3 after treatment initiation of ibrutinib (n = 7-9) or acalabrutinib (n = 4-6). Each dot represents an individual patient. (B) A. fumigatus hyphal damage induced by neutrophils (effector:target ratio, 8:1) (n = 6). (C and D) Representative FACS histograms (C) and MFI summary data (D) depicting dihydrorhodamine 123 oxidation to rhodamine in neutrophils stimulated as indicated (ibrutinib, n = 8; acalabrutinib, n = 5). (E and F) Luminol-amplified chemiluminescence. Temporal chemiluminescence RLU trace (E) and AUC for RLU (F) of neutrophils upon stimulation as indicated (ibrutinib, n = 9; acalabrutinib, n = 4). (G) Patient neutrophils were coincubated with A. fumigatus hyphae (effector:target ratio, 8:1) and the indicated granule components were analyzed via ELISA in the supernatants of neutrophil-hyphal cocultures (ibrutinib, n = 7-8; acalabrutinib, n = 6). (H) Gene ontology (GO) terms of downregulated genes in neutrophils from patients with lymphoma isolated at day 3 after acalabrutinib treatment relative to baseline, using pseudo-bulk processing of single-cell transcriptomes (n = 3). (I) A. fumigatus hyphal damage induced by neutrophils isolated from patients with lymphoma at the indicated timepoints (effector:target ratio, 8:1). Except for panel I, each dot represents an individual patient. For panel I, data are from 3 patients, with 6 technical replicates per patient, where each dot represents a technical replicate, and quantitative data are means ± SEM. BTKi, BTK inhibitor; MPO: myeloperoxidase; MMP-9: Matrix metalloproteinase-9; PMA, phorbol-12-myristate-13-acetate; Af: Aspergillus fumigatus; HK Af: heat-killed Aspergillus fumigatus. *P<0.05, **P<0.01, ***P<0.001 using Kruskal-Wallis test with Dunn’s multiple comparisons test (I), or paired t test (B, D, F, and G).
Figure 4
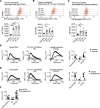
Figure 4. BTK promotes neutrophil hyphal damage, the oxidative burst, and primary granule release.
(A) A. fumigatus hyphal damage induced by neutrophils from healthy donors or patients with XLA (effector:target ratio, 8:1) (n = 9). (B and C) Representative histograms (B) and MFI summary data (C) depicting dihydrorhodamine 123 oxidation to rhodamine in neutrophils from healthy donors or patients with XLA stimulated as indicated (n = 9–10). (D and E) Luminol-based assay of ROS production. Temporal trace of chemiluminescence RLU (D), and AUC for RLU (E), when neutrophils from healthy donors or patients with XLA were stimulated as indicated (n = 7–12). (F) Neutrophils of healthy donors or patients with XLA were coincubated with A. fumigatus hyphae (effector:target ratio, 8:1) and the indicated granule components were analyzed via ELISA in the supernatants (n = 8–22). Each dot in panels A, C, E, and F represents an individual healthy donor or a patient with XLA. (G) A. fumigatus hyphal damage induced by bone marrow neutrophils isolated from WT or Btk–/– mice (effector:target ratio, 32:1) (n = 6). (H) MFI summary data that depict dihydrorhodamine 123 oxidation to rhodamine in neutrophils isolated from the Aspergillus-infected lung of Btk+/+ or Btk–/– mice at day 2 after infection, stimulated as indicated (n = 4). (I) Bone marrow neutrophils were coincubated with A. fumigatus hyphae at a 32:1 effector:target ratio and myeloperoxidase (MPO) was analyzed via ELISA in the supernatants (n = 6). Each dot in panels G and H represents an individual mouse, and each dot in I represents 1–3 technical replicates from 9 individual mice. Box and whisker plots depict values ranging from minimum to maximum (A, C, and EI). MPO: myeloperoxidase; MMP-9: Matrix metalloproteinase-9; PMA, phorbol-12-myristate-13-acetate; Af: Aspergillus fumigatus; HK Af: heat-killed Aspergillus fumigatus; XLA: X-linked agammaglobulinemia. *P<0.05, **P<0.01, ***P<0.001 using 2 sided unpaired t test (A, C, and FI), 2-sided or Mann-Whitney U-test (C and E).
Figure 5
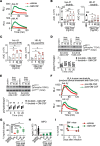
Figure 5. BTK mediates p40phox and RAC2 activation in human neutrophils.
(AC) Immunoblot analysis of p40phox phosphorylation (at T154) in human neutrophils upon stimulation with serum-opsonized heat-killed Aspergillus conidia at the indicated time points. Representative immunoblot images (top panels) and quantified pixel density values (lower panels) are shown. p40phox phosphorylation is shown in healthy donor neutrophils treated with vehicle or ibrutinib (A), in neutrophils from patients with lymphoma, isolated before or at day 3 after initiation of treatment with ibrutinib or acalabrutinib (B), and in neutrophils isolated from healthy donors or patients with XLA (C). (D) Representative immunoblot images depicting active RAC2-GTP and total RAC2. Left: pull-down was performed using unstimulated healthy donor neutrophil lysates in the presence of GDP (negative control) and GTPγS (positive control). Right: pull-down was performed using healthy donor neutrophil lysates, following neutrophil treatment with vehicle, ibrutinib, or buffer (Hank’s balanced salt solution: HBSS) and stimulation with serum-opsonized zymosan. (E) Quantification of the ratio of active RAC2-GTP relative to total RAC2, normalized to the vehicle-treated neutrophils. Each dot depicts an individual healthy donor or patient. Box and whisker plots depict values ranging from minimum to maximum (C). Bars depict mean ± SD. Ibrutinib concentration, 2.5 μM. BTKi, BTK inhibitor. *P<0.05, **P<0.01, ***P<0.001, determined using 2-sided paired t test (A and B), 2-sided Wilcoxon test (B), 2 sided unpaired t test (C) or 2-sided Mann-Whitney U test (C), or 2-sided Welch’s t test (E). Grubb’s outlier test applied with 1 outlier excluded (C: 20 min timepoint).
Figure 6
Figure 6. BTK acts downstream of TLR2, FcγR, and Dectin-1 engagement to promote the neutrophil oxidative burst.
(AC) Representative FACS histograms (upper panels) and mean fluorescence intensity (MFI) summary data (lower panels) for phosphorylated BTK (at Y223) in healthy donor neutrophils at baseline and at the indicated timepoints after stimulation with the TLR2 agonist Pam3CSK4 (A), FcγR-engaging immobilized immune complexes (iIC) (B) or Dectin-1-engaging β-glucan particles (OXCA) (C) (n = 5). (D and E) Luminol-based assay of reactive oxygen species (ROS) production in human neutrophils. Representative temporal traces of chemiluminescence (left panels) and AUC for luminol-amplified chemiluminescence relative light units (RLU) (right panels) when vehicle or ibrutinib-treated (D) or acalabrutinib-treated (E) healthy donor neutrophils were stimulated as indicated (n = 4–6). (F) AUC of luminol-amplified chemiluminescence RLU in neutrophils isolated from ibrutinib- or acalabrutinib- treated lymphoma patients, before and at day 3 after treatment initiation and stimulated as indicated (n = 12). Each dot represents an individual healthy donor or patient. Quantitative data are means ± SEM (AC). Ibrutinib concentration, 250 nM. BTKi, BTK inhibitor; Pam3CSK4: Pam3CysSerLys4; iIC: immobilized immune complexes; OXCA: β-glucan particles (NaCLO-oxidized Candida albicans). *P<0.05, **P<0.01, ***P<0.001, ****P<0.0001 using repeated measures 1-way ANOVA with Šidák’s multiple comparisons test (AC), or 2-sided paired t test (DF) or 2-sided Wilcoxon test (F).
Figure 7
Figure 7. GM-CSF rescues BTK-inhibited neutrophil functional defects and improves survival in Aspergillus-infected Btk–/– mice.
(AC) Luminol-amplified chemiluminescence. Representative relative light units (RLU) trace of ibrutinib-treated healthy donor neutrophils (A), and AUC for RLU in vehicle- or ibrutinib-treated healthy donor (B) or BTKi-treated lymphoma patient neutrophils (C), in response to 50 ng/mL (A) or increasing concentrations of GM-CSF (B and C). Each dot depicts an individual donor (B, n = 5; C, n = 3). (D and E) Representative immunoblot images (top) and pixel density (bottom) of p40phox (phospho-T154; D) and p47phox (phospho-S345; E) upon GM-CSF (50 ng/mL) treatment, in ibrutinib-treated, HK Af stimulated healthy donor neutrophils. (n = 7). (FH) Neutrophils were isolated from a patient with XLA, at baseline, 2 hours, 5 weeks, and 8 weeks after GM-CSF treatment (500 μg, Sargramostim injection, 3× weekly). (F) Representative RLU trace at baseline and 2 hours after GM-CSF treatment initiation, upon stimulation as indicated. (G and H) A. fumigatus hyphal damage (G) and MPO release upon hyphal coincubation (H) (effector:target ratio, 8:1). Each dot represents a single donor (healthy donors; G and H), or a technical replicate (XLA patient; G). (I) Survival of GM-CSF or vehicle-treated Btk–/– mice after infection with A. fumigatus (n = 20). Ibrutinib concentration, 250 nM (AC) or 2.5 μM (D and E). BTKi, BTK inhibitor; IBR, ibrutinib; XLA: X-linked agammaglobulinemia; GM-CSF: granulocyte-macrophage colony-stimulating factor; Af: Aspergillus fumigatus; HK Af: heat-killed Aspergillus fumigatus. Bars depict mean values (C and H). Box and whisker plots depict range from minimum to maximum (B and G). Dotted lines mark 25th and 75th percentile MPO values for healthy donor neutrophils (H). *P<0.05, **P<0.01, ***P<0.001, ****P<0.0001, determined using repeated measures 1-way ANOVA with Dunnett’s multiple comparisons test (B, live-Af; C), Friedman’s test with Dunn’s multiple comparison test (B, HK-Af), 2-sided paired t test (D, E, and G), Mann-Whitney U test (G), or log-rank test (I).

References

    1. Brown GD, et al. Hidden killers: human fungal infections. Sci Transl Med. 2012;4(165):165rv13. doi: 10.1126/scitranslmed.3004404. - DOI - PubMed
    1. Lionakis MS, et al. Immune responses to human fungal pathogens and therapeutic prospects. Nat Rev Immunol. 2023;23(7):433–452. doi: 10.1038/s41577-022-00826-w. - DOI - PMC - PubMed
    1. Latge JP, Chamilos G. Aspergillus fumigatus and Aspergillosis in 2019. Clin Microbiol Rev. 2019;33(1):e00140-18. doi: 10.1128/CMR.00140-18. - DOI - PMC - PubMed
    1. Lionakis MS, et al. Inhibition of B cell receptor signaling by ibrutinib in primary CNS lymphoma. Cancer Cell. 2017;31(6):833–843. doi: 10.1016/j.ccell.2017.04.012. - DOI - PMC - PubMed
    1. Varughese T, et al. Serious infections in patients receiving ibrutinib for treatment of lymphoid cancer. Clin Infect Dis. 2018;67(5):687–692. doi: 10.1093/cid/ciy175. - DOI - PMC - PubMed

MeSH terms

Supplementary concepts