. 2024 Sep;71(3):294-306.
doi: 10.1165/rcmb.2024-0004OC.

Monocyte Production of C1q Potentiates CD8+ T-Cell Function Following Respiratory Viral Infection

Affiliations

Monocyte Production of C1q Potentiates CD8+ T-Cell Function Following Respiratory Viral Infection

Taylor Eddens et al. Am J Respir Cell Mol Biol. 2024 Sep.

Abstract

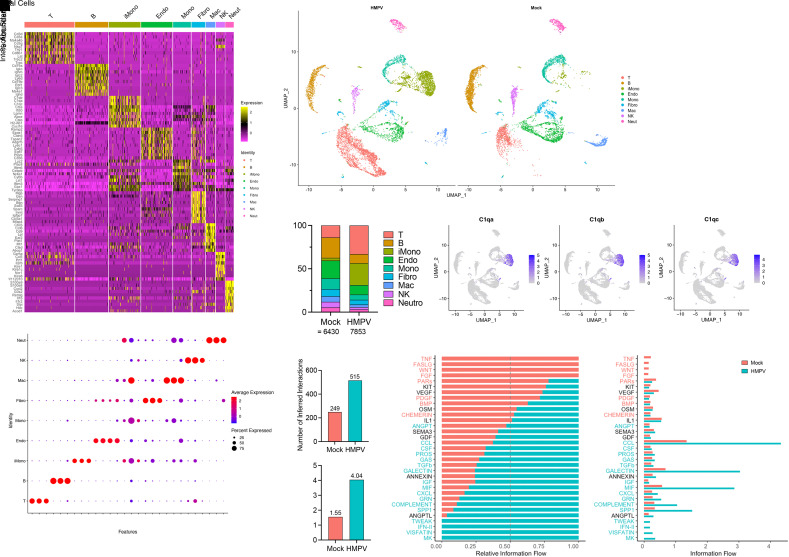
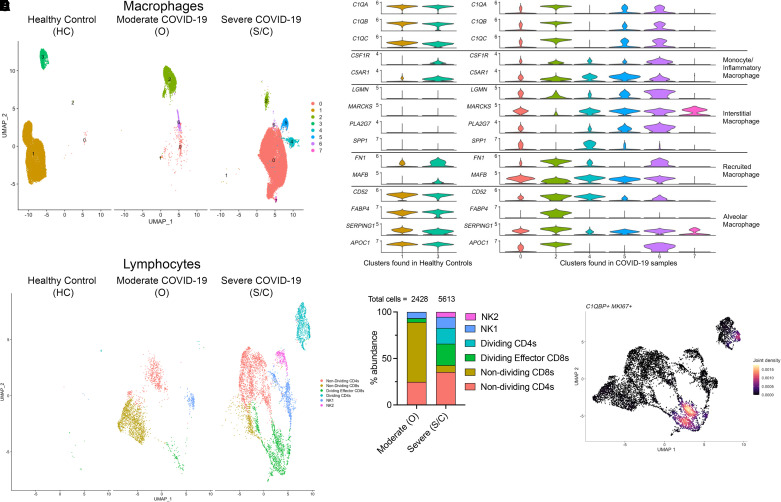
Respiratory viral infections remain a leading cause of morbidity and mortality. Using a murine model of human metapneumovirus, we identified recruitment of a C1q-expressing inflammatory monocyte population concomitant with viral clearance by adaptive immune cells. Genetic ablation of C1q led to reduced CD8+ T-cell function. Production of C1q by a myeloid lineage was necessary to enhance CD8+ T-cell function. Activated and dividing CD8+ T cells expressed a C1q receptor, gC1qR. Perturbation of gC1qR signaling led to altered CD8+ T-cell IFN-γ production, metabolic capacity, and cell proliferation. Autopsy specimens from fatal respiratory viral infections in children exhibited diffuse production of C1q by an interstitial population. Humans with severe coronavirus disease (COVID-19) infection also exhibited upregulation of gC1qR on activated and rapidly dividing CD8+ T cells. Collectively, these studies implicate C1q production from monocytes as a critical regulator of CD8+ T-cell function following respiratory viral infection.

Keywords: COVID-19; antiviral immunity; complement; human metapneumovirus.


Figures

Figure 1.
Figure 1.
Identification of a C1q signature on Day 7 after human metapneumovirus (HMPV) infection. (A) Heat map demonstrating clustering of nine different cell populations after single-cell RNA sequencing. (B) Dot plot with expression of marker genes used for manual annotation for individual clusters. (C) Uniform Manifold Approximation and Projection (UMAP) representation of cell populations in mock-infected versus HMPV-infected animals demonstrating increased inflammatory monocyte (iMono) and T-cell populations after infection. (D) Percent abundance of cell populations by cluster in mock- and HMPV-infected animals. (E) Feature plot of C1qa, C1qb, and C1qc shown as UMAPs. (F) CellChat analysis showing the number of inferred interactions (top) and interaction strength (bottom) in mock- and HMPV-infected animals. (G) Pathway analysis of information flow using CellChat. Single-cell RNA sequencing was performed as a single replicate with two mice in each group. Endo = endothelial cells; Fibro = fibroblasts; Mac = macrophages; Mono = monocytes; Neut = neutrophils; NK = natural killer (cells).
Figure 2.
Figure 2.
Validation of C1q production by iMonos in HMPV infection. (A) C1q protein quantity in BAL specimens from mock- or HMPV-infected animals at various time points (*P < 0.05 and **P < 0.01 by two-way ANOVA with multiple comparisons; n = 1–3 for mock groups; n = 4–12 for infected groups). (B) Enumeration by flow cytometry of iMonos (left) and C1q+ iMonos (right) isolated from the lung at Day 7 after infection (**P < 0.01 by two-way ANOVA with multiple comparisons; n = 3 per group at Day 1 [n = 1 replicate]; n = 5 at Day 7 [n = 2 replicates]). (C) ImageStream analysis of C1q production in iMonos (top) versus CD8 T cells (bottom) at Day 7 after infection (n = 3 per group, with 10,000 events captured from each animal). (D) Immunofluorescent staining of C1q, CD68, and DAPI showing colocalization of C1q with CD68 in the B6 HMPV-infected group alone (white arrowheads) at Day 7 after infection (n = 3–5 per group). Scale bars, 10 μm.
Figure 3.
Figure 3.
Absence of C1q leads to less functional CD8+ T cells. Mice were infected with 2.8 × 106 plaque-forming units of HMPV and lung cells isolated at Day 7 after infection. (A) N11 tetramer–positive CD3+CD8+ leukocytes in the lung are similar between B6 and C1qa−/− mice in cell percentages and absolute cell numbers. (B) CD8+ T cells in C1qa−/− mice had impaired production of effector cytokines, granzyme B, IL-2, and IFN-γ following ex vivo peptide stimulation. (C) Combinatorial analysis of functional markers revealed that CD8+ T cells from C1q−/− mice had a significantly reduced portion of cells with 3 or 4 markers. Bar graphs (left) show raw data, and pie charts (right) reflect a summary of raw data. (D) Increased weight loss was seen in C1qa−/− mice infected with C-202 (*P < 0.05 by two-way ANOVA with multiple comparisons). (E) Increased clinical score in C1qa−/− mice infected with C-202 calculated by the quantification of hunched posture, fur grooming, respiratory rate, and activity (*P < 0.05 by two-way ANOVA with multiple comparisons). (F) Experimental schematic for four-way transplant. (G) iMono cell number isolated from the lungs at Day 7 after infection in the transplant model. (H) The recipients that received B6 bone marrow (BM) had significantly more C1q-expressing iMonos compared with recipients that received C1qa−/− BM. (I) Recipient mice that received C1qa−/− BM had CD8+ T cells that produced less granzyme B compared with mice that received B6 BM (*P < 0.05, **P < 0.01, and ***P < 0.005 by two-way ANOVA with multiple comparisons). Data in A–C represent two experimental replicates (n = 3 mice per group per replicate). Data in D–G represent one experimental replicate (n = 3–5 mice per group). PFU = plaque-forming units.
Figure 4.
Figure 4.
gC1qR blockade leads to reduced CD8+ T cell function. (A) Recombinant C1q bound to cultured murine CD8+ T cells. Representative flow plots (left) and quantification of C1q-FITC+ CD8+ T cells (right). Data of one replicate are shown (n = 3 per group). (B) UMAP visualization of T cells by single-cell RNA sequencing split by infection status from Day 7 after infection. (C) Violin plots showing expression of C1qbp (i.e., gC1qR), Cd8a, Sell, Cd4, Gzmb, and Mki67. (D) Abundance plots of T-cell subsets. (E) ELISpot of IFN-γ in murine lung lymphocytes undergoing ex vivo class I peptide stimulation on Day 7 after infection with or without αgC1qR treatment. Additionally, PDL1 blockade increased IFN-γ production, and combination treatment resulted in decreased IFN-γ production (top). The bottom panel shows IFN-γ ELISpot with the addition of recombinant C1q with or without αgC1qR. Two replicates (n = 3 per group per replicate) were performed in triplicate. (F) Purified CD8+ T cells on Day 7 after infection had diminished spare respiratory capacity when treated with αgC1qR (*P < 0.05, **P < 0.01, ***P < 0.005, and ****P < 0.001 by unpaired t test or two-way ANOVA with multiple comparisons). (G) Administration of αgC1qR oropharyngeally in vivo on Days 5 and 6 after infection reduces CD8 T-cell effector function (n = 2 replicates; n = 2–3 per group per replicate; *P < 0.05 by Student’s t test). FCCP = carbonyl cyanide-4-(trifluoromethoxy)phenylhydrazone; Gzmb = granzyme B; OCR = oxygen consumption rate; SRC = spare respiratory capacity.
Figure 5.
Figure 5.
C1q-producing cells are present in the lungs of children with fatal respiratory viral infection. Immunofluorescent staining of human lung tissue (A, resection from child with pleural blebs; B, autopsy specimen from a child who died of HMPV; C, autopsy specimen from a child who died of rhinovirus/parainfluenza infection). C1q (green) is present in alveolar spaces in a healthy child, with redistribution to interstitial spaces in infectious conditions. Scale bars, 1 mm. PIV = parainfluenza virus.
Figure 6.
Figure 6.
Transcriptional evidence C1q:gC1qR axis activation in severe coronavirus disease (COVID-19) cases. (A) UMAP of macrophage/monocyte populations identified in BAL fluid from healthy controls, moderate COVID-19 cases, and severe COVID-19 cases demonstrating eight clusters. (B) Stacked violin plots showing expression levels of C1QA, C1QB, C1QC, and various transcriptional markers of macrophage states from clusters identified from healthy controls (left) or patients with COVID-19 (right). (C) UMAPs of the subset of T cells from the overall dataset separated by disease state. (D) Abundance plots of various subsets in moderate versus severe COVID-19 disease. (E) Coexpression of MKI67 (marker of rapid division) and C1QBP is largely confined to the rapidly dividing CD8 cluster. HC = healthy control; S/C = severe COVID-19 cases.

Update of

Comment in

References

    1. Li Y, Nair H. Trends in the global burden of lower respiratory infections: the knowns and the unknowns. Lancet Infect Dis . 2022;22:1523–1525. - PubMed
    1. GBD 2019 LRI Collaborators. Age-sex differences in the global burden of lower respiratory infections and risk factors, 1990-2019: results from the Global Burden of Disease Study 2019. Lancet Infect Dis . 2022;22:1626–1647. - PMC - PubMed
    1. Foley DA, Sikazwe CT, Minney-Smith CA, Ernst T, Moore HC, Nicol MP, et al. An unusual resurgence of human metapneumovirus in Western Australia following the reduction of non-pharmaceutical interventions to prevent SARS-CoV-2 transmission. Viruses . 2022;14:2135. - PMC - PubMed
    1. Olsen SJ, Winn AK, Budd AP, Prill MM, Steel J, Midgley CM, et al. Changes in influenza and other respiratory virus activity during the COVID-19 pandemic-United States, 2020-2021. Am J Transplant . 2021;21:3481–3486. - PMC - PubMed
    1. Martin MD, Badovinac VP. Defining memory CD8 T cell. Front Immunol . 2018;9:2692. - PMC - PubMed

MeSH terms

LinkOut - more resources