. 2024 May 2;19(5):e0295849.
doi: 10.1371/journal.pone.0295849. eCollection 2024.

Poloxamer-188 as a wetting agent for microfluidic resistive pulse sensing measurements of extracellular vesicles

Affiliations

Poloxamer-188 as a wetting agent for microfluidic resistive pulse sensing measurements of extracellular vesicles

Mona Shahsavari et al. PLoS One. .

Abstract

Introduction: Microfluidic resistive pulse sensing (MRPS) can determine the concentration and size distribution of extracellular vesicles (EVs) by measuring the electrical resistance of single EVs passing through a pore. To ensure that the sample flows through the pore, the sample needs to contain a wetting agent, such as bovine serum albumin (BSA). BSA leaves EVs intact but occasionally results in unstable MRPS measurements. Here, we aim to find a new wetting agent by evaluating Poloxamer-188 and Tween-20.

Methods: An EV test sample was prepared using an outdated erythrocyte blood bank concentrate. The EV test sample was diluted in Dulbecco's phosphate-buffered saline (DPBS) or DPBS containing 0.10% BSA (w/v), 0.050% Poloxamer-188 (v/v) or 1.00% Tween-20 (v/v). The effect of the wetting agents on the concentration and size distribution of EVs was determined by flow cytometry. To evaluate the precision of sample volume determination with MRPS, the interquartile range (IQR) of the particles transit time through the pore was examined. To validate that DPBS containing Poloxamer-188 yields reliable MRPS measurements, the repeatability of MRPS in measuring blood plasma samples was examined.

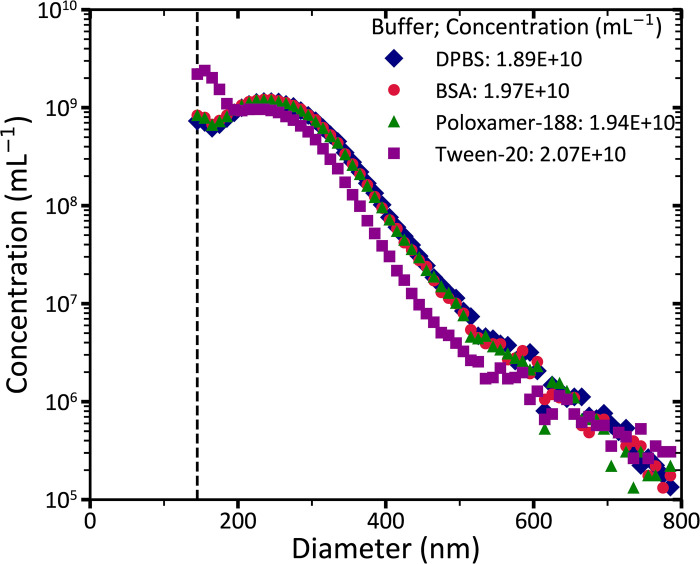
Results: Flow cytometry results show that the size distribution of EVs in Tween 20, in contrast to Poloxamer-188, differs from the control measurements (DPBS and DPBS containing BSA). MRPS results show that Poloxamer-188 improves the precision of sample volume determination compared to BSA and Tween-20, because the IQR of the transit time of EVs in the test sample is 11 μs, which is lower than 56 μs for BSA and 16 μs for Tween-20. Furthermore, the IQR of the transit time of particles in blood samples with Poloxamer-188 are 14, 16, and 14 μs, which confirms the reliability of MRPS measurements.

Conclusion: The solution of 0.050% Poloxamer-188 in DPBS does not lyse EVs and results in repeatable and unimpeded MRPS measurements.


Conflict of interest statement

The authors report no conflicts of interest.

Figures

Fig 1
Fig 1. Microfluidic resistive pulse sensing (MRPS) data of a human blood plasma sample that is 150-fold diluted in Dulbecco’s phosphate-buffered saline (DPBS) containing 0.10% bovine serum albumin (BSA).
(A) Diamond, circle, and triangle symbols represent the particle size distribution (PSD) of the plasma sample measured in 3 independent MRPS measurements with a C400 cartridge. Dashed lines visualize fitted power law functions on PSDs. The parameters and coefficient of determinations for the fitted power law functions are as follows: a = 6.822× 10²¹, k = 5.678, and R2 = 0.98 for run 1; a = 3.901 × 10¹⁸, k = 4.534, and R2 = 0.86 for run 2; and a = 7.108 × 10²², k = 6.219, and R2 = 0.97 for run 3. The vertical dashed line at 75 nm represents the smallest reported bin size for the MRPS measurements. (B) The distribution of particle transit time in three independent MRPS measurements with a bin width of 5 μs. (C) Normalized signal (a.u.) versus time for particles in human blood plasma measured in run 1. The horizontal dashed line represents the threshold of peak detection, green dots are peaks that are representative of particle events, blue dots are noise events, and red dots are incorrect particle events that were determined based on the manufacturer’s peak filter recommendations.
Fig 2
Fig 2. Flow cytometry (FCM) data of the extracellular vesicle (EV) test sample.
(A) Concentration versus size of particles. The vertical dashed line represents the trigger threshold of FCM, which is 145 nm. Diamonds represent the particle size distribution (PSD) of all particles in the EV test sample, circles represent the PSD of EVs stained with cluster of differentiation (CD) 235a, and triangles represent the PSD of remaining particles in the EV test sample after detergent lysis of EVs with 0.10% Triton X-100 in Dulbecco’s phosphate-buffered saline (DPBS). To relate scatter to size, EVs were modelled as particles with a core refractive index (RI) of 1.38, a shell RI of 1.48 and a shell thickness of 6 nm. (B) Fluorescence intensity of phycoerythrin (PE) versus size of particles measured in the EV test sample. The fluorescent gate of 118 molecules of equivalent soluble fluorochrome (MESF), which was based on an unstained control, was exceeded by 68% of particles. (C) Refractive index versus size of measured particles with FCM in the applicable range of the flow cytometry scatter ratio (Flow-SR; 47% of all detected particles in the EV test sample are within the applicable range of Flow-SR), among which 89% of particles have a RI <1.42.
Fig 3
Fig 3. Concentration versus the size of particles in the extracellular vesicle (EV) test sample measured with flow cytometry (FCM).
The vertical dashed line represents the trigger threshold of FCM, which is 145 nm. Diamonds, circles, triangles, and squares represent the particle size distribution of the 264-fold diluted EV test samples in Dulbecco’s phosphate-buffered saline (DPBS) or DPBS containing 0.10% BSA (w/v), 0.050% Poloxamer-188 (v/v), or 1.00% Tween-20 (v/v), respectively. To relate scatter to size, EVs were modelled as particles with a core refractive index of 1.38, a shell refractive index of 1.48 and a shell thickness of 6 nm.
Fig 4
Fig 4. Microfluidic resistive pulse sensing (MRPS) measurements of the extracellular vesicle (EV) test sample.
(A) Red, green and blue lines show the transit time distribution (5-μs bins) of events with a signal/noise >10 of the diluted EV test sample in Dulbecco’s phosphate-buffered saline (DPBS) containing 0.10% bovine serum albumin (BSA) (w/v), 0.050% Poloxamer-188 (v/v), or 1.00% Tween-20 (v/v), respectively. The interquartile range of the transit time of particles through the pore is 11 μs for Poloxamer-188, 56 μs for BSA and 16 μs for Tween-20. (B) Concentration versus the size of all particles in the EV test sample, which was diluted in DPBS containing BSA (Triangle), Poloxamer-188 (diamond), or Tween-20 (circle). The dashed line shows the lower limit of detection for size measurements with MRPS.
Fig 5
Fig 5. Microfluidic resistive pulse sensing (MRPS) data of 150-fold diluted blood plasma in Dulbecco’s phosphate-buffered saline (DPBS) containing 0.050% Poloxamer-188.
(A) Diamonds, circles, and triangles show the particle size distribution (PSD) of 3 independent MRPS measurements of the plasma sample fitted with power law functions. The determined parameters and coefficient of determinations for the fitted power law functions are as follows: a = 7.734× 10²⁰, k = 5.228, and R2 = 0.98 for run 1; a = 5.235× 10²⁰, k = 5.158, and R2 = 0.95 for run 2; and a = 6.911× 10¹⁹, k = 4.769, and R2 = 0.95 for run 3. The vertical dashed line represents the smallest reported bin size in this study for the MRPS measurements using C400 cartridges. (B) The distribution of particles transit times in three MRPS measurements of the plasma sample with a bin width of 5 μs.

References

    1. Yuana Y, Sturk A, Nieuwland R. Extracellular vesicles in physiological and pathological conditions. Blood Rev. 2013;27: 31–39. doi: 10.1016/j.blre.2012.12.002 - DOI - PubMed
    1. Tkach M, Théry C. Communication by Extracellular Vesicles: Where We Are and Where We Need to Go. Cell. 2016;164: 1226–1232. doi: 10.1016/j.cell.2016.01.043 - DOI - PubMed
    1. de Rond L, Libregts SFWM, Rikkert LG, Hau CM, van der Pol E, Nieuwland R, et al.. Refractive index to evaluate staining specificity of extracellular vesicles by flow cytometry. J Extracell Vesicles. 2019;8: 1643671. doi: 10.1080/20013078.2019.1643671 - DOI - PMC - PubMed
    1. van der Pol E, de Rond L, Coumans FAW, Gool EL, Böing AN, Sturk A, et al.. Absolute sizing and label-free identification of extracellular vesicles by flow cytometry. Nanomedicine. 2018;14: 801–810. doi: 10.1016/j.nano.2017.12.012 - DOI - PubMed
    1. Song Y, Zhang J, Li D. Microfluidic and nanofluidic resistive pulse sensing: A review. Micromachines. MDPI AG; 2017. doi: 10.3390/mi8070204 - DOI - PMC - PubMed

Publication types

MeSH terms