. 2024 May 2;20(5):e1011229.
doi: 10.1371/journal.pgen.1011229. eCollection 2024 May.

Collaborative Cross mice have diverse phenotypic responses to infection with Methicillin-resistant Staphylococcus aureus USA300

Affiliations

Collaborative Cross mice have diverse phenotypic responses to infection with Methicillin-resistant Staphylococcus aureus USA300

Aravindh Nagarajan et al. PLoS Genet. .

Abstract

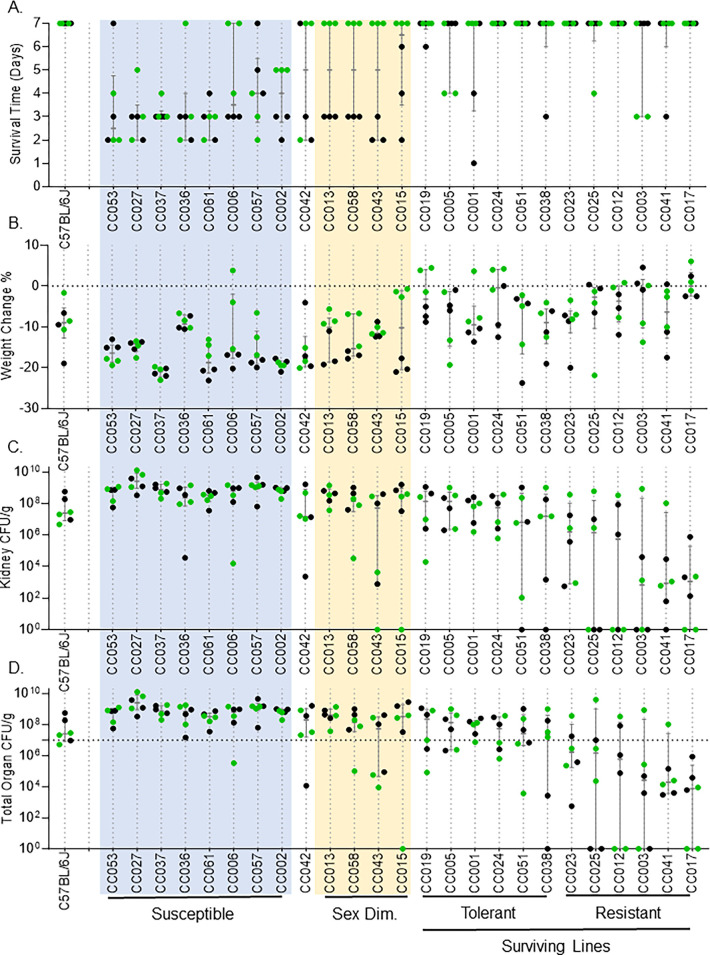
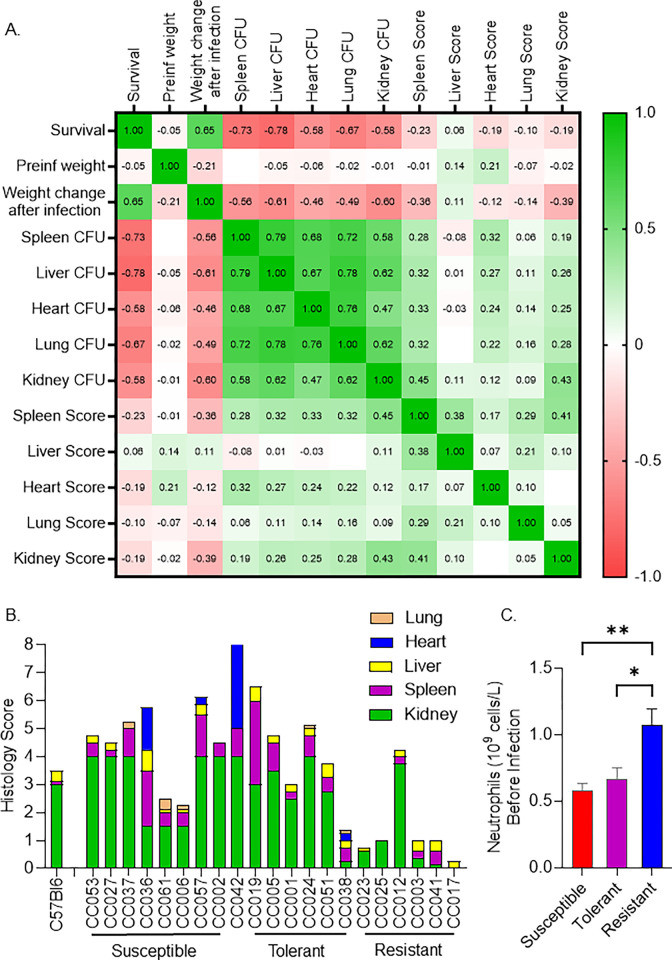
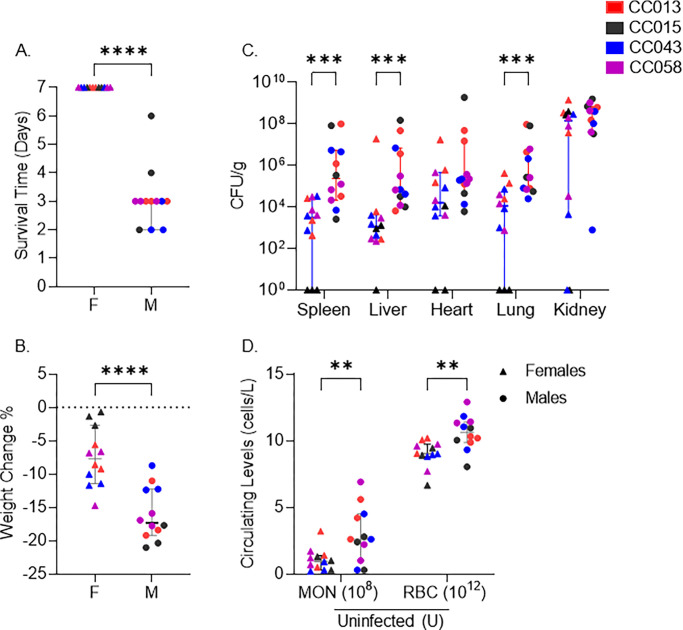
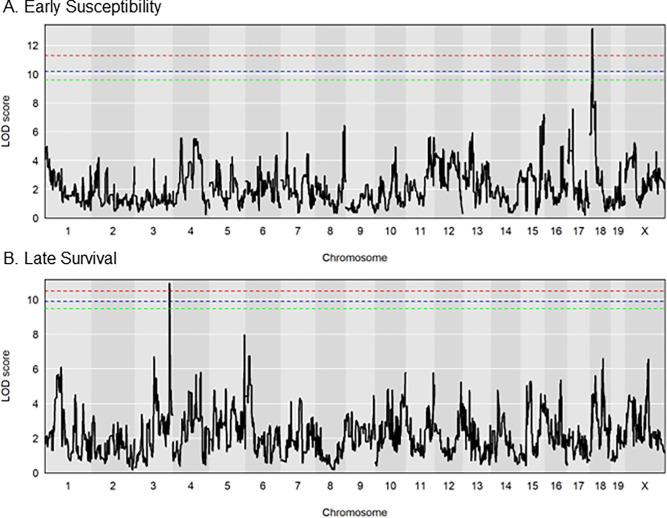
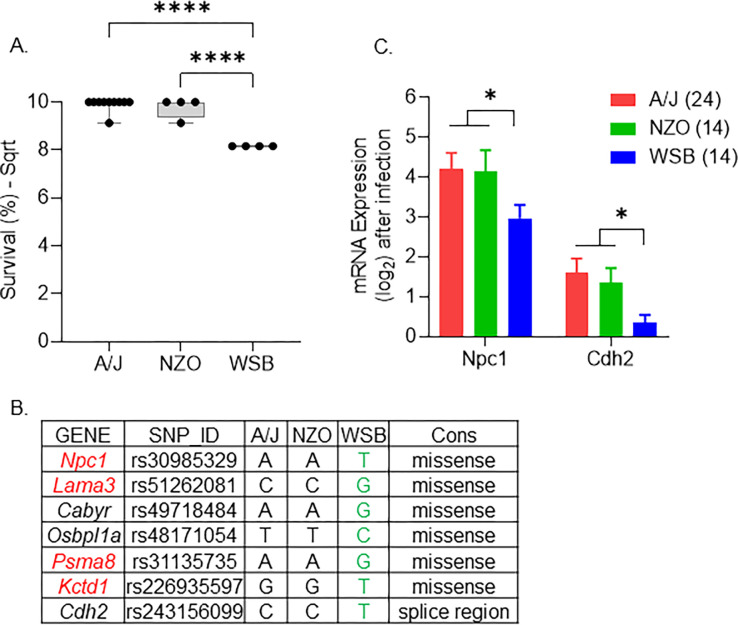
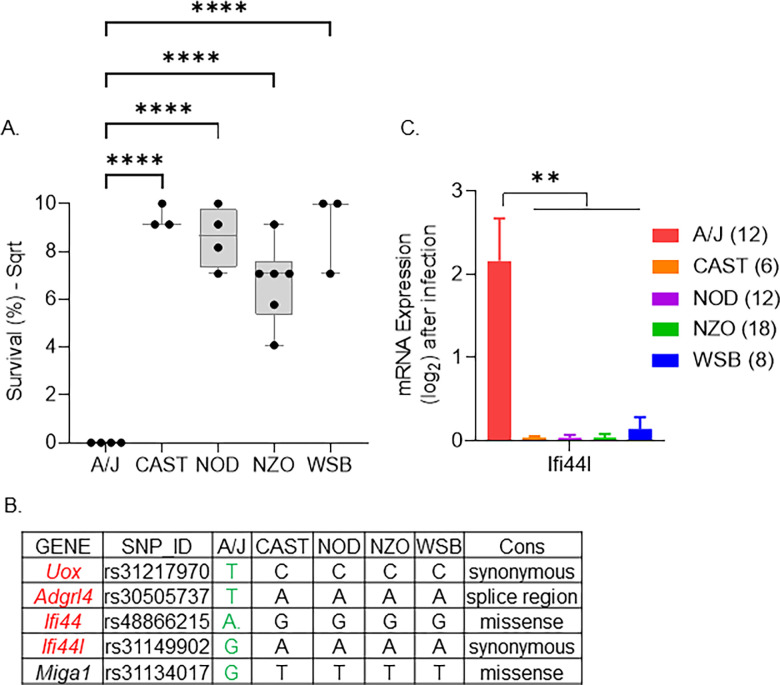
Staphylococcus aureus (S. aureus) is an opportunistic pathogen causing diseases ranging from mild skin infections to life threatening conditions, including endocarditis, pneumonia, and sepsis. To identify host genes modulating this host-pathogen interaction, we infected 25 Collaborative Cross (CC) mouse strains with methicillin-resistant S. aureus (MRSA) and monitored disease progression for seven days using a surgically implanted telemetry system. CC strains varied widely in their response to intravenous MRSA infection. We identified eight 'susceptible' CC strains with high bacterial load, tissue damage, and reduced survival. Among the surviving strains, six with minimal colonization were classified as 'resistant', while the remaining six tolerated higher organ colonization ('tolerant'). The kidney was the most heavily colonized organ, but liver, spleen and lung colonization were better correlated with reduced survival. Resistant strains had higher pre-infection circulating neutrophils and lower post-infection tissue damage compared to susceptible and tolerant strains. We identified four CC strains with sexual dimorphism: all females survived the study period while all males met our euthanasia criteria earlier. In these CC strains, males had more baseline circulating monocytes and red blood cells. We identified several CC strains that may be useful as new models for endocarditis, myocarditis, pneumonia, and resistance to MRSA infection. Quantitative Trait Locus (QTL) analysis identified two significant loci, on Chromosomes 18 and 3, involved in early susceptibility and late survival after infection. We prioritized Npc1 and Ifi44l genes as the strongest candidates influencing survival using variant analysis and mRNA expression data from kidneys within these intervals.


Conflict of interest statement

The authors have declared that no competing interests exist.

Figures

Fig 1
Fig 1. CC strains exhibit a diverse response to MRSA infection.
After intravenous infection with MRSA USA300 as described in the Materials and Methods section, we show: A. survival time, B. percent weight change after infection, C. kidney colonization, and D. Total organ colonization; horizontal dotted line represents inoculum dose. CC strains are shown in the ascending order of survival. If survival was equal between two or more strains, strains are arranged in descending order of total organ colonization (the combined colonization of all organs collected). Dots represent individual mice; black dots represent males; green dots represent females. The median and interquartile range are shown for each strain.
Fig 2
Fig 2. Correlation of tissue colonization, histology scores and blood parameters with survival.
A. Heat map showing Spearman correlation ‘R’ values between survival, weight change, organ colonization, and tissue damage scores. B. A stacked bar plot showing the median tissue damage score for five organs (Kidney = green, spleen = purple, liver = yellow, heart = blue, lung = orange). Pathology in each tissue was blindly scored by a pathologist on a scale of 0 = no damage, to 4 = severe damage. C. Mean neutrophil levels in uninfected mice. Mann-Whitney tests were performed to determine statistical significance (* = P < 0.05, ** = P < 0.01).
Fig 3
Fig 3. Sexual dimorphism in survival after MRSA infection.
We present pooled data for the four strains that exhibited sexual dimorphism in survival: A. survival time, B. percent weight change after infection, C. colonization across organs, and D. pre-infection monocyte and red blood cell counts (U–Uninfected). Each point represents an individual mouse; filled circles represent males; triangles represent females. Each color represents a CC strain as noted in the legend. Medians with 95% confidence interval are shown for each strain. A, B, and D–Student’s T-test and C.
Fig 4
Fig 4. Genomic regions involved in survival after MRSA infection.
LOD plots for square root transformed survival phenotype (percentage of animals that survived at the end of each day). A. Early susceptibility in MRSA infection (ESMI, day 2 post-infection) peak on chromosome 18. B. Late survival in MRSA infection (LSMI, day 7 post-infection) peak on chromosome 3. The dotted (Red– 95%, Blue– 90%, Green– 85%) lines represent the significant LOD scores for 999 permutations.
Fig 5
Fig 5. Strongest candidate genes on chromosome 18 for early susceptibility.
A. Box plot showing the founder allele contribution at the highest marker on the peak. Each dot represents a strain, lines represent minimum to maximum. B. Genes with high-impact variants shortlisted using the founder effect pattern. C. Mean kidney mRNA expression values after infection (log-transformed). The number of animals is given within brackets. Lines represent standard error of the mean values. ANOVA with multiple comparison correction using Tukey test was performed (**** = P < 0.0001).
Fig 6
Fig 6. Strongest candidate genes on chromosome 3 for late survival.
A. Box plot showing the founder allele contribution at the highest marker on the peak. Each dot represents a strain, lines represent minimum to maximum. B. Genes with high-impact variants shortlisted using the founder effect pattern. C. Mean kidney mRNA expression values after infection (log-transformed). The number of animals sequenced for each founder allele is within the brackets. Lines represent standard error of the mean values. ANOVA with multiple comparison correction Tukey test was performed (**** = P <0.0001).

Similar articles

Cited by

References

    1. Lowy FD. Staphylococcus aureus infections. N Engl J Med. 1998;339(8):520–32. doi: 10.1056/NEJM199808203390806 - DOI - PubMed
    1. Krismer B, Weidenmaier C, Zipperer A, Peschel A. The commensal lifestyle of Staphylococcus aureus and its interactions with the nasal microbiota. Nat Rev Microbiol. 2017;15(11):675–87. doi: 10.1038/nrmicro.2017.104 - DOI - PubMed
    1. Wertheim HF, Melles DC, Vos MC, van Leeuwen W, van Belkum A, Verbrugh HA, et al.. The role of nasal carriage in Staphylococcus aureus infections. The Lancet infectious diseases. 2005;5(12):751–62. doi: 10.1016/S1473-3099(05)70295-4 - DOI - PubMed
    1. Laux C, Peschel A, Krismer B. Staphylococcus aureus Colonization of the Human Nose and Interaction with Other Microbiome Members. Microbiol Spectr. 2019;7(2). doi: 10.1128/microbiolspec.GPP3-0029-2018 - DOI - PMC - PubMed
    1. Tong SY, Davis JS, Eichenberger E, Holland TL, Fowler VG Jr. Staphylococcus aureus infections: epidemiology, pathophysiology, clinical manifestations, and management. Clin Microbiol Rev. 2015;28(3):603–61. doi: 10.1128/CMR.00134-14 - DOI - PMC - PubMed

MeSH terms