. 2024 Jul;11(26):e2306348.
doi: 10.1002/advs.202306348. Epub 2024 May 2.

Brain Metastasis from EGFR-Mutated Non-Small Cell Lung Cancer: Secretion of IL11 from Astrocytes Up-Regulates PDL1 and Promotes Immune Escape

Affiliations

Brain Metastasis from EGFR-Mutated Non-Small Cell Lung Cancer: Secretion of IL11 from Astrocytes Up-Regulates PDL1 and Promotes Immune Escape

Mengyi Tang et al. Adv Sci (Weinh). 2024 Jul.

Abstract

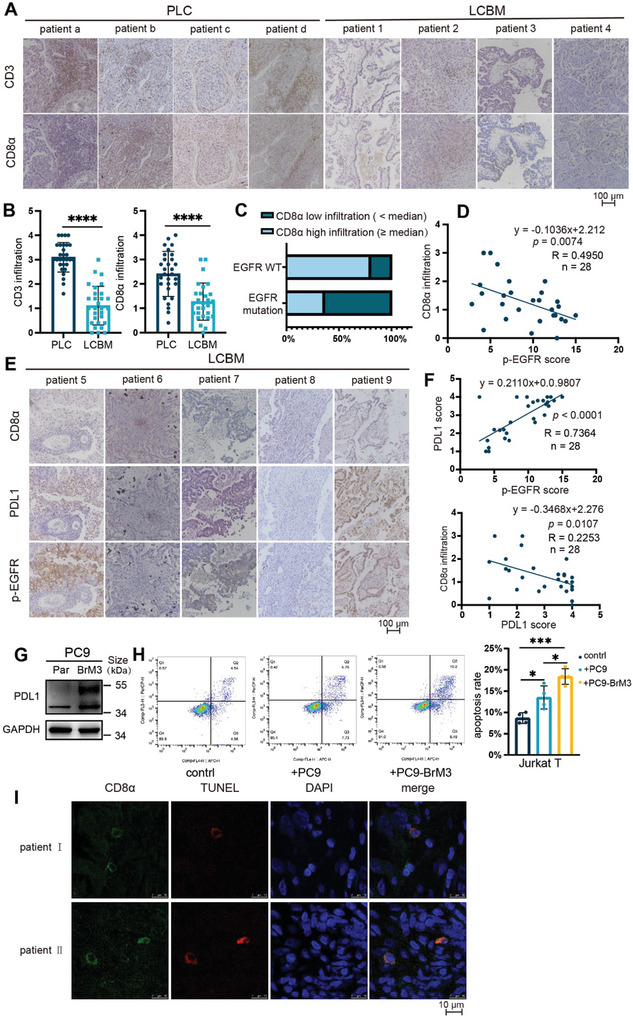
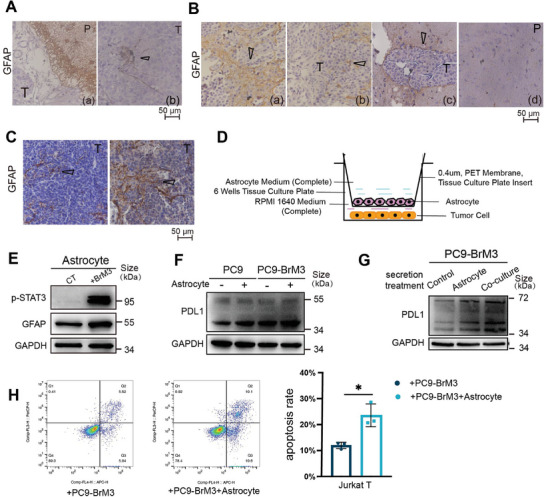
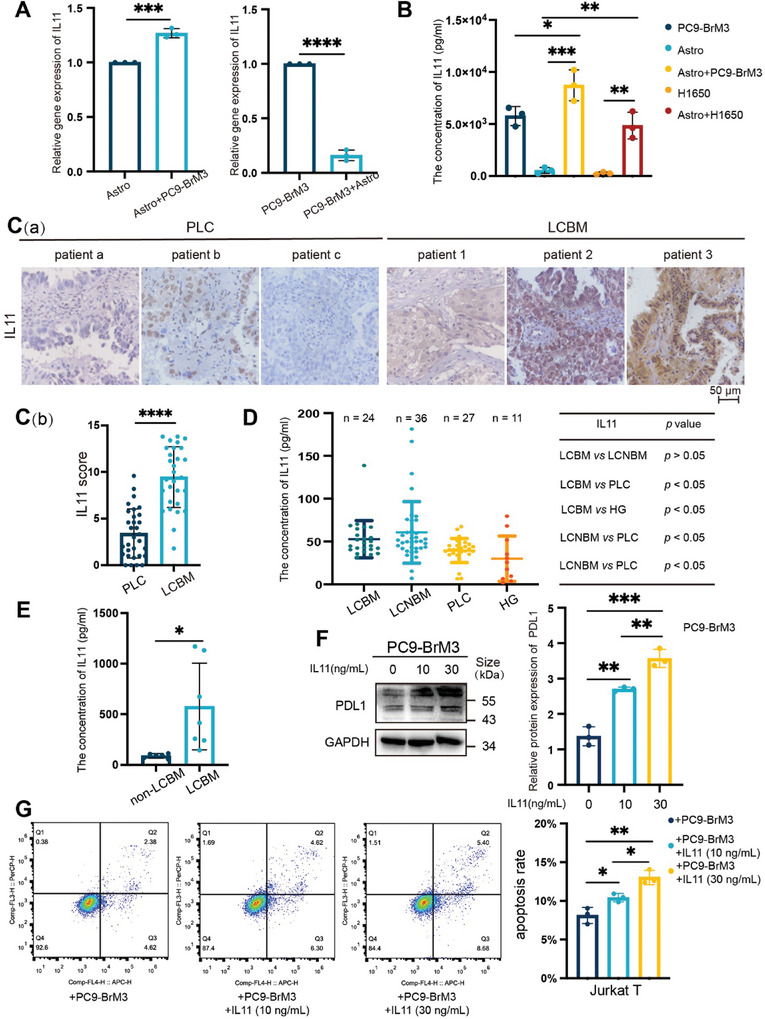
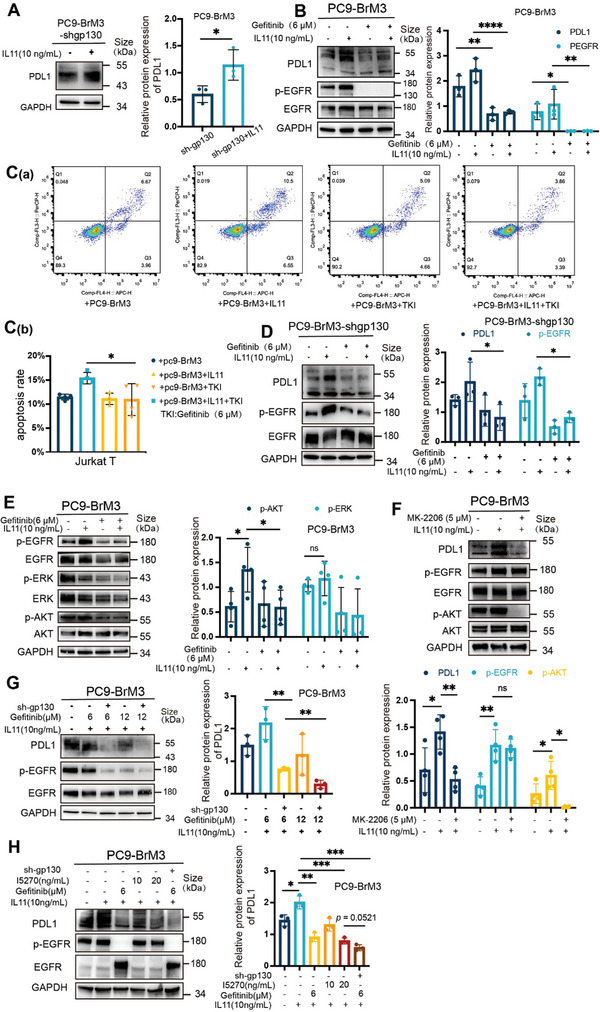
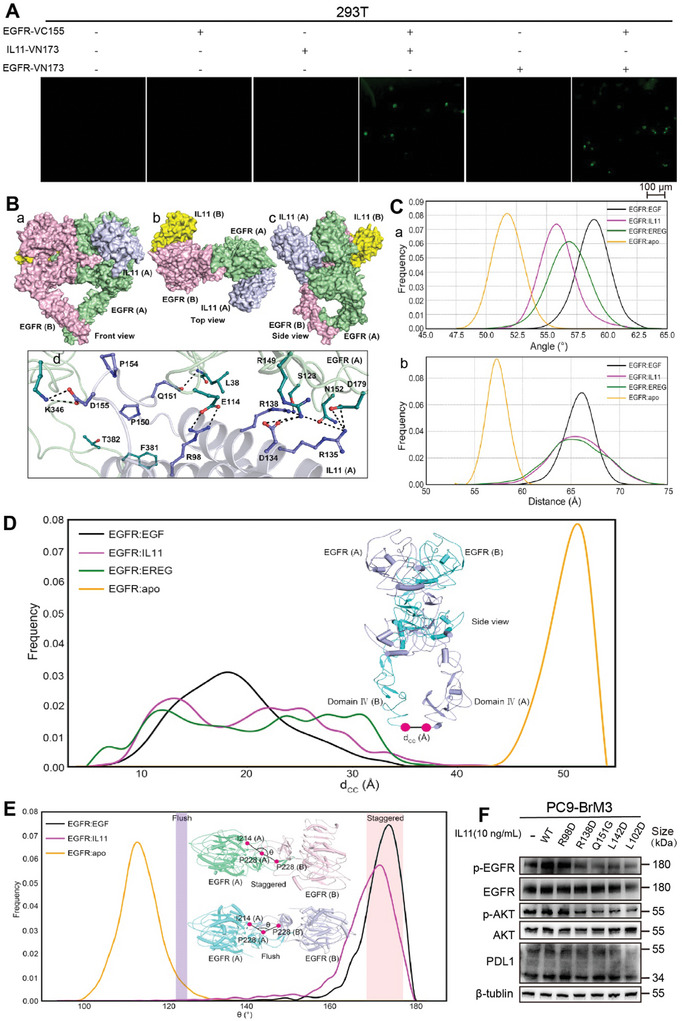
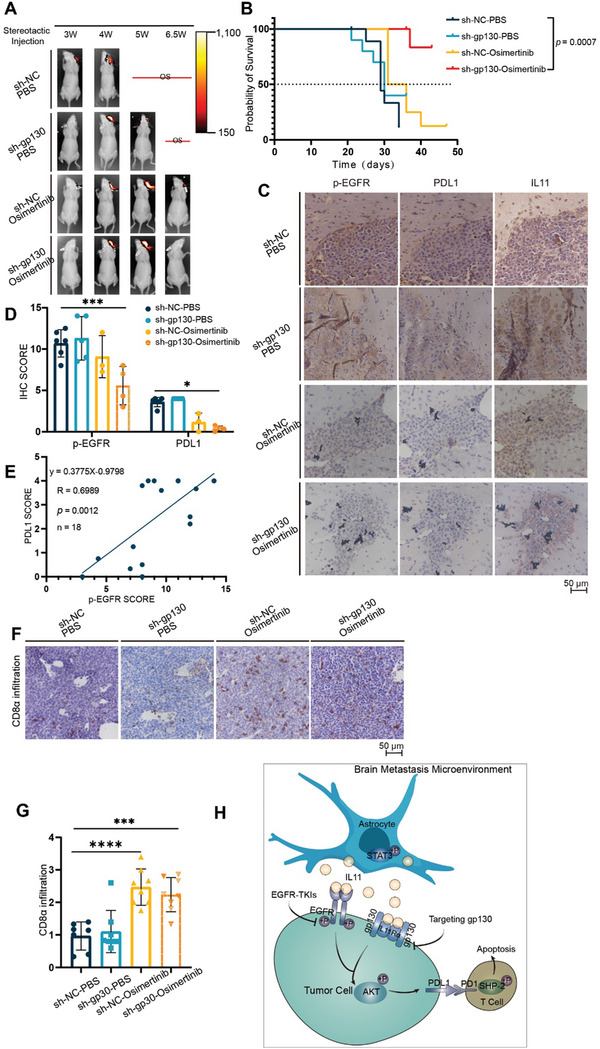
Patients who have non-small cell lung cancer (NSCLC) with epidermal growth factor receptor (EGFR) mutations are more prone to brain metastasis (BM) and poor prognosis. Previous studies showed that the tumor microenvironment of BM in these patients is immunosuppressed, as indicated by reduced T-cell abundance and activity, although the mechanism of this immunosuppression requires further study. This study shows that reactive astrocytes play a critical role in promoting the immune escape of BM from EGFR-mutated NSCLC by increasing the apoptosis of CD8+ T lymphocytes. The increased secretion of interleukin 11(IL11) by astrocytes promotes the expression of PDL1 in BM, and this is responsible for the increased apoptosis of T lymphocytes. IL11 functions as a ligand of EGFR, and this binding activates EGFR and downstream signaling to increase the expression of PDL1, culminating in the immune escape of tumor cells. IL11 also promotes immune escape by binding to its intrinsic receptor (IL11Rα/glycoprotein 130 [gp130]). Additional in vivo studies show that the targeted inhibition of gp130 and EGFR suppresses the growth of BM and prolongs the survival time of mice. These results suggest a novel therapeutic strategy for treatment of NSCLC patients with EGFR mutations.

Keywords: astrocytes; brain metastasis; epidermal growth factor receptor; immune escape; interleukin‐11.


Conflict of interest statement

The authors declare no conflict of interest.

Figures

Figure 1
Figure 1
BM from EGFR‐mutated NSCLC has a stronger immunosuppressive phenotype. A,B) Immunohistochemistry of CD3 and CD8α in cancer tissues of patients with primary lung cancer (PLC) or LCBM (scale bar: 100 µm), with quantitation of these results for CD3 (LCBM: n = 29; PLC: n = 29) and CD8α (LCBM: n = 28; PLC: n = 29), and comparisons using an unpaired, two‐tailed t‐test. C) Percentage of samples with high infiltration or low infiltration of CD8α among LCBM samples with and without EGFR mutations, determined by Sanger sequencing (mutation: n = 11; WT: n = 5). D) Relationship of CD8α infiltration score with p‐EGFR score in LCBM samples (n = 28, simple linear regression). E,F) Immunohistochemistry of CD8α, PDL1, and p‐EGFR in LCBM patients (scale bar: 100 µm), and relationship of these staining scores (n = 28, simple linear regression). G) Western blotting of PDL1 in PC9 parental cells (left) and brain metastatic derivatives (right). H) Flow cytometry results of Jurkat T cells (left) that were co‐cultured alone, with PC9 cells, or with PC9‐BrM3 cells for 24 h, and then harvested for analysis of apoptosis, indicated by dots in the right boxes (Q2+Q3). Quantitation of the results (right), with comparisons using an unpaired two‐tailed t‐test. I) CD8α, TUNEL, and DAPI staining of tumor sections from two EGFR‐mutated LCBM patients (scale bar: 10 µm). Western blotting and flow cytometry results show representative samples from three or more replicates. *(p < 0.05), **(p < 0.01), ***(p < 0.001), and ****(p < 0.0001).
Figure 2
Figure 2
Reactive astrocytes in the brain TME facilitate immune escape in LCBM. A–C) Immunohistochemistry of GFAP (marker of activated astrocytes) in LCBM samples (scale bars: 50 µm). (A) Human sample, showing BM (T) and parenchyma (P), with tumor tissue surrounded by astrocytes (a) and the black arrow showing infiltration of astrocytes into tumor tissue (b), n = 5. (B) BALB/c‐nu mouse sample, showing BM (T) and parenchyma (P), with the black arrows showing tumor tissue surrounded by astrocytes (a, b, c) and parenchymal cells distal from the tumor (d), n = 10. (C) C57 mouse sample, showing BM (T), with black arrows showing infiltration of astrocytes into tumor tissue (a, b), n = 5. D) Design of the co‐culture experimental model of astrocytes and tumor cells constructed using a Tissue Culture Plate insert (0.4 µm, PET membrane: 6 wells). E) Western blotting of p‐STAT3 and GFAP after astrocytes were co‐cultured with or without PC9‐BrM3 cells for 12 h. F) Western blotting of PDL1 in PC9 cells and PC9‐BrM3 cells that were co‐cultured with or without astrocytes for 12 h. G) Western blotting of PDL1 in PC9‐BrM3 cells that were treated with or without secretions for 12 h. H) Flow cytometry results of Jurkat T cells (left) that were co‐cultured with PC9‐BrM3 cells or PC9‐BrM3 cells that were co‐cultured with astrocytes for 24 h, and then harvested for analysis of apoptosis, indicated by dots in the right boxes (Q2+Q3). Quantitation of these results (right), with comparison using an unpaired two‐tailed t‐test. Western blotting, and flow cytometry results show representative samples from three or more replicates. Details of the co‐culture process for western blotting and flow cytometry are shown in the Supporting Information and Figure S7 (Supporting Information). *(p < 0.05), **(p < 0.01), ***(p < 0.001), and ****(p < 0.0001).
Figure 3
Figure 3
Astrocytes promote immune escape of LCBM by increasing IL11 secretion. A) qPCR of IL11 in astrocytes and PC9‐BrM3 cells that were co‐cultured or cultured separately for 12 h, with comparisons using an unpaired two‐tailed t‐test. B) ELISA of IL11 in astrocytes and PC9‐BrM3 or H1650 cells that were co‐cultured or cultured separately for 12 h, with comparisons using an unpaired two‐tailed t‐test. C) Immunohistochemistry of IL11 in PLC and LCBM tissues of patients (C[a]), and quantitation of results (C[b], LCBM: n = 29; PLC: n = 31), with comparison using an unpaired two‐tailed t‐test (scale bar: 50 µm). D) ELISA of IL11 levels in serum samples from an LCBM group (n = 24), PLC group (n = 27), other distant metastases group (LCNBM, n = 36) and healthy group (HG, n = 11), with comparisons using an unpaired two‐tailed t‐test. E) ELISA of IL11 levels in CSF from patients with LCBM (n = 7) or without LCBM (n = 6), with comparisons using an unpaired two‐tailed t‐test. F) Western blotting of PDL1 in PC9‐BrM3 cells that were treated with different concentrations of IL11 (0–30 mg mL−1 for 12 h; left), and quantitation of these results (right), with comparison using an unpaired two‐tailed t‐test. G) Flow cytometry of Jurkat T cells (left) that were co‐cultured with PC9‐BrM3 cells after treatment with or without IL11 (0–30 ng mL−1 for 12 h). Jurkat T cells were harvested for analysis of apoptosis, indicated by dots in the right boxes (Q2+Q3). Quantitation of these results (right), with comparison using an unpaired two‐tailed t‐test. Western blotting, qPCR, and flow cytometry results show representative samples from three or more replicates. Details of the co‐culture process for western blotting and flow cytometry are shown in the Supporting Information and Figure S7 (Supporting Information). *(p < 0.05), **(p < 0.01), ***(p < 0.001), and ****(p < 0.0001).
Figure 4
Figure 4
IL11 promotes immune escape in LCBM by activation of IL11Rα/gp130 and EGFR. A) Western blotting of PDL1 in PC9‐BrM3‐shgp130 cells that were treated with or without IL11 (10 ng mL−1 for 12 h; left), and quantitation of these results (right), with comparison using an unpaired, two‐tailed t‐test. B) Western blotting of PDL1, p‐EGFR, and EGFR in PC9‐BrM3 cells that were treated with or without IL11 (10 ng mL−1 for 12 h) and with or without gefitinib (6 µM for 18 h) (left), and quantitation of these results (right), with comparisons using a 2‐way ANOVA with Sidak's multiple comparisons test. C) Flow cytometry of Jurkat T cells (C[a]) that PC9‐BrM3 were treated with or without IL11 (10 ng mL−1 for 12 h) and with or without gefitinib (6 µM for 18 h), and then co‐cultured with Jurkat T for 24 h. Jurkat T cells were harvested for analysis of apoptosis, indicated by dots in the right boxes (Q2+Q3). Quantitation of the results (C[b]), with comparisons using an unpaired two‐tailed t‐test. D) Western blotting of PDL1, p‐EGFR, and EGFR in PC9‐BrM3‐shgp130 cells that were treated with or without IL11 (10 ng mL−1 for 12 h) and with or without gefitinib (6 µM for 18 h; left), and quantitation of these results (right), with comparisons using a 2‐way ANOVA with Tukey's multiple comparisons test. E) Western blotting of p‐EGFR, EGFR, p‐AKT, AKT, p‐ERK, and ERK in PC9‐BrM3 cells that were treated with or without IL11 (10 ng mL−1 for 12 h) and with or without gefitinib (6 µM for 18 h; left), and quantitation of these results (right), with comparisons using a 2‐way ANOVA with Tukey's multiple comparisons test. F) Western blotting of p‐EGFR, EGFR, p‐AKT, AKT, and PDL1 in PC9‐BrM3 cells that were treated with or without IL11 (10 ng mL−1 for 12 h) and with an AKT inhibitor (MK‐2206, 5 µM for 18 h; top), and quantitation of these results (bottom), with comparisons using a 2‐way ANOVA with Tukey's multiple comparisons test. G) Western blotting of PDL1, p‐EGFR, and EGFR in PC9‐BrM3 cells with or without silencing by shgp130, with or without IL11 (10 ng mL−1 for 12 h), and with different concentrations of gefitinib (0–12 µM for 18 h; left), and quantitation of PDL1 expression (right), with comparisons using an unpaired, two‐tailed t‐test. H) Western blotting of PDL1, p‐EGFR, and EGFR in PC9‐BrM3 cells with or without silencing by shgp130, with different concentrations of an IL11 neutralizing antibody (I5270; 0–20 ng mL−1 for 48 h), with or without gefinitib (6 µM for 18 h), and with or without IL11 (10 ng mL−1 for 12 h; left), and quantitation of PDL1 expression (right), with comparisons using an unpaired, two‐tailed t‐test. Western blotting and flow cytometry results show representative samples from three or more replicates. Details of the co‐culture process for western blotting and flow cytometry are shown in the Supporting Information and Figure S7 (Supporting Information). *(p < 0.05), **(p < 0.01), ***(p < 0.001), and ****(p < 0.0001).
Figure 5
Figure 5
IL11 binds to EGFR as a ligand and stimulates EGFR phosphorylation. A) Fluorescence microscopy of 293T cells that were transfected with different Venus fusion genes (scale bar: 100 µm). B) Front view (a), top view (b), and side view (c) of the interaction of EGFR dimer with two IL11 molecules, showing that the α‐helix barrel of IL11 had a parallel contact pattern with domain I of EGFR, and a cross‐contact pattern with domain III of EGFR. The EGFR monomers are pink and green, and the IL11 molecules are yellow and blue. A magnified view of the interaction between EGFR and IL11 (d), in which sticks show the residues involved in the interactions and stick colors have the same meanings as above. C) Probability distribution of the angles (a) and distances (b) defined in Figure S5D (Supporting Information), respectively. D) Distribution of the distance (dCC) formed by the C termini of two the domain IV regions during simulations. E) The major distinction between the staggered mode and flush mode is the angle (θ) formed by the Cα atom of I214 and P228 in one subunit, and the Cα atom of P228 in the other subunit. Calculations showed that removing EGF from the dimer decreased θ from 170° to 115°, indicating a change from the staggered mode to the flush mode. The insert shows top views of the staggered and flush conformations of the EGFR extracellular dimers. F) Western blotting of p‐EGFR, EGFR, p‐AKT, AKT, and PDL1 in PC9‐BrM3 cells that received no treatment (‐), treatment with WT IL11 (10 ng mL−1 for 12 h, Supporting Information), or treatment with five different IL11 mutants (10 ng mL−1 for 12 h, Supporting Information for 12 h). Western blotting and BiFC results show representative samples from three or more replicates.
Figure 6
Figure 6
Combined targeting of gp130 and EGFR inhibits PDL1 expression and restores T cell infiltration of brain lesions in mouse models. A) Whole‐body bioluminescence imaging of mice was performed every week beginning the third week after injection of PC9‐BrM3 cells to induce brain lesions. B) Survival curves of mice in the different treatment groups (NC+PBS: n = 10; NC+osimertinib: n = 8; sh‐gp130+PBS: n = 10; sh‐gp130+osimertinib: n = 7), with comparison using the log‐rank test. C,D) Immunohistochemistry of PDL1, p‐EGFR, and IL11 in brain lesions of mice that received different treatments (scale bar: 50 µm), and quantitation of staining scores, with comparisons using a 2‐way ANOVA with Tukey's multiple comparisons test. E) Relationship of the expression of PDL1 and p‐EGFR in brain lesions (n = 18, simple linear regression). F,G) Immunohistochemistry of CD8α infiltration of brain lesions in the different treatment groups (scale bar: 50 µm), and quantitation of these results, with comparisons using an unpaired, two‐tailed t‐test. H) Proposed mechanism of brain metastasis in EGFR‐mutated NSCLC, and blockage by osimertinib (EGFR‐TKI). Reactive astrocytes have high levels of p‐STAT3 and increased secretion of IL11 (top). IL11 binds to EGFR and gp130 on tumor cells, and activation of these receptors leads to phosphorylation of AKT (bottom‐left). P‐AKT increases the expression of PDL1 and induces the apoptosis of T cells (bottom‐right), culminating in immune escape. Osimertinib blocks EGFR activation and immune escape, and combined targeting of gp130 and EGFR inhibits PDL1 expression and immune escape (middle‐left). *(p < 0.05), **(p < 0.01), ***(p < 0.001), and ****(p < 0.0001).

References

    1. Waqar S. N., Samson P. P., Robinson C. G., Bradley J., Devarakonda S., Du L., Govindan R., Gao F., Puri V., Morgensztern D., Clin. Lung Cancer 2018, 19, e373. - PMC - PubMed
    1. Steeg P. S., Nat. Rev. Cancer 2016, 16, 201. - PMC - PubMed
    1. Andrews D. W., Scott C. B., Sperduto P. W., Flanders A. E., Gaspar L. E., Schell M. C., Werner‐Wasik M., Demas W., Ryu J., Bahary J. P., Souhami L., Rotman M., Mehta M. P., Curran W. J. Jr., Lancet 2004, 363, 1665. - PubMed
    1. Shan Y., Eastwood M. P., Zhang X., Kim E. T., Arkhipov A., Dror R. O., Jumper J., Kuriyan J., Shaw D. E., Cell 2012, 149, 860. - PubMed
    1. Shin D. Y., Na I. I., Kim C. H., Park S., Baek H., Yang S. H., J Thorac Oncol 2014, 9, 195. - PubMed

MeSH terms