. 2024 Nov 4;147(11):3727-3741.
doi: 10.1093/brain/awae137.

Distinct ultrastructural phenotypes of glial and neuronal alpha-synuclein inclusions in multiple system atrophy

Affiliations

Distinct ultrastructural phenotypes of glial and neuronal alpha-synuclein inclusions in multiple system atrophy

Carolin Böing et al. Brain. .

Abstract

Multiple system atrophy is characterized pathologically by the accumulation of alpha-synuclein (aSyn) into glial cytoplasmic inclusions (GCIs). The mechanism underlying the formation of GCIs is not well understood. In this study, correlative light and electron microscopy was employed to investigate aSyn pathology in the substantia nigra and putamen of post-mortem multiple system atrophy brain donors. Three distinct types of aSyn immuno-positive inclusions were identified in oligodendrocytes, neurons and dark cells presumed to be dark microglia. Oligodendrocytes contained fibrillar GCIs that were consistently enriched with lysosomes and peroxisomes, supporting the involvement of the autophagy pathway in aSyn aggregation in multiple system atrophy. Neuronal cytoplasmic inclusions exhibited ultrastructural heterogeneity resembling both fibrillar and membranous inclusions, linking multiple systems atrophy and Parkinson's disease. The novel aSyn pathology identified in the dark cells, displayed GCI-like fibrils or non-GCI-like ultrastructures suggesting various stages of aSyn accumulation in these cells. The observation of GCI-like fibrils within dark cells suggests these cells may be an important contributor to the origin or spread of pathological aSyn in multiple system atrophy. Our results suggest a complex interplay between multiple cell types that may underlie the formation of aSyn pathology in multiple system atrophy brain and highlight the need for further investigation into cell-specific disease pathologies in multiple system atrophy.

Keywords: alpha-synuclein; correlative light and electron microscopy; disease pathology; multiple system atrophy; post-mortem human brain.


Conflict of interest statement

The authors report no competing interests.

Figures
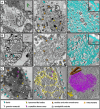
Figure 1
Figure 1
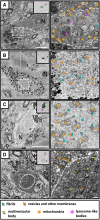
Glial cytoplasmic inclusion fibrils co-localize with vesicles, lysosome-like bodies and peroxisomes. Transmission electron microscopy (TEM) micrographs (left and middle) and segmentations of tomograms (right) showing different glial cytoplasmic inclusion (GCI) features localized by CLEM. Light microscopy images of alpha-synuclein (aSyn) immuno-staining used to identify GCIs is shown in the inset. (A) A GCI from the substantia nigra of Donor D. Osmiophilic vesicles, lysosome-like bodies and many vesicles can be seen amongst the long, unbranched and linearly arranged fibrils. (B) A GCI from the putamen of Donor C. Various vesicles and mitochondria can be seen amongst the fibrils, and nuclear fibrils are evident in some cases. The segmentation for both A and B (right) shows the long, linear arrangement of the fibrils in the GCI with an average width of 21 nm. (C) A large cluster of vesicles, lysosome-like bodies, and peroxisomes within a GCI from the putamen of Donor C (also shown in Supplementary Fig. 3b, left). The segmentation shows the position of the various membranous bodies (middle) and the crystalline structure typical of peroxisomes (right). N = nucleus. Scale bars: TEM, A and B, left = 2 µm, middle and right = 500 nm; EM, C, left and middle = 200 nm, right = 100 nm; light microscopy, insets = 5 µm.
Figure 2
Figure 2
Distinctive ultrastructures for neuronal alpha-synuclein-positive inclusions. (A) Transmission electron microscopy (TEM) micrograph of a neuronal inclusion (white dotted line) localized within the substantia nigra (SN) of Donor D. A higher magnification of the white frame seen in A is shown. The interior of this inclusion consisted of a mixture of fibrils, vesicles, mitochondria, and multi-vesicular bodies. (B) TEM micrograph of a fibrillar neuronal inclusion from the SN of Donor F is shown. The fibrils are intermixed with mitochondria. (C) TEM micrograph of a fibrillar neuronal inclusion from the SN of Donor D where the mitochondria are clustered together. (D) TEM micrograph of a membranous neuronal inclusion (white dotted line) localized within the SN of Donor C (also shown in Fig. 5B). The globular neuronal inclusion was ultrastructurally distinct from a neighbouring fibrillar glial cytoplasmic inclusion (GCI; black dotted line). A higher magnification of the white frame seen in A is shown. The interior of the neuronal inclusion consisted of highly condensed lysosome-like bodies, vesicles and other membranous material. The cytoplasm surrounding the alpha-synuclein (aSyn) immuno-positive area consists of more condensed membranes and vesicles, including mitochondria. No fibrils could be observed. Light microscopy images showing aSyn immuno-positive staining are shown in the insets. N = nucleus. M = myelin. Nm = neuromelanin. Scale bars: EM low magnification = 2 µm, high magnification = 500 nm; light microscopy = 5 µm.
Figure 3
Figure 3
Variable ultrastructures of dark cells suggest different cellular states of alpha-synuclein pathology. Transmission electron microscopy (TEM) micrographs (left and middle) and segmented tomograms (right) of alpha-synuclein (aSyn) immuno-positive microglia. Light microscopy (LM) images of aSyn immuno-staining used to identify dark cells are shown in insets. (A) An aSyn immuno-positive microglia from the putamen of Donor C has an ultrastructure visually similar to glial cytoplasmic inclusions (GCIs) with long, unbranched and linearly arranged 22 ± 7 nm fibrils interspersed with vesicles, lysosome-like bodies and peroxisomes. (B) An aSyn immuno-positive dark cell consisting of highly branched 6 ± 3 nm filaments arranged in a high-density mesh across the cytoplasm of the cell. The filaments are interspersed with vesicles, lysosome-like bodies, and membrane fragments. Mitochondria can be seen bordering the inclusion. The filamentous mesh is identical to the ultrastructure making up the cytoplasm of the non-pathological dark cell (C), therefore, it most likely represents the cytoskeleton of the cell. This dark cell was localized in the surrounding cellular area to B and identified based on its morphology by EM alone. As it was immuno-negative for aSyn, no LM staining is shown. (D) Left: An immuno-positive dark cell with fibrillar ultrastructure (yellow dotted line) is adjacent to an immuno-positive oligodendrocyte (purple dotted line) containing a GCI. Immuno-positive areas are outlined with a white dashed line. Middle: A higher magnification of the image shown in D shows a patch of fibrils from the GCI extending into the dark cell. Right: A TEM micrograph of the same area on an adjacent grid, approximately 1.5 µm away in z-height, shows that the aSyn immuno-positive area of the dark cell is in the same cell as the nucleus identified in the image on the left. The GCI of the adjacent oligodendrocyte was no longer visible in this section. N = nucleus. Scale bars: EM = 2 µm (left), 200 nm (middle and right); LM = 5 µm.
Figure 4
Figure 4
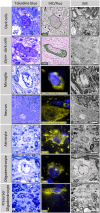
Correlative light and electron microscopy showing toluidine blue staining, immuno-fluorescence or immunohistochemistry staining, and the electron micrograph of the same cell. Toluidine blue staining highlights that dark cells are phenotypically distinct from other cell types. The dark cells were identified by the distinct phenotype of their nuclear toluidine blue staining, where both the heterochromatin and nucleoplasm are stained. No differences in the toluidine blue staining were observed between the dark cells and the alpha-synuclein (aSyn) immuno-positive dark cells, which were exclusively identified by immunohistochemistry (IHC) staining on adjacent sections (black dotted outline). For the other cell types, toluidine blue stained only the heterochromatin, leaving a clear nucleoplasm. Their specific cell type was identified by their positive staining for markers against neurons (neurofilament-H and MAP2 antibody cocktail), microglia (IBA1, P2RY12 and TMEM119 antibody cocktail), astrocytes (GFAP antibody), oligodendrocytes (MBP antibody) or precursor oligodendrocytes (NG2 antibody). Fluorescent images are maximum projections of z-stacks imaged in 30 µm free-floating brain sections. Toluidine blue, IHC and electron microscopy images were obtained from correlated 200 and 80 nm (respectively) ultrathin sections collected after resin embedding and correlative light and electron microscopy (CLEM) sectioning. The neuron shown here is also shown at lower magnification in Supplementary Fig. 15. Scale bars: dark cells and microglia = 2 µm; neuron = 10 µm; astrocyte, oligodendrocyte and precursor oligodendrocyte = 5 µm.
Figure 5
Figure 5
Comparison of glial cytoplasmic inclusions, neuronal cytoplasmic inclusions and dark cell ultrastructures. Transmission electron microscopy (TEM) micrographs (left and middle) and graphical representation (right) showing the ultrastructural composition of a glial cytoplasmic inclusion (GCI), neuronal cytoplasmic inclusion (NCI) and dark cell (white dotted lines) localized by correlative light and electron microscopy (CLEM). Light microscopy (LM) images of alpha-synuclein (aSyn) immuno-positive staining used to localize inclusions are shown in inserts. (A) GCIs are composed of long, linear fibrils which co-localize with vesicles, peroxisomes and lysosome-like bodies. The fibrils in this GCI extend into the cell’s processes. (B) NCIs can consist of densely packed vesicles and membrane fragments where no fibrils are visible, or can have a fibrillar ultrastructure intermixed with vesicles, membranes and mitochondria. (C) Dark cells can contain fibrillar bundles similar to a GCI, or non-fibrillar aSyn accumulation (D). These ultrastructures may represent different stages of aSyn accumulation in microglia. This figure was partially made with BioRender.com N = nucleus. Scale bars: EM = 2 µm (left), 500 nm (middle); LM = 5 µm.

References

    1. Gilman S, Wenning GK, Low PA, et al. Second consensus statement on the diagnosis of multiple system atrophy. Neurology. 2008;71:670–676. - PMC - PubMed
    1. Papp MI, Lantos PL. Accumulation of tubular structures in oligodendroglial and neuronal cells as the basic alteration in multiple system atrophy. J Neurol Sci. 1992;107:172–182. - PubMed
    1. Spillantini MG, Crowther RA, Jakes R, Hasegawa M, Goedert M. alpha-Synuclein in filamentous inclusions of Lewy bodies from Parkinson’s disease and dementia with Lewy bodies. Proc Natl Acad Sci U S A. 1998;95:6469–6473. - PMC - PubMed
    1. Spillantini MG, Crowther RA, Jakes R, Cairns NJ, Lantos PL, Goedert M. Filamentous alpha-synuclein inclusions link multiple system atrophy with Parkinson’s disease and dementia with Lewy bodies. Neurosci Lett. 1998;251:205–208. - PubMed
    1. Baba M, Nakajo S, Tu PH, et al. Aggregation of alpha-synuclein in Lewy bodies of sporadic Parkinson’s disease and dementia with Lewy bodies. Am J Pathol. 1998;152:879–884. - PMC - PubMed

MeSH terms

Substances